Abstract
Expansion microscopy (ExM) is a powerful technique to overcome the diffraction limit of light microscopy that can be applied in both tissues and cells. In ExM, samples are embedded in a swellable polymer gel to physically expand the sample and isotropically increase resolution in x, y, and z. The maximum resolution increase is limited by the expansion factor of the gel, which is four-fold for the original ExM protocol. Variations on the original ExM method have been reported that allow for greater expansion factors but at the cost of ease of adoption or versatility. Here, we systematically explore the ExM recipe space and present a novel method termed Ten-fold Robust Expansion Microscopy (TREx) that, like the original ExM method, requires no specialized equipment or procedures. We demonstrate that TREx gels expand 10-fold, can be handled easily, and can be applied to both thick mouse brain tissue sections and cultured human cells enabling high-resolution subcellular imaging with a single expansion step. Furthermore, we show that TREx can provide ultrastructural context to subcellular protein localization by combining antibody-stained samples with off-the-shelf small-molecule stains for both total protein and membranes.
🔬 Techniques
🔭 Microscopes
🧬 Organisms
💻 Software
✨ Fluorophores
🧪 Sample Preparation
🔬 Cell Lines
🏭 Microscope Brands
🧪 Reagent Suppliers
📷 Detectors
💻 Software Details
💾 Data Repositories
🏷️ Research Resource Identifiers (RRIDs)
Verified research resources used in this paper:
🏛️ Research Organizations (ROR)
Affiliated research institutions:
📋 Methods
Key resources table
Reagent type (species) or resource Designation Source or reference Identifiers Additional information Antibody Goat polyclonal anti-rabbit IgG (H+L) Alexa Fluor 488 Abcam Cat# 150077; RRID: AB_2630356 IF (1:500) Antibody Goat polyclonal anti-mouse IgG3 Alexa Fluor 594 Invitrogen Cat# A-21155; RRID :AB_2535785 IF (1:500) Antibody Goat polyclonal anti-chicken CF633 Biotium Cat# 20126; RRID :AB_10852831 IF (1:500) Antibody Goat polyclonal anti-rabbit IgG (H+L) Alexa Fluor 594 Molecular Probes Cat# A11037; RRID :AB_2534095 IF (1:400–1:200) Antibody Goat polyclonal anti-mouse IgG (H+L) Alexa Fluor 488 Molecular Probes Cat# A11029; RRID :AB_2534088 IF (1:400–1:200) Antibody Goat polyclonal anti-chicken IgY (H+L) Alexa Fluor 488 Molecular Probes Cat# A11039; RRID :AB_2534096 IF (1:400–1:200) Antibody Mouse monoclonal anti-CD3 STEMCELL Technologies Cat# 60011 IF (1:250) Antibody Rabbit monoclonal anti-α-tubulin Abcam Cat# ab52866; RRID :AB_869989 IF (1:250) Antibody Mouse monoclonal anti-clathrin heavy chain Thermo Fisher Scientific Cat# MA1-065; RRID :AB_2083179 IF (1:250) Antibody Chicken polyclonal anti-GFP Aves Labs Cat# GFP-1010; RRID: AB_2307313 IF (1:400–1:200) Antibody Rabbit polyclonal anti-NUP153 Abcam Cat# ab84872; RRID: AB_1859766 IF (1:200) Antibody Chicken polyclonal anti-Bassoon Synaptic Systems Cat# 141016; RRID: AB_2661779 IF (1:300) Antibody Rabbit polyclonal anti-Homer Abcam Cat# 97593; RRID: AB_10681160 IF (1:300) Antibody Mouse monoclonal IgG3 anti-VGAT Synaptic Systems Cat# 131011; RRID: AB_887872 IF (1:300) Cell line ( Homo sapiens ) U-2 OS-CRISPR-NUP96-mEGFP Cell Lines Service Cat# 195 Transfected construct ( H. sapiens ) pAc-GFPC1-Sec61beta Addgene Cat# 15108; RRID: Addgene_15108 Recipe space exploration Gelation chambers A glass slide served as the bottom piece of each gelation chamber. Four strips of 250-µm-thick adhesive silicone material (DigiKey Cat# L37-3F-320-320-0.25-1A), ~ 3 mm wide and running the width of the slide, were adhered to the slide to partition it into three separate chambers, each ~12 mm wide. A plus-charged glass slide was placed over the silicone strips to form the top of the gelation chamber and held in place with tape. Two sides of each chamber were open to air, providing a convenient fill port for adding ~100 µL of monomer solution after chamber construction.
Show full methods section
Key resources table
Reagent type (species) or resource Designation Source or reference Identifiers Additional information Antibody Goat polyclonal anti-rabbit IgG (H+L) Alexa Fluor 488 Abcam Cat# 150077; RRID: AB_2630356 IF (1:500) Antibody Goat polyclonal anti-mouse IgG3 Alexa Fluor 594 Invitrogen Cat# A-21155; RRID :AB_2535785 IF (1:500) Antibody Goat polyclonal anti-chicken CF633 Biotium Cat# 20126; RRID :AB_10852831 IF (1:500) Antibody Goat polyclonal anti-rabbit IgG (H+L) Alexa Fluor 594 Molecular Probes Cat# A11037; RRID :AB_2534095 IF (1:400–1:200) Antibody Goat polyclonal anti-mouse IgG (H+L) Alexa Fluor 488 Molecular Probes Cat# A11029; RRID :AB_2534088 IF (1:400–1:200) Antibody Goat polyclonal anti-chicken IgY (H+L) Alexa Fluor 488 Molecular Probes Cat# A11039; RRID :AB_2534096 IF (1:400–1:200) Antibody Mouse monoclonal anti-CD3 STEMCELL Technologies Cat# 60011 IF (1:250) Antibody Rabbit monoclonal anti-α-tubulin Abcam Cat# ab52866; RRID :AB_869989 IF (1:250) Antibody Mouse monoclonal anti-clathrin heavy chain Thermo Fisher Scientific Cat# MA1-065; RRID :AB_2083179 IF (1:250) Antibody Chicken polyclonal anti-GFP Aves Labs Cat# GFP-1010; RRID: AB_2307313 IF (1:400–1:200) Antibody Rabbit polyclonal anti-NUP153 Abcam Cat# ab84872; RRID: AB_1859766 IF (1:200) Antibody Chicken polyclonal anti-Bassoon Synaptic Systems Cat# 141016; RRID: AB_2661779 IF (1:300) Antibody Rabbit polyclonal anti-Homer Abcam Cat# 97593; RRID: AB_10681160 IF (1:300) Antibody Mouse monoclonal IgG3 anti-VGAT Synaptic Systems Cat# 131011; RRID: AB_887872 IF (1:300) Cell line ( Homo sapiens ) U-2 OS-CRISPR-NUP96-mEGFP Cell Lines Service Cat# 195 Transfected construct ( H. sapiens ) pAc-GFPC1-Sec61beta Addgene Cat# 15108; RRID: Addgene_15108 Recipe space exploration Gelation chambers A glass slide served as the bottom piece of each gelation chamber. Four strips of 250-µm-thick adhesive silicone material (DigiKey Cat# L37-3F-320-320-0.25-1A), ~ 3 mm wide and running the width of the slide, were adhered to the slide to partition it into three separate chambers, each ~12 mm wide. A plus-charged glass slide was placed over the silicone strips to form the top of the gelation chamber and held in place with tape. Two sides of each chamber were open to air, providing a convenient fill port for adding ~100 µL of monomer solution after chamber construction.
Gel synthesis and characterization
Sodium acrylate was made by neutralizing acrylic acid (Sigma, 147230) with NaOH until the pH reached the range of 7.5–8. Initial neutralization (until pH ~7) was done with 10 N NaOH on ice and using a fume hood. Neutralization was done in a volume of water calculated to yield a final concentration of 4 M sodium acrylate. The gel recipes for each family contained 1× phosphate buffered saline (PBS) and the amounts of acrylamide (Sigma, A4058), sodium acrylate, and initiator (APS, Sigma, A3678) indicated in Figure 1A . Each gel recipe contained the same amount of TEMED (Sigma, T7024) as APS. For each recipe family, gelation solution with crosslinker withheld (but including APS and TEMED) was premixed on ice, in one tube for each recipe family. This solution was then split into six tubes and mixed with serial dilutions of crosslinker (bisacrylamide, Sigma, M1533) to yield complete gelation solution with final crosslinker concentrations (in µg/mL) of 1000, 300, 100, 30, 10, and 0. Complete gelation solution was pipetted into gelation chambers and incubated at 50°C for 1 hr (family E) or 37°C for 2 hr (families A–D). Gels were then cooled for 15 min at RT and chamber tops carefully removed. Gels typically remained stuck exclusively to the top (plus charged) slide. Samples of each gel were taken with a 6 mm biopsy punch, taking care to avoid material within ~2 mm of the chamber edges (to avoid oxygen exposure from air or silicone material during gelation). Excess gel was scraped away with a razor blade. A few drops of distilled water were pipetted onto each gel to help release them from the glass slide. Each 6 mm gel specimen was gently released from the slide with a razor blade, placed in a 9 cm Petri dish and expanded by washing with excess water 2 × 15 min followed by 2 × 1 hr. Diameters of expanded gels were measured and divided by 6 mm to obtain the expansion factor. A semi-circle 25 mm in diameter was punched from each gel using a cookie cutter. Semi-circular gel punches were placed in a plastic tray, which was stood up on end so that the gel stood upright on its curved side, allowing the flat edge to deform under the force of gravity. Each gel was photographed, with a ruler positioned for scale. Using ImageJ, each top edge was described by seven manually chosen points, which were then fit to a circle. This best-fit circle was used to calculate the vertical deviation of the gel corners, which was divided by the gel radius to obtain the deformation index. TREx gelation solution Sodium acrylate was either purchased (Sigma, 408220) or made by neutralizing acrylic acid as described above. The TREx gelation solution contains 1.1 M sodium acrylate, 2.0 M acrylamide (AA), 50 ppm N,N’-methylenebisacrylamide (bis), PBS (1x), 1.5 ppt APS, 1.5 ppt TEMED, and (optionally, for thick tissue slices) 15 ppm 4-hydroxy TEMPO (4HT, Sigma, 176141).Monomer solution was made by combining all components of gelation solution except APS, TEMED, and 4HT. Monomer solution may be aliquoted and stored at –20°C, but must be thawed at RT and vortexed before use to redissolve any acrylamide crystals that may have precipitated at low temperature before freezing. Fully dissolved monomer solution may be kept on ice for up to several hours before crystallization occurs. 4HT, TEMED, and APS were added to monomer solution to produce gelation solution directly before use.
Tissue experiments Fixation and antibody staining
Mice were transcardially perfused with ice-cold 4% formaldehyde in 100 mM sodium phosphate buffer, pH 7.4. Brains were dissected out and post-fixed in 4% formaldehyde at 4°C overnight ( Figure 2A ) or for 2 hr ( Figure 2B ), followed by washing with PBS (1×) and slicing by vibratome at 100 μm. For Figure 2B , slices were stained with standard IHC procedures. Primary antibodies were used at 1:300 dilution in PBS with 0.1% Triton and 2% bovine serum albumin (BSA) (PBT) overnight at 4°C (chicken anti-Bassoon, Synaptic Systems, Cat# 141016, RRID: AB_2661779 ; rabbit anti-Homer, Abcam, Cat# 97593, RRID: AB_10681160 ; mouse IgG3 anti-VGAT, Synaptic Systems, Cat# 131011, RRID: AB_887872 ). Sections were washed 3 × 30 min in PBT and stained for at least 6 hr in secondary antibodies 1:500 in PBT at RT (goat anti-rabbit Alexa Fluor 488, Abcam, Cat# 150077, RRID: AB_2630356 ; goat anti-mouse IgG3 Alexa Fluor 594, Invitrogen, Cat# A-21155, RRID :AB_2535785 ; goat anti-chicken CF633, Biotium, Cat# 20126, RRID :AB_10852831 ). Stained sections were washed 3 × 30 min in PBS. TREx Brain slices were treated with 100 μg/mL ( Figure 2A ) or 10 μg/mL ( Figure 2B ) acryloyl-X SE (Thermo Fisher, A20770) in PBS (diluted from a 10 mg/mL anhydrous DMSO stock solution) for 1 hr at RT, followed by rinsing with PBS. Slices were incubated with TREx gelation solution (using 50 µg/mL bis and with 4HT added up to 15 µg/mL) for 20 min on ice with shaking. Following incubation on ice, each tissue specimen was placed on a glass slide at RT. Four dabs of vacuum grease were applied to the slide, with each dab at least several millimeters from the tissue specimen. A coverslip was placed over the tissue and vacuum grease dabs, and pressed down until contacting the tissue, taking care not to let the tissue slide around on the slide. The vacuum grease served to hold the assembly in place, thus forming the gelation chamber. Gelation solution was pipetted into the chamber from the side to fully surround the tissue. The chamber was incubated at 37°C for 1 hr to complete gelation. Following embedding, excess gel was removed with a razor blade, and gelled slices were recovered into PBS. The gel for Figure 2B was digested in proteinase K (NEB, P8107S) diluted 1:1000 in PBS for 3 hr at RT and washed in PBS 4 × 30 min. Gels for both Figure 2A and B were then placed into disruption buffer (5% SDS, 200 mM NaCl, 50 mM Tris pH 7.5) in a 2 mL Eppendorf tube and incubated at 80°C for 3 hr followed by rinsing in 0.4 M NaCl and washing 2 × 30 min in PBS. Gels were stained with BODIPY-FL NHS (total protein stain) at 10–20 μM ( Figure 2A ) or DAPI at 200 µg/L ( Figure 2B ) in PBS for 1 hr at RT. Gels were placed in glass-bottom six-well plates and washed in Milli-Q water 3 × 15 min followed by 2 × 1 hr to fully expand. Gels were imaged using a Zeiss LSM 800 confocal microscope with ×40/1.1 NA, water immersion objective ( Figure 2A ), or Zeiss Z1 lightsheet microscope with ×10/0.3 NA illumination objectives and ×20/1.0 NA water immersion detection objective ( Figure 2B ). Image processing For Figure 2A , raw data was drift corrected using Huygens Professional (SVI) and imported into ImageJ, where a sum projection of two planes (z-spacing: 0.8 µm) was made. Figure 2B is a maximum projection of two planes (z-spacing: 0.38 µm) and indicated zoom is a volumetric render of the raw data in Arivis. Synaptic distance Raw data was segmented using ilastik Pixel and Object segmentation workflows ( Berg et al., 2019 ). For each Homer-positive segmented object (postsynaptic compartment), the closest Bassoon-positive segmented object (presynaptic compartment) was selected. Synaptic distance was defined as the distance between the local peaks in intensity that were closest to the mask center of mass in 3D. Synaptic marker intensity line plots For Figure 2—figure supplement 1B , max projections of 31 planes in three fields of view were used to get the intensities of Bassoon and Homer from synapses that were perpendicular to the imaging plane. The values were then peak normalized. NPC experiment Cell culture, fixation, and antibody staining U2OS cells with homozygous GFP-NUP96 knock-in (Cell Lines Service, no. 195) were maintained in DMEM (Corning) supplemented with 10% fetal bovine serum (FBS) (Gibco), 1% L-glutamine (Gibco), and 1% penicillin-streptomycin (Gibco). Cells were tested for mycoplasma contamination prior to use for this work. Exponentially growing cells were harvested and seeded onto 12 mm, No. 1 coverslips (Carolina Biological Supply) for use in ExM. Cells were grown at 37°C and 5% CO 2 . Cells were fixed with 4% formaldehyde (EMS, RT 15714) in 1× PBS for 10 min at RT, then rinsed with 1× PBS. Cells were stained with standard immunocytochemistry (ICC) procedures. Primary antibodies were used at 1:200 dilution in PBS with 0.1% Triton and 2% BSA (PBT) for 2 hr at RT (chicken anti-GFP, Aves Labs, Cat# GFP-1020, RRID: AB_10000240 ; rabbit anti-NUP153, Abcam, Cat# ab84872, RRID: AB_1859766 ), followed by washing 3 × 5 min in 1× PBS. Secondary antibodies were used at 1:200 dilution in PBT for 2 hr at RT or at 4°C overnight (goat anti-chicken Alexa Fluor 488, Thermo Fisher Scientific, Cat# A11039, RRID:AB_2534096 ; goat anti-rabbit Alexa Fluor 594, Thermo Fisher Scientific, Cat# A11037, RRID:AB_2534095 ), followed by washing 3 × 5 min in 1× PBS. Stained cells were imaged before expansion on an epifluorescence microscope, Nikon Ti-E with ×60/1.2 NA water immersion objective. The imaged region was indicated by marking the back of the coverslip with a marker. TREx Fixed cells were anchored with 100 µg/mL AcX in 1× PBS for 1 hr at RT and embedded using the TREx gelation solution. The gelation chamber was constructed from a 20-mm-diameter, adhesive-backed silicone gasket (Sigma, GBL665504) affixed to a glass slide. The 12 mm coverslip with cultured cells was affixed to the center of the gelation chamber with a dab of vacuum grease and covered with PBS. TEMED and APS were then added to the TREx monomer solution on ice and mixed well to produce gelation solution. The PBS was tipped off from the cells, which were rinsed with ~100 μL of gelation solution. Approximately 200 μL of gelation solution was placed into the gelation chamber, which was sealed with a 22-mm-square #2 coverslip. The completed gelation chamber was placed at 37°C for 1 hr to complete gelation. The chamber was disassembled and the gel carefully trimmed with a curved scalpel into a right trapezoid shape centered around the pre-gelation imaged area. The trimmed trapezoid was photographed with a ruler for scale, quickly to avoid shrinking due to evaporation, and recovered into PBS. The gel was then digested with proteinase K (NEB, P8107S) diluted 1:1000 in PBS for 3 hr at RT and washed in PBS 4 × 30 min. Digested gels were placed into disruption buffer (5% SDS, 200 mM NaCl, 50 mM Tris pH 7.5) in a 2 mL Eppendorf tube and incubated at 80°C for 3 hr followed by rinsing in 0.4 M NaCl and washing 2 × 30 min in PBS. Disrupted gels were expanded fully with several washes in deionized water, photographed again with a ruler for scale, and imaged with a Zeiss LSM 800 confocal microscope with ×40/1.1 NA water immersion objective.
Data analysis
The gel size before and after expansion was measured from the gel photographs. The centers of 60 randomly chosen NPCs in three nonadjacent cells were identified manually and saved as an ROI list in ImageJ. The radial intensity distribution of each NPC was computed using the ‘Radial Profile Plot’ plugin ( https://imagej.nih.gov/ij/plugins/radial-profile.html ) and saved as a .csv. Radial intensity distributions were loaded into MATLAB for further processing. A Gaussian distribution was fit to a window in the middle of each profile, and the center of the Gaussian was taken as the radius of the corresponding NPC. Wild-type, transfected, and T cell experiments Cell culture Jurkat T cells (clone E6.1) were grown in RPMI 1640 medium w/ L-glutamine (Lonza) supplemented with 9% FBS and 1% penicillin/streptomycin. For T cell activation, 18 mm #1.5 coverslips (Marienfeld, 107032) were coated with poly-D-lysine (Thermo Fisher Scientific, A3890401), washed with PBS and incubated overnight at 4°C with a mouse monoclonal anti-CD3 (clone UCHT1, STEMCELL Technologies, #60011) 10 μg/mL in PBS. Cells were spun down for 4 min at 1000 rpm and resuspended in fresh, prewarmed RPMI 1640 medium, after which cells were incubated on the coated coverslips for 3 min prior to fixation. U2OS and COS7 cells were cultured in DMEM medium supplemented with 9% FBS and 1% penicillin/streptomycin. U2OS cells were transfected with GFP-Sec61β (Addgene, 15108) using FuGENE6 (Promega). Caco2-BBE cells (a gift from S.C.D. van IJzendoorn, University Medical Center Groningen, the Netherlands) were maintained in DMEM supplemented with 9% FBS, 50 µg/µL penicillin/streptomycin and 2 mM L-glutamine. For imaging, cells were seeded on 6.5 mm Transwell filters (3470; Corning) at a density of 1 × 10 5 /cm 2 and cultured for 10–12 days to allow for spontaneous polarization and brush border formation. All cell lines were tested for mycoplasma contamination prior to use in this work. Immunofluorescence, mCLING treatment, and antibody staining Cells were fixed for 10 min with prewarmed (37°C) 4% paraformaldehyde + 0.1% glutaraldehyde in PBS. For visualization of lipid membranes, cells were washed twice in PBS after fixation and incubated in 5 μM either mCLING-Atto647N (Synaptic Systems, 710 006AT1) or mCLING-Atto488 (Synaptic Systems, 710 006AT3) in PBS overnight at RT. The following day, cells were fixed a second time with prewarmed (37°C) 4% paraformaldehyde + 0.1% glutaraldehyde in PBS. For clathrin heavy chain labeling in Figure 3E and tubulin labeling of COS7 cells in Figure 3G , cells were pre-extracted for 1 min with prewarmed (37°C) extraction buffer (80 mM K-PIPES pH 6.8, 4 mM MgCl 2 , 1 mM EGTA, 0.35% Trition X-100, 0.2% glutaraldehyde). After extraction, cells were fixed for 10 min with prewarmed 4% paraformaldehyde in PBS. Next, cells were washed with PBS and permeabilized using PBS + 0.2% Triton X-100. Cells should be permeabilized even if no antibody staining will be done to ensure uniform gelation. Epitope blocking and antibody labeling steps were performed in PBS + 3% BSA. For immunofluorescence staining, we used a rabbit monoclonal antibody against α-tubulin (clone EP1332Y, Abcam, ab52866), a mouse monoclonal antibody against clathrin heavy chain (Thermo Fisher Scientific, MA1-065), and a chicken polyclonal antibody against GFP (Aves Labs, GFP-1010) in combination with goat anti-rabbit IgG (H+L) Alexa Fluor 594 (Molecular Probes, a11037), goat anti-mouse IgG (H+L) Alexa Fluor 488 (Molecular Probes, a11029), and goat anti-chicken IgY (H+L) Alexa Fluor 488 (Molecular Probes, a11039), respectively. TREx For TREx experiments shown in Figures 3E–G , 4 and 5 , samples were treated with 100 μg/mL acryloyl-X SE (AcX) (Thermo Fisher, A20770) in PBS overnight at RT. In these experiments, TEMED and bis were used at a concentration of 15 ppt and 90 ppm, respectively. 170 μL of gelation solution was transferred to a silicone gasket with inner diameter of 13 mm (Sigma-Aldrich, GBL664107) attached to a parafilm-covered glass slide, with the sample put cell-down on top to close off the gelation chamber. The sample was directly transferred to a 37°C incubator for 1 hr to fully polymerize the gel. All gels excluding samples that were processed for subsequent NHS ester staining were transferred to a 12-well plate and digested with 7.5 U/mL Proteinase-K (Thermo Fisher, EO0491) in TAE buffer (containing 40 mM Tris, 20 mM acetic acid, and 1 mM EDTA) supplemented with 0.5% Triton X-100, 0.8 M guanidine-HCl, and DAPI for 4 hr at 37°C. The gel was transferred to a Petri dish, water was exchanged 2 × 30 min, and the sample was left in MilliQ water to expand overnight. For NHS staining, gels were first treated in disruption buffer containing 200 mM SDS, 200 mM NaCl, and 50 mM Tris pH 6.8 for 1.5 hr at 78°C. Gels were washed twice for 15 min in PBS and incubated with 20 μg/mL Atto 594 NHS ester (Sigma-Aldrich, 08471) in PBS prepared from a 20 mg/mL stock solution in DMSO for 1 hr at RT with shaking. After staining, gels were washed with excess of PBS, transferred to a Petri dish, and expanded overnight. Prior to imaging, the cells were trimmed using a scalpel blade to fit in an Attofluor Cell Chamber (Molecular Probes A-7816).
Image acquisition and analysis
ExM and pre-expansion images were acquired using a Leica TCS SP8 STED 3X microscope equipped with an HC PL APO ×86/1.20W motCORR STED (Leica 15506333) water objective. A pulsed white laser (80 MHz) was used for excitation; when using STED, a 775 nm pulsed depletion laser was used. The internal Leica GaAsP HyD hybrid detectors were used with a time gate of 1 ≤ tg ≤ 6 ns. The set-up was controlled using LAS X. All data processing and analysis were done using MATLAB, ImageJ, and Arivis. Figure 3E panels are sum projections of three planes (z-spacing 0.35 µm). For the CCP diameter analysis in Figure 3F , line scans over individual CCPs that had clearly distinguishable central nulls were drawn. From these line scans, the peak-to-peak distance was determined, which corresponds to the diameter of each CCP. All line scans were generated using ImageJ and processed using GraphPad Prism 8. Figure 3H panels are maximum intensity projections of the bottom ~1 µm of cells. For Figure 3I and J , BigWarp ( Bogovic et al., 2016 ) was used to manually pick control points for nonrigid registration. The analysis scripts ‘bigwarpSimilarityPart.groovy’ and ‘Apply_Bigwarp_Xfm_csvPts.groovy’ were used to calculate deformation fields that register expanded images to pre-expansion images and decompose each deformation field into a similarity part (corresponding to theoretical ideal expansion) and a residual elastic part (thin-plate spline, corresponding to nonideal deformations introduced by expansion), adapted from Jurriens et al., 2021 . The similarity part was used to find the macroscopic expansion factor, while the residual elastic part was used to calculate the measurement error as follows. A MATLAB script was used to calculate the measurement error for all pairs of points in the image as described in Chen et al., 2015 by finding the magnitude of the difference between the displacement vectors for each pair of points in the residual elastic deformation field. These differences were binned according to the distance between points in the pre-expansion image. For each measurement length bin, the mean and standard deviation of measurement errors were calculated and plotted. Figure 4A raw data was imported in Arivis, a Discrete Gaussian Filter with smoothing radius of 2 was applied, and this dataset was used for volumetric renders and clipping. Gamma was adjusted manually to increase visibility of plasma membrane ruffles and intracellular organelles in the same view. For Figure 4B , the same raw dataset was imported in ImageJ and a sum projection of three planes (z-spacing: 0.35 µm) around the plane of the immunological synapse was segmented for mitochondria using the trainable Weka segmentation plugin in ImageJ. Figure 4C is a sum projection of 3 planes (z-spacing 0.35 µm). The line scan in Figure 4C was generated using ImageJ and processed using GraphPad Prism 8. For Figure 4D , raw data was imported in Arivis, a Discrete Gaussian Filter with smoothing radius of 2 was applied, and this dataset was volumetrically rendered with the opacity mapped to the z-axis. Figure 4E is a sum projection of five slices (z-spacing 0.35 µm). Figure 4F–H are sum projections of three planes (z-spacing: 0.35 µm) and respective zooms. For the MV diameter analysis in Figure 4H , sum projections of three planes were thresholded (ImageJ, set to auto), watershed to split joining particles, and the area determined using the analyze particles function in ImageJ, which was converted to diameter as in Julio et al., 2008 . Figure 5A panels are sum projections of three planes (z-spacing before expansion and after expansion 0.07 and 0.15 µm, respectively), reslices are sum projections (three planes) of resliced data. Figure 5B panels are sum projections of three planes (z-spacing: 0.35 µm). For ER tubule diameter analysis in Figure 5C , line scans were drawn over tubules that were positive for both Sec61-GFP and mCLING. The full width at half maximum was determined for each line scan. For Figure 5D , raw data was imported into Arivis, a Discrete Gaussian Filter with smoothing radius of 2 was applied, and this dataset was used for volumetric renders and clipping. Shown single planes are sum projections of three slices (z-spacing 0.35 µm) of the same raw data and were processed using ImageJ. Figure 5E is a maximum projection of three planes (z-spacing: 0.35 µm).
Additional files Transparent reporting form
📊 Figures
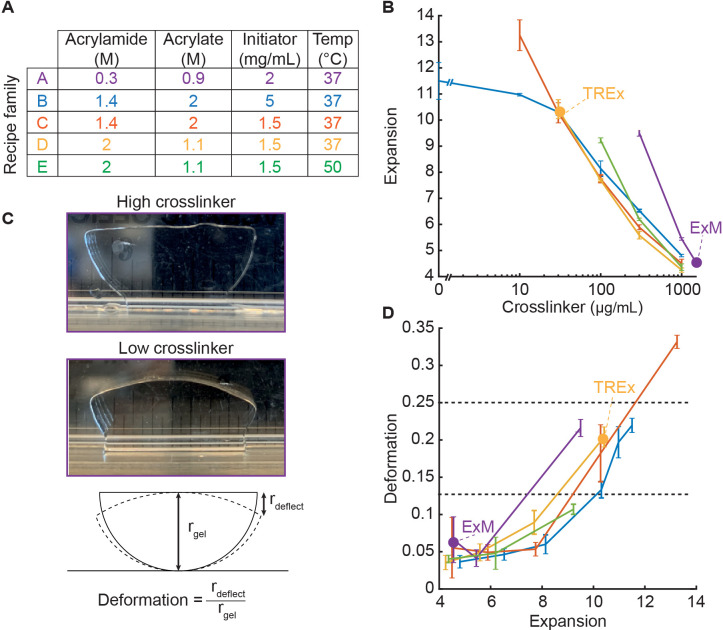
Figure 1.
Development of Ten-fold Robust Expansion Microscopy (TREx) gel recipe.
( A ) Parameters of gel recipe families explored, including component concentrations and gelation temperature. Each family was characterized by keeping these conditions constant while systematically v...
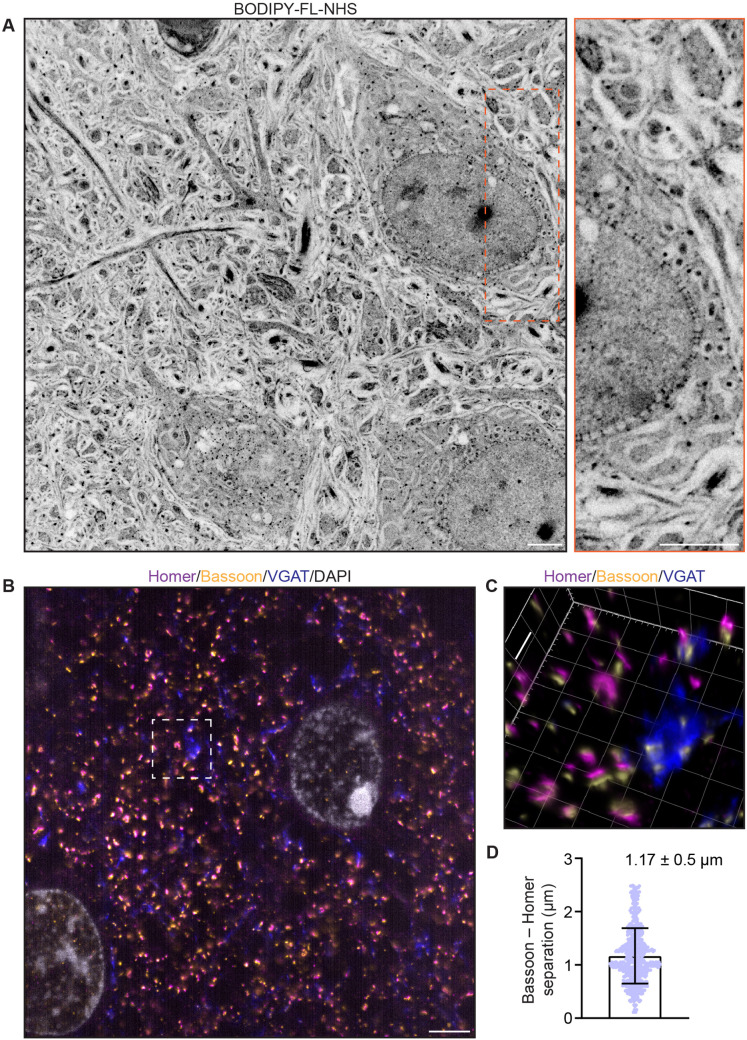
Figure 2.
Ten-fold Robust Expansion Microscopy (TREx) in mouse brain tissue slices.
( A ) Mouse brain tissue (cortex) expanded using TREx, stained for total protein content with BODPIY-FL NHS, and imaged by confocal microscopy. Displayed contrast is inverted to show dense stained reg...
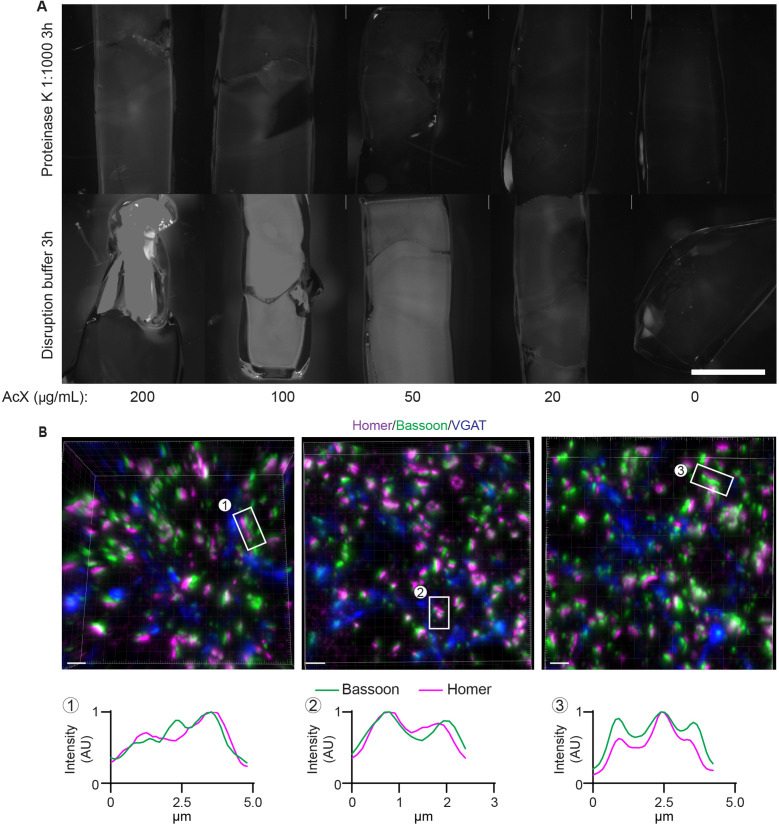
Figure 2u2014figure supplement 1.
Comparison of anchoring and disruption conditions.
( A ) Mouse brain tissue samples anchored with varying amounts of acryloyl-X SE (AcX), stained with NHS ester dye and disrupted with two methods: proteinase K diluted 1:1000 into phosphate buffered sa...
Figure 2u2014video 1.
Z-stack of Figure 2A .
Figure 2u2014video 2.
3D render of Figure 2B .
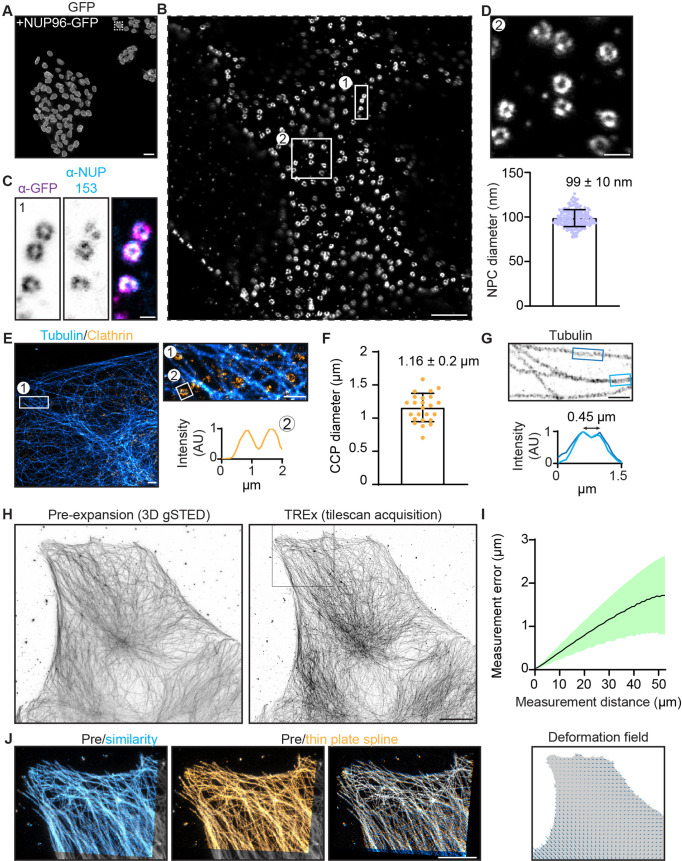
Figure 3.
Characterization of expansion isotropy using Ten-fold Robust Expansion Microscopy (TREx).
( A ) U2OS knock-in cells with homozygous NUP96-GFP, amplified with anti-GFP antibodies. ( B ) One nucleus from boxed region of ( A ), imaged by confocal microscopy after TREx. ( C ) High-resolution v...
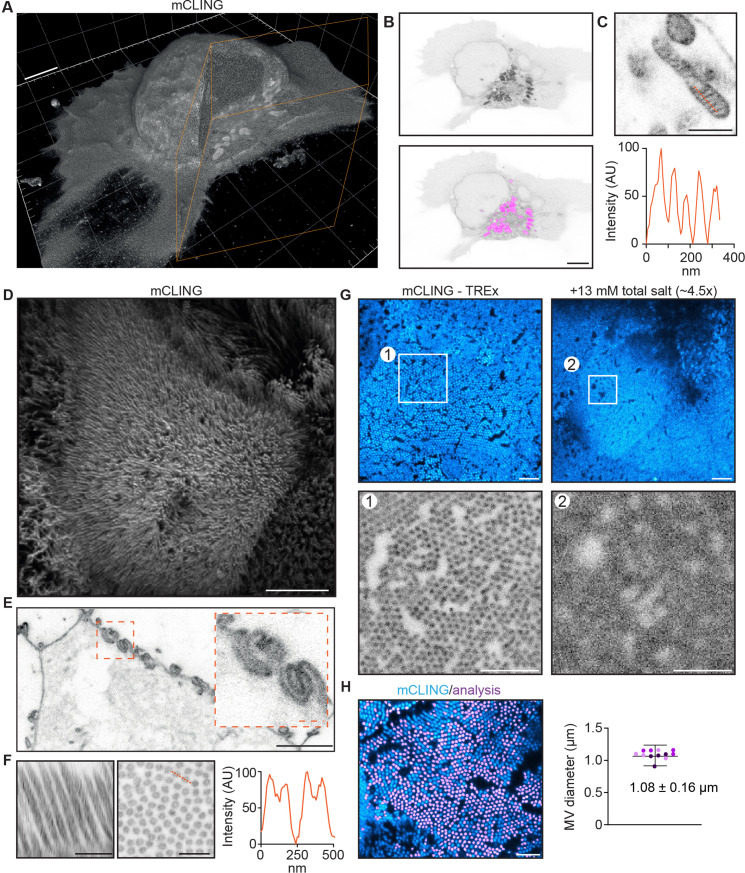
Figure 4.
Ten-fold Robust Expansion Microscopy (TREx) can be used to visualize the ultrastructure of cellular membranes.
( A ) Volumetric render of Jurkat T cell activated on anti-CD3-coated coverslip fixed and stained using mCLING. Colored clipping planes indicate portion clipped out to reveal intracellular detail. ( B...
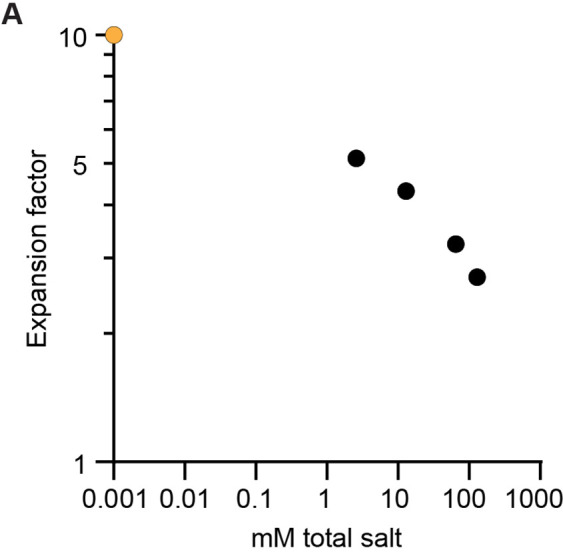
Figure 4u2014figure supplement 1.
Expansion factor versus ionic strength.
( A ) Expansion factor of Ten-fold Robust Expansion Microscopy (TREx) gel without biological sample as a function of ionic strength. Black dots are measured values with mM total salt being derived fro...
Figure 4u2014video 1.
3D render of Figure 4A .
Figure 4u2014video 2.
3D render of Figure 4D .
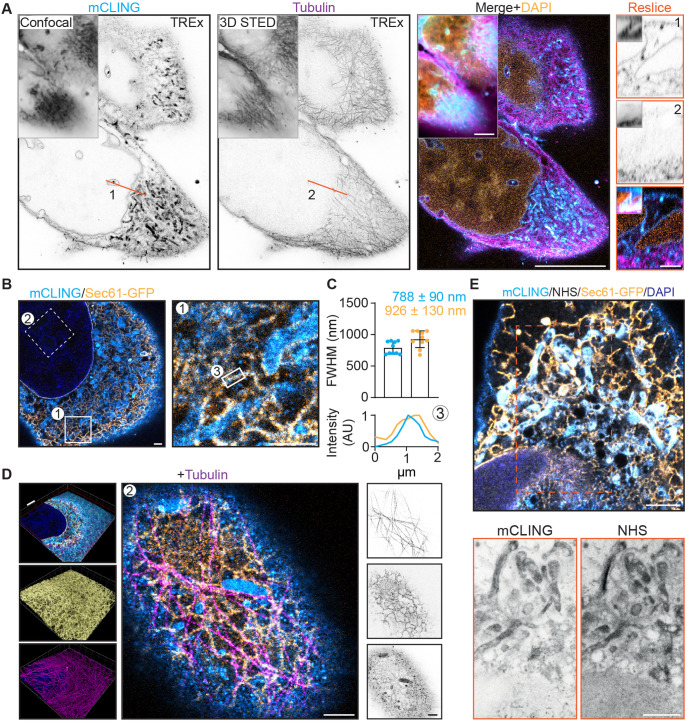
Figure 5.
Ten-fold Robust Expansion Microscopy (TREx) microscopy can combine antibody-based staining with NHS ester total protein stain to provide subcellular context.
( A ) Single and merged planes of expanded U2OS cell stained for mCLING, tubulin, and DAPI; gray outlined insets show similar confocal and 3D STED acquisitions pre-expansion, for mCLING and tubulin, r...
Figure 5u2014video 1.
3D render of Figure 5B .
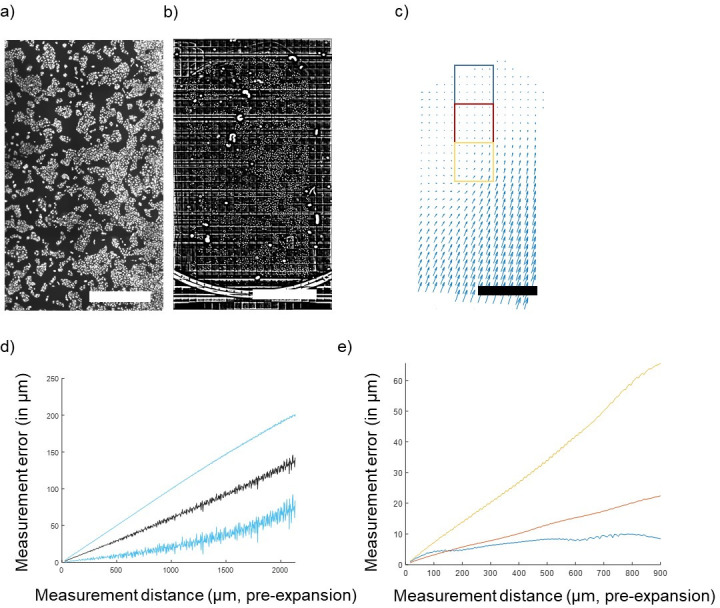
Author response image 1.
Quantification of gel deformation over long distances.
(A) Cultured U2OS cells just after gelation and (B) after full expansion, with an FFT-based short pass filter applied to reduce variation in illumination across imaging fields. (C) Map of distortions ...
Figure images are served from the NIH/NLM PubMed Central Open Access Subset or Europe PMC; copyright remains with the publishers and authors.
💬 Discussion
0 commentsNo comments yet. Be the first to start a discussion!
Leave a Comment