Abstract
Misfolded endoplasmic reticulum proteins are retro-translocated through the membrane into the cytosol, where they are poly-ubiquitinated, extracted from the membrane, and degraded by the proteasome-a pathway termed endoplasmic reticulum-associated protein degradation (ERAD). Proteins with misfolded domains in the endoplasmic reticulum lumen or membrane are discarded through the ERAD-L and ERAD-M pathways, respectively. In Saccharomyces cerevisiae, both pathways require the ubiquitin ligase Hrd1, a multi-spanning membrane protein with a cytosolic RING finger domain. Hrd1 is the crucial membrane component for retro-translocation, but it is unclear whether it forms a protein-conducting channel. Here we present a cryo-electron microscopy structure of S. cerevisiae Hrd1 in complex with its endoplasmic reticulum luminal binding partner, Hrd3. Hrd1 forms a dimer within the membrane with one or two Hrd3 molecules associated at its luminal side. Each Hrd1 molecule has eight transmembrane segments, five of which form an aqueous cavity extending from the cytosol almost to the endoplasmic reticulum lumen, while a segment of the neighbouring Hrd1 molecule forms a lateral seal. The aqueous cavity and lateral gate are reminiscent of features of protein-conducting conduits that facilitate polypeptide movement in the opposite direction-from the cytosol into or across membranes. Our results suggest that Hrd1 forms a retro-translocation channel for the movement of misfolded polypeptides through the endoplasmic reticulum membrane.
🔬 Techniques
🔭 Microscopes
🧬 Organisms
💻 Software
✨ Fluorophores
🧪 Sample Preparation
🏭 Microscope Brands
🧪 Reagent Suppliers
💻 Software Details
💻 Code & Software
💾 Data Repositories
🏛️ Research Organizations (ROR)
Affiliated research institutions:
📋 Methods
Yeast Strains and Plasmids The Hrd1/Hrd3 complex was expressed in the S. cerevisiae strain INVSc1 (Invitrogen) from 2μ plasmids of the pRS42X series under the Gal1 promoter 18 . Hrd1 was expressed as a C-terminally truncated version (amino acids 1-407) from a plasmid carrying an Ura marker. The Hrd1 fragment 1-407 corresponds to a stable tryptic fragment. Hrd3 was expressed as a luminal fragment (amino acids 1-767), in which the C-terminal TM segment was replaced with a tobacco etch virus (TEV) protease cleavage site followed by a streptavidin binding peptide (SBP). The plasmid carried a Trp marker.
Protein Purification
Yeast cells were transformed with plasmids encoding Hrd1(1-407) and Hrd3(1-767-TEV-SBP). A starter culture was inoculated and grown for 24 h at 30°C in synthetic dropout medium with amino acid supplements and 2% (w/v) glucose. The culture was diluted 1:40 into fresh medium and grown for additional 24 h. Expression was induced by adding 1/4 of the volume of 5x YEP broth containing 10% (w/v) galactose. The culture was incubated for 14–16 h at 25°C, and the cells were harvested by centrifugation for 10 min at 4000 x g. A 150g cell pellet was resuspended in 150 mL buffer A (50 mM HEPES pH 7.5, 500 mM NaCl, 5mM β-mercaptoethanol) supplemented with 1 mM phenylmethane sulfonyl fluoride (PMSF) and 1.5 μM pepstatin A. Glass beads were added to about 1/2 of the volume, and the cells were lysed in a BioSpec BeadBeater for 30 min with 30 s/60 s on/off cycles in a water/ice bath. After removal of the glass beads, the lysate was centrifuged twice in 250 ml tubes at 4000 x g for 10 min at 4°C. The supernatant was subjected to centrifugation in a Ti45 rotor at 42,000 x g for 45 min at 4°C. The membrane fraction was collected and flash-frozen in liquid nitrogen and stored at −80°C. The Hrd1/Hrd3 complex was purified as follows. The membrane fraction was resuspended in 1.5 ml of buffer B (25 mM HEPES pH 7.5, 375 mM NaCl, 5 mM β-mercaptoethanol, 2% (w/v) decylmaltoside (DM)) per 1 g of membrane pellet and incubated for 30 min at 4°C. Insoluble material was removed by centrifugation (Ti45, 45min, 42,000 rpm). Six ml of Streptavidin Agarose resin (Goldbio) were added per 100 ml of solubilized membranes and incubated for 3 h on a rolling incubator. Beads were then washed with 5 column volumes (CV) of buffer C (20 mM HEPES pH 7.5, 375 mM NaCl, 5 mM DM, 1 mM tris(2-carboxyethyl)phosphine hydrochloride (TCEP), 0.01 mg/ml yeast polar lipid extract), followed by 10 CV of buffer C supplemented with 0.5 mM ATP and 10 mM MgCl 2 and washed again with 35 CV of buffer C. The protein was then eluted with buffer C supplemented with 3 mM biotin. The protein was further purified by size-exclusion chromatography on a Superdex 200 10/300GL Increase column, equilibrated with buffer C without yeast polar lipid extract. Peak fractions were collected and mixed with yeast polar lipid extract (0.1 mg/ml) and Amphipol PMAL C8 (Anatrace) at a 1:3 ratio (w/w) with gentle agitation for 30 min. Detergent was removed by diluting the sample with detergent-free buffer (20 mM HEPES pH 7.5, 375 mM NaCl, 1 mM TCEP) below the CMC (1.8 mM) and subsequent concentration of the sample with an Amicon Ultra Centrifugal Filter (100 kDa cutoff). The protein sample was finally purified by size-exclusion chromatography on a Superdex 200 10/300GL Increase column. The peak fraction was concentrated to 1.4 mg/ml and used for cryo-EM analysis.
Show full methods section
Yeast Strains and Plasmids The Hrd1/Hrd3 complex was expressed in the S. cerevisiae strain INVSc1 (Invitrogen) from 2μ plasmids of the pRS42X series under the Gal1 promoter 18 . Hrd1 was expressed as a C-terminally truncated version (amino acids 1-407) from a plasmid carrying an Ura marker. The Hrd1 fragment 1-407 corresponds to a stable tryptic fragment. Hrd3 was expressed as a luminal fragment (amino acids 1-767), in which the C-terminal TM segment was replaced with a tobacco etch virus (TEV) protease cleavage site followed by a streptavidin binding peptide (SBP). The plasmid carried a Trp marker.
Protein Purification
Yeast cells were transformed with plasmids encoding Hrd1(1-407) and Hrd3(1-767-TEV-SBP). A starter culture was inoculated and grown for 24 h at 30°C in synthetic dropout medium with amino acid supplements and 2% (w/v) glucose. The culture was diluted 1:40 into fresh medium and grown for additional 24 h. Expression was induced by adding 1/4 of the volume of 5x YEP broth containing 10% (w/v) galactose. The culture was incubated for 14–16 h at 25°C, and the cells were harvested by centrifugation for 10 min at 4000 x g. A 150g cell pellet was resuspended in 150 mL buffer A (50 mM HEPES pH 7.5, 500 mM NaCl, 5mM β-mercaptoethanol) supplemented with 1 mM phenylmethane sulfonyl fluoride (PMSF) and 1.5 μM pepstatin A. Glass beads were added to about 1/2 of the volume, and the cells were lysed in a BioSpec BeadBeater for 30 min with 30 s/60 s on/off cycles in a water/ice bath. After removal of the glass beads, the lysate was centrifuged twice in 250 ml tubes at 4000 x g for 10 min at 4°C. The supernatant was subjected to centrifugation in a Ti45 rotor at 42,000 x g for 45 min at 4°C. The membrane fraction was collected and flash-frozen in liquid nitrogen and stored at −80°C. The Hrd1/Hrd3 complex was purified as follows. The membrane fraction was resuspended in 1.5 ml of buffer B (25 mM HEPES pH 7.5, 375 mM NaCl, 5 mM β-mercaptoethanol, 2% (w/v) decylmaltoside (DM)) per 1 g of membrane pellet and incubated for 30 min at 4°C. Insoluble material was removed by centrifugation (Ti45, 45min, 42,000 rpm). Six ml of Streptavidin Agarose resin (Goldbio) were added per 100 ml of solubilized membranes and incubated for 3 h on a rolling incubator. Beads were then washed with 5 column volumes (CV) of buffer C (20 mM HEPES pH 7.5, 375 mM NaCl, 5 mM DM, 1 mM tris(2-carboxyethyl)phosphine hydrochloride (TCEP), 0.01 mg/ml yeast polar lipid extract), followed by 10 CV of buffer C supplemented with 0.5 mM ATP and 10 mM MgCl 2 and washed again with 35 CV of buffer C. The protein was then eluted with buffer C supplemented with 3 mM biotin. The protein was further purified by size-exclusion chromatography on a Superdex 200 10/300GL Increase column, equilibrated with buffer C without yeast polar lipid extract. Peak fractions were collected and mixed with yeast polar lipid extract (0.1 mg/ml) and Amphipol PMAL C8 (Anatrace) at a 1:3 ratio (w/w) with gentle agitation for 30 min. Detergent was removed by diluting the sample with detergent-free buffer (20 mM HEPES pH 7.5, 375 mM NaCl, 1 mM TCEP) below the CMC (1.8 mM) and subsequent concentration of the sample with an Amicon Ultra Centrifugal Filter (100 kDa cutoff). The protein sample was finally purified by size-exclusion chromatography on a Superdex 200 10/300GL Increase column. The peak fraction was concentrated to 1.4 mg/ml and used for cryo-EM analysis.
EM data acquisition
For cryo-EM, protein samples and freezing conditions were screened on a Tecnai TF20 electron microscope (FEI) operated at 200 kV. Aliquots of 2.5 µl of purified Hrd1/3 complex in PMAL-C8 at a concentration of 0.8 to 1 mg/ml were applied to a glow-discharged Quantifoil holey carbon grid (1.2/1.3, 400 mesh). Grids were blotted for 3 s at ˜90% humidity at room temperature, and plunge-frozen in liquid ethane using a Cryoplunge 3 System (Gatan). Cryo-EM data were recorded on a Titan Krios electron microscope (FEI) at the HHMI Janelia Research Campus, operated at 300 kV and equipped with a K2 Summit direct electron detector (Gatan). A Gatan Imaging filter with a slit width of 15 eV was used to remove inelastically scattered electrons. All cryo-EM movies were recorded in super-resolution counting mode using SerialEM 30 . The nominal magnification of 81,000x corresponds to a calibrated pixel size of 1.35 Å on the specimen and 0.675 Å for super-resolution images. The dose rate was set to 5.47 electrons per Å 2 and sec. The total exposure time of each movie was 15 s, leading to a total accumulated dose of 82 electrons per Å 2 , fractionated into 50 frames (300 ms per frame). All movies were recorded in a defocus range between 0.7 and 3.2 µm.
Image processing
Dose-fractionated super-resolution movies were subjected to motion correction using the program MotionCor2 31 , and the resulting corrected movies and summed images were binned over 2 x 2 pixels, yielding a pixel size of 1.35 Å. All 50 frames in each movie were summed with or without a dose-weighting scheme 32 . The summed images without dose-weighting were used for defocus calculation with the program CTFFIND3 33 , while the dose-weighted summed images were used in all other image processing steps. Particle picking and screening, as well as the initial 3D model building were carried out using SamViewer and SAMUEL scripts as previously described 34 . 3D classification and refinement were performed in RELION-1.4 35 and GeRelion 36 . 3D refinements were completed with the particles summed from all 50 movie frames, and then continued with the particles summed from the movie frames 3-18, which improved the map quality and increased the resolution by ˜0.2 Å. The accumulated dose of the first 18 frames is ˜30 e - /Å 2 . All reported resolutions are based on gold-standard refinement procedures and the FSC=0.143 criterion. Local resolution was estimated using Resmap 37 . The amplitude information of the final maps was corrected by applying a negative B-factor using the program bfactor.exe 38 . To speed up calculations, the cryo-EM data set (871,530 particles) was divided into two halves for the initial round of 3D classification. No symmetry was applied unless otherwise indicated. 3D reconstructions from these classes display a Hrd1 dimer associated with one or two Hrd3 molecules. We employed different strategies to achieve the best cryo-EM reconstructions for the components of the Hrd1/3 complex (see also Extended Data Fig. 2 ): 1) Hrd1/Hrd3 complex with two Hrd3 molecules. The 3D classes containing two Hrd3 molecules (class 6 in the first half and class 7 in the second half of the data set; 139,754 particles in total) were combined and refined, generating a reconstruction at 4.7 Å resolution. The major issue in reaching high resolution was the heterogeneity of conformations of the Hrd1/Hrd3 complex. Although in all particles Hrd3 binds to Hrd1 at the same site, alignment of Hrd1/Hrd3 maps from different classes shows that there are small differences in the orientation of Hrd3 relative to Hrd1. For example, classes #3 and #4 of the first half dataset ( Extended Data Fig. 2 ) have a similar overall quality as class #6, but the relative orientation of Hrd3 with respect to Hrd1 is different. We therefore excluded classes #3 and #4 from refinement. Tests showed that including them actually decreased the quality of the map. 2) Hrd1/Hrd3 complex with one Hrd3 molecule. The 3D classes containing only one Hrd3 (class 2 in the first half and class 5 in the second half; 167,061 particles in total) were combined and refined, generating a reconstruction at 4.7 Å resolution. 3) Hrd3 alone. All 3D classes with their reconstructions showing clear densities for Hrd1 and at least one Hrd3 (classes 2, 3, 4, 6 in the first half and classes 5, 7 in the second half; 452,695 particles in total) were combined and refined, followed by Hrd3-focused 3D classification with signal subtraction 19 . The resulting 3D classes displaying clear secondary structure features in Hrd3 were combined and refined with a soft mask on the Hrd3 molecule, leading to a density map at 3.9 Å resolution. Class #1 and #2 in the second half dataset were not included because the Hrd1 dimer density in these two classes was not as good as in the other classes, which would compromise signal subtraction and focused classification on Hrd3. 4) Hrd1 dimer. The same set of classes as for Hrd3 alone (classes 2, 3, 4, 6 in the first half and classes 5, 7 in the second half; 452,695 particles in total) were combined, and then subjected to 3D classification without a mask. C2 symmetry was applied in this round of classification and all following steps. Three classes showing clear densities of transmembrane helices were combined and classified based on the Hrd1 dimer, which was done using dynamic signal subtraction (DSS, detailed below). The best 3D class (93,609 particles) was further refined focusing on the Hrd1 dimer with DSS, generating a final reconstruction at 4.1 Å resolution. Dynamic signal subtraction (DSS) In the previously described method of masked classification with subtraction of residual signal 19 , the unwanted signal is subtracted from each particle image based on a predetermined orientation. In this procedure, the orientation angles for signal subtraction are determined using the entire reconstruction as the reference model, and cannot be iteratively optimized based on the region of interest. In order to reduce the bias introduced by using a single fixed orientation for signal subtraction and to achieve better image alignment based on the region of interest, we have extended the signal subtraction algorithm to image alignment in the expectation step of GeRelion. Specifically, during each iteration, the reference model of the Hrd1/Hrd3 complex was subjected to two soft masks, one for Hrd1 and the other for Hrd3 and the amphipol region, generating a Hrd1 map and a non-Hrd1 map, respectively. For image alignment, these two maps generate 2D projections according to all searched orientations. For each search orientation, we subtracted from each original particle image the corresponding 2D projection of the non-Hrd1 map, and then compared it with the corresponding 2D projection of the Hrd1 map. Thus, particle images are dynamically subtracted for more accurate image alignment based on the Hrd1 portion. After alignment, 3D reconstructions were calculated using the original particle images without subtraction or masking. For 3D classification focusing on the Hrd1 dimer, we obtained the best results by applying the DSS procedure during the local angle search (angular sampling interval: 1.8; local angular search range: 6). Only with DSS were we able to obtain a particle class that resulted in a reconstruction showing clear densities for the TM7/TM8 and TM5/TM6 loops of Hrd1. This class was first refined using the auto-refine procedure without mask or signal subtraction. When the auto-refine procedure reached the local angle search, the DSS procedure was applied to focus the refinement on the Hrd1 dimer region. 3D refinement with DSS improved the map quality, but did not change the nominal resolution. Model building An initial model for Hrd1 was obtained by placing a poly-alanine chain into the density for the TM helices of Hrd1. TMs 1 and 2 could be identified on the basis of the loop between them being involved in the binding to Hrd3 23 . The Hrd1 model was further extended manually, using information from TM predictions (Polyphobius, MEMSAT-SVM) and secondary structure predictions (Psipred server). Modeling was facilitated by distance constraints of evolutionarily coupled amino acid pairs (GREMLIN) ( Extended Data Fig. 5 ) 39 ; these pairs are predicted to have co-evolved based on the analysis of a large dataset of aligned Hrd1 sequences from different species. For the co-evolution analysis by GREMLIN, the alignments were generated using HHblits (from HHsuite version 2.0.15; -n 8 -e 1E-20 -maxfilt ∞ -neffmax 20 -nodiff -realign_max ∞) 40 and run against the clustered UniProt database from 2016 and the fungal database from JGI 41 to generate a multiple sequence alignment. The alignment was then filtered for redundancy and coverage (HHfilter -cov 75 -id 90). In addition, TM helices were oriented in such a way that the exposure of polar residues to the hydrophobic environment of the lipid bilayer was minimized. The identity and registry of the TM helices of Hrd1 were verified on the basis of large amino acid side chains and density for the loops between TMs ( Extended Data Fig. 4a, b ). The loop between TMs 6 and 7 (residues 222-263) is predicted to be disordered (PSIPRED3v.3) and is invisible in our maps. No density that would fit the RING finger domain of Hrd1 was visible. Overall, a Hrd1 model consisting of residues 5-222 and residues 263-322 was built into the density. The new topology of Hrd1 is consistent with sequence alignments performed with Hrd1 molecules from many different species, and with the prediction of TMs on the basis of hydrophobicity using a variety of prediction programs (TOPCONS 42 , MEMSAT-SVM). For Hrd1 of some species, TMs 3, 7, and 8 are not predicted, as they contain up to 8 polar residues, but it is likely that they all have the same topology. The final model of Hrd1 is a result of refinement into the density (weight on density correlation score term, elec_dens_fast =10) using Rosetta with two-fold symmetry imposed 43 . For Hrd3, we initially built 5-7 helical segments (based on PSIPRED secondary structure prediction) using the AbinitioRelax model building application of Rosetta guided by GREMLIN constraints (weight on distance constraint score term, atom_pair_constraint =3 with a sigmoid function type). These helical segments were then docked into the density map and energy minimized, followed by visual analysis. An initial 7-helix C-terminal segment (residues 536-663) matched a model generated with the PHYRE2 server, providing some confidence of the placement. After extending the initial segment by two helices based on a continuous path in the density, a second 7-helix segment (residues 80-224) was docked into a position that satisfied two predicted long-range GREMLIN contacts (F207&V502 and A218&F509). The overall topology was completed by docking two final overlapping segments into trimmed density: 5 helices from 430-513 and 7 helices from 319-459. The docked segments were then combined together and refined using RosettaCM in an iterative fashion (score term weights: elec_dens_fast =2, atom_pair_constraint =3) 21 . After refinement in Rosetta, loop regions in Hrd3 were manually adjusted to better fit the density. The final Hrd3 map at 3.9 Å for Hrd3 allowed the building of a continuous model of Hrd3 with the exception of residues 269-318. Extra density close to N101, N123, N142 and N611 is consistent with predicted N-glycosylation at these sites. A recent crystal structure of a mammalian Hrd3 (Sel1) fragment (PDB code: 5B26) could not be fully docked into the density map, probably because its structure is distorted by artificial dimerization due to crystal packing 23 . However, a single chain of this homodimeric Hrd3 structure can be docked into the middle domain of Hrd3 (rmsd of 3.6Å over 144 residues). To evaluate the fit of the evolutionary coupling data to our models we computed Rc scores (# of contacts made)/(# of expected contact), as described in ref. 44 . After additional refinement with density and GREMLIN constraints, the Rc values were 0.710 and 0.757 for Hrd1 and Hrd3, respectively, which is consistent with the values (> 0.7) for the given number of sequences and length. Generation of Hrd1/gp78/TCR8 sequence alignments A seed alignment of the transmembrane domain of 20 fungi Hrd1 sequences was used as input for the hmmsearch tool on the Hmmer web server 45 . The search was restricted to the rp15 set of representative genomes. This search yielded not only Hrd1 homologs from all branches of the eukaryotic kingdom but also homologs of gp78 (also called AMFR), TRC8 (also called RNF139), and the closely related RNF145. Additional seed alignments of 10 TRC8 sequences from metazoans and 10 gp78 homologs from metazoan and plants were generated and used as inputs for hmmsearch. All hits were combined and aligned with MAFFT using L-INS-I settings 46 . The alignments were visually inspected, and sequences with long gaps or insertions were manually removed. Selected sequences of this alignment representing phylogenetically diverse species are shown in Extended Data Fig. 6 .
Code availability
GeRelion is an open source and free software, distributed under the GPLv2 licence. It is publicly available for download through https://github.com/gpu-pdl-nudt/GeRelion .
Data availability
The coordinates of the atomic models of the Hrd1 dimer and Hrd3 monomer were deposited in the Protein Data Bank with accession codes 5V6P and 5V7V, respectively. The corresponding cryo-EM maps were deposited in the Electron Microscopy Data Bank with accession codes EMD-8637 and EMD-8642, respectively. The cryo-EM maps of the Hrd1/Hrd3 complexes containing one or two Hrd3 molecules were deposited with accession codes EMD-8639 and EMD-8638, respectively. The raw cryo-EM data were deposited to EMPIAR (accession code EMPIAR-10099). An interactive session of models with co-evolution data can be found at http://gremlin.bakerlab.org/hrd .
Supplementary Material Supplementary Figure 1
📊 Figures
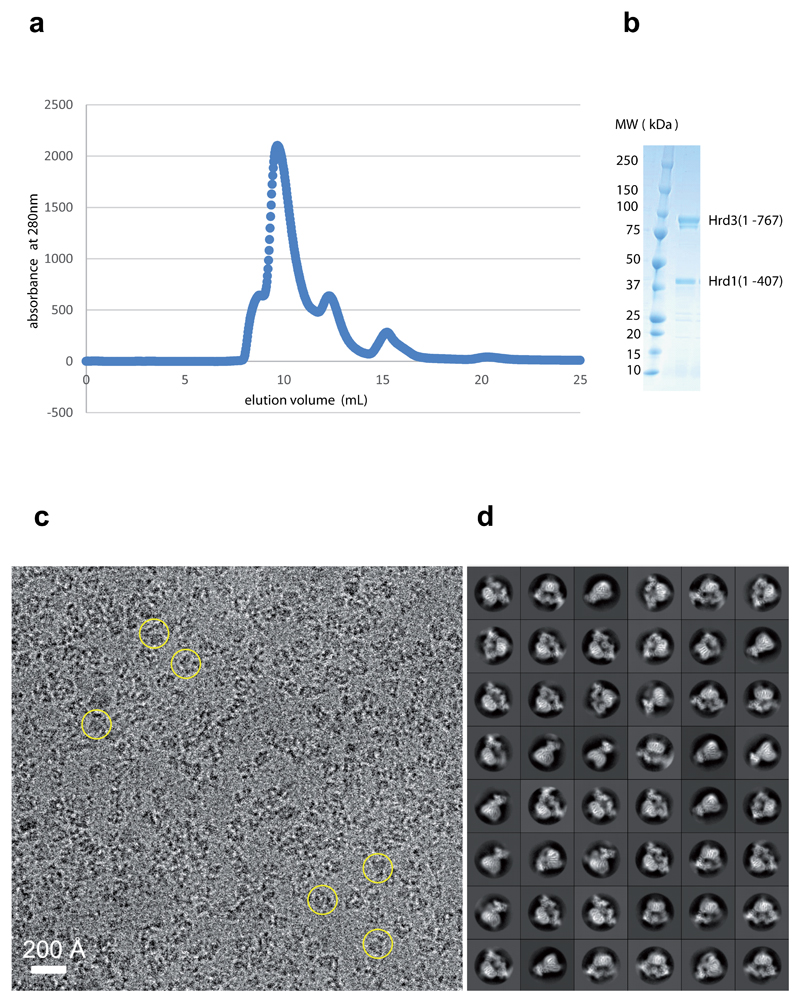
Extended Data Figure 1
Purification and cryo-EM of the Hrd1/Hrd3 complex.
a , In the last purification step, the Hrd1/Hrd3 complex was subjected to gel filtration on a Superdex 200 10/300GL Increase column. Shown is the UV elution profile. b , SDS-PAGE gel of the peak fract...
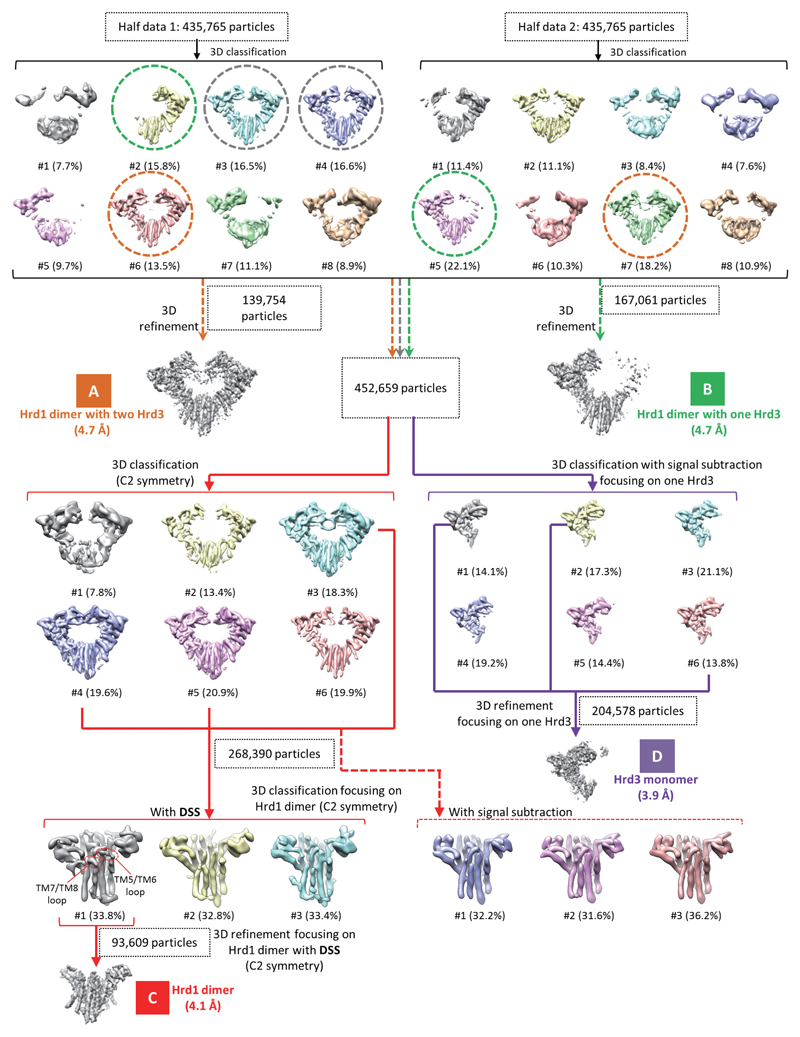
Extended Data Figure 2
3D classification and refinement procedure for the Hrd1/Hrd3 complex.
Views parallel to the membrane of 3D reconstructions are shown, and percentages of the particles in each class indicated. Three different classes selected from the first round of 3D classification are...
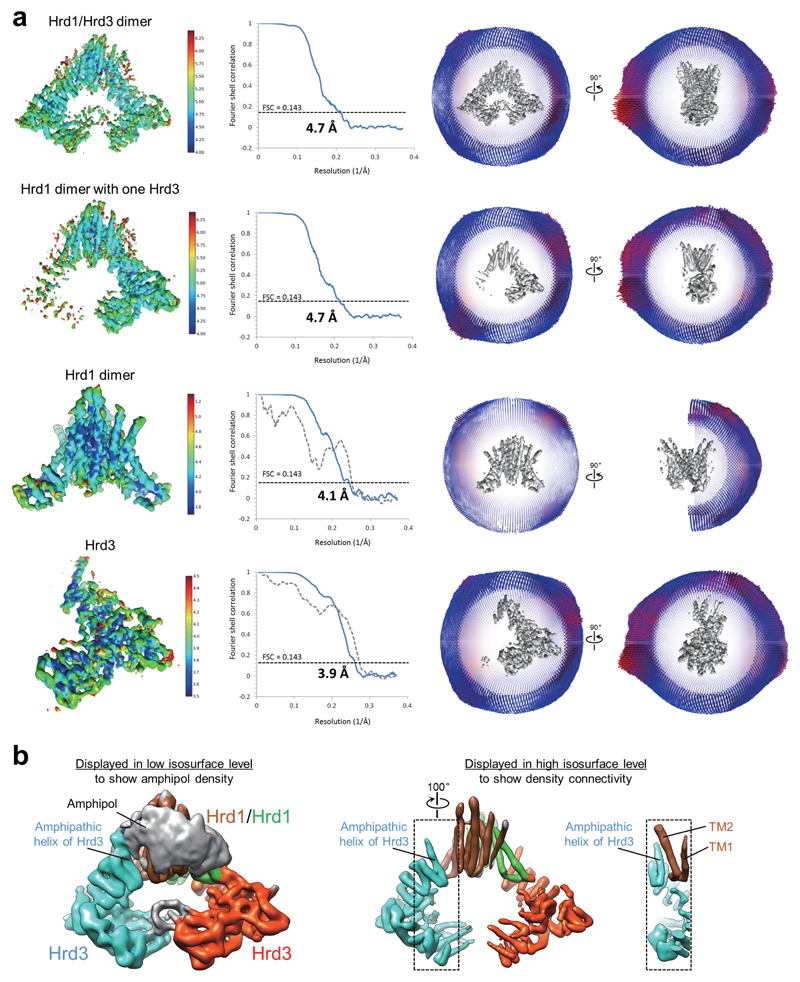
Extended Data Figure 3
Single particle cryo-EM analysis of Hrd1/Hrd3 complexes.
a , Density maps were generated for the Hrd1/Hrd3 dimer, the Hrd1 dimer with one associated Hrd3 molecule, the Hrd1 dimer, and Hrd3 (see Extended Data Fig. 2 ). The left panels show the maps in a side...
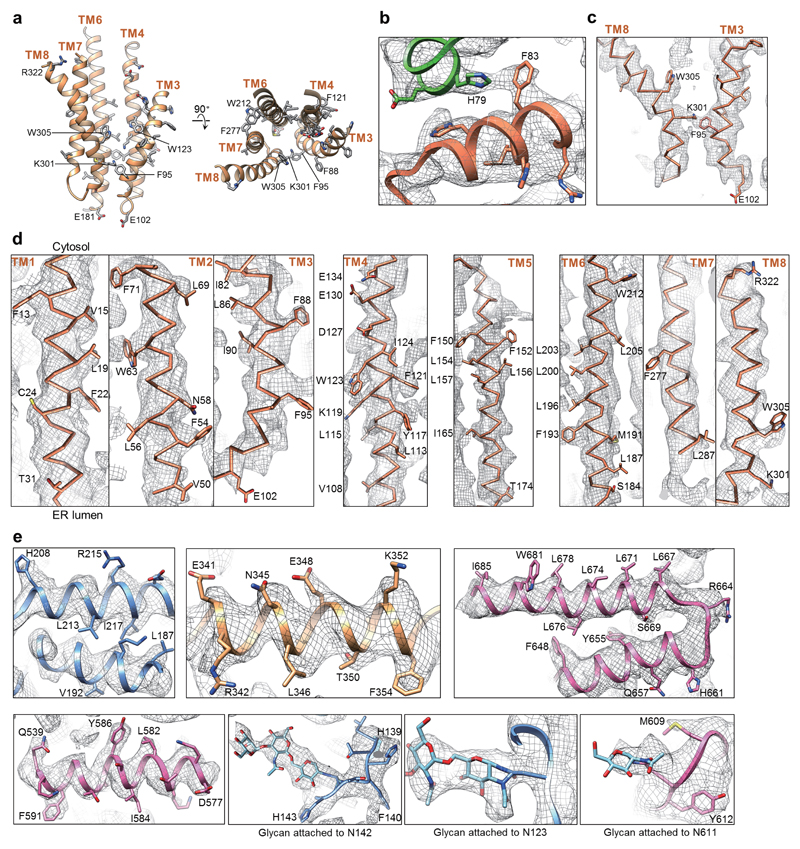
Extended Data Figure 4
Examples of the fit of the model and density maps.
a , Amino acids for which side chain density was observed are indicated in side and top views of the Hrd1 model. b , Central interface between the Hrd1 molecules. H79 and F83 from the two Hrd1 molecul...
Extended Data Figure 5
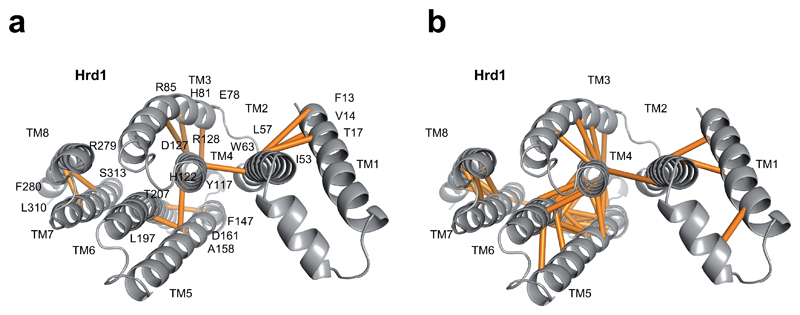
Distance constraints between amino acid residues in Hrd1.
a , Evolutionary couplings between amino acids, determined with the program Gremlin 39 . Shown is a view from the ER lumen with couplings shown as lines between residues. b , Distance constraints calc...
Extended Data Figure 6
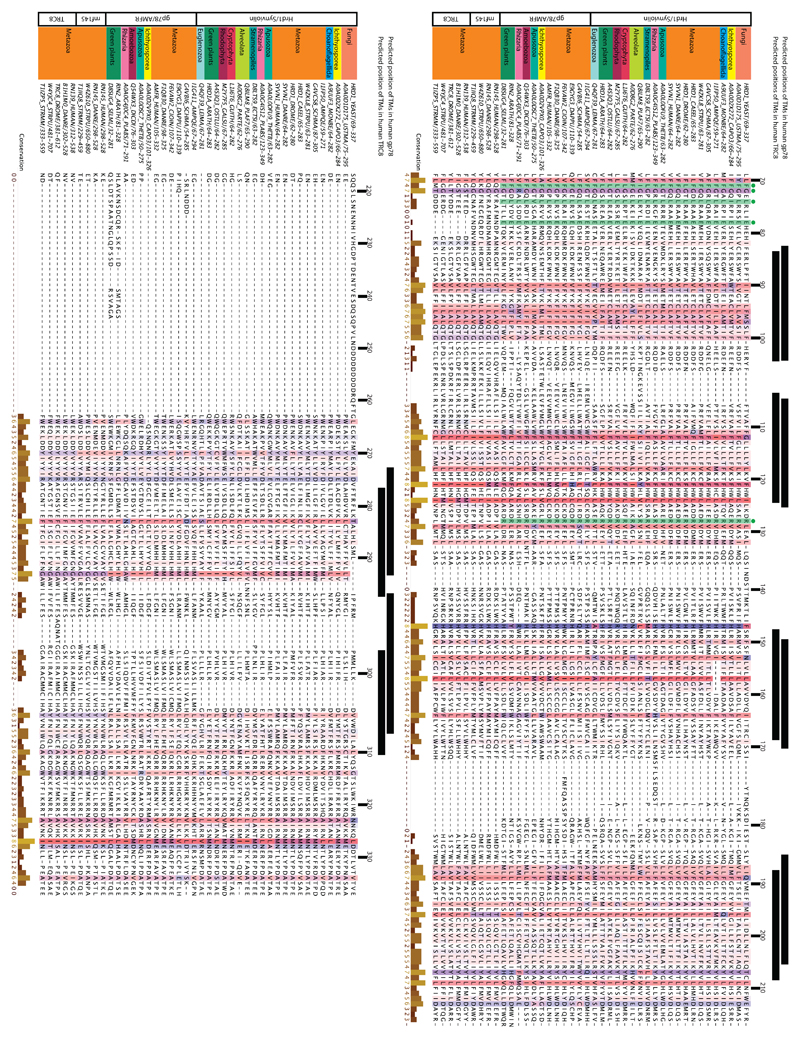
Sequence similarities between Hrd1 and other multi-spanning ubiquitin ligases.
Multiple sequence alignment showing amino acid conservation in TMs 3-8 of Hrd1, TMs 3-8 of gp78 (also called AMFR), and TMs 9-14 of TRC8 (also called RNF139) and RNF145. On the left, Uniprot codes for...
Extended Data Figure 7
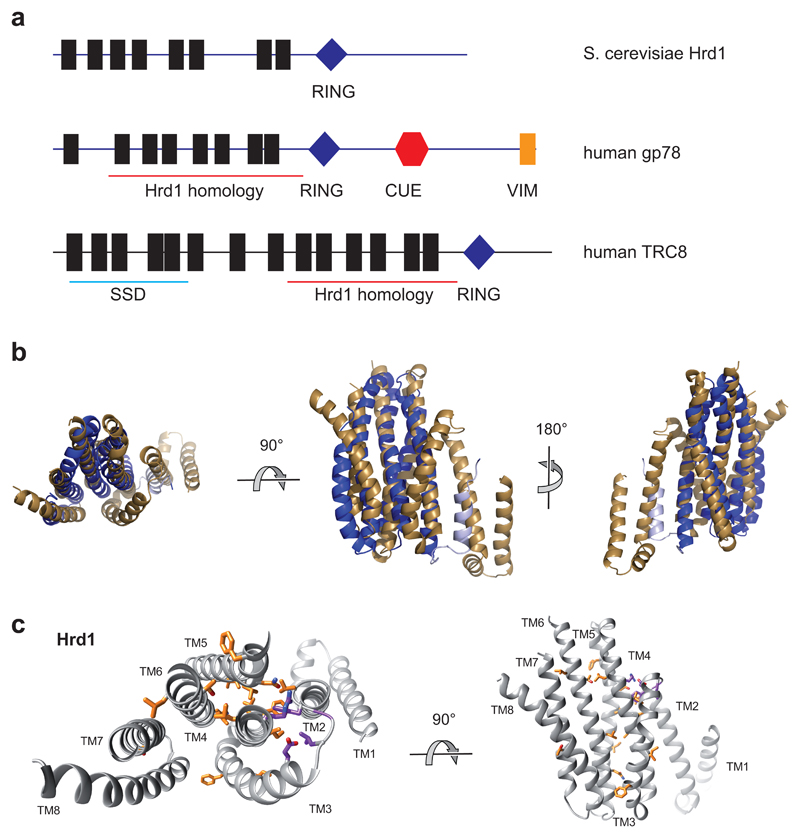
Structural homology between the ubiquitin ligases Hrd1 and TRC8.
a, Domain organization of human gp78 and TRC8. Black bars indicate the position of TM segments as predicted by TOPCONS. The positions of the VIM (VCP interacting motif), CUE, and RING finger domains w...
Extended Data Figure 8
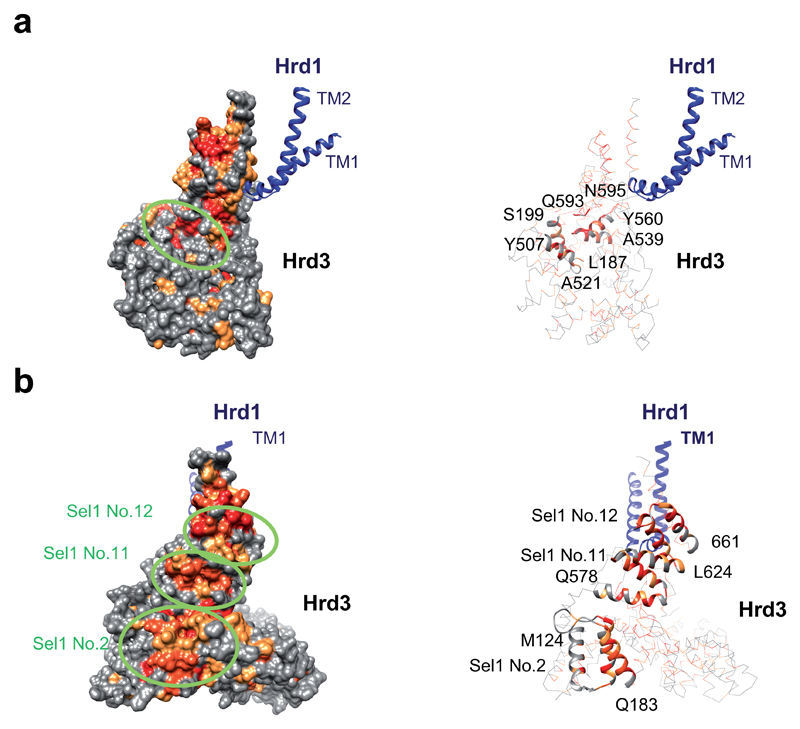
Potential Hrd3 binding surfaces for substrate and partners.
a , Groove at the inner surface of Hrd3 (encircled), located at the junction of the N-terminal (residues 187-199), middle (residues 507-521), and C-terminal (residues 539-560, 593-595) domains. The le...
Extended Data Figure 9
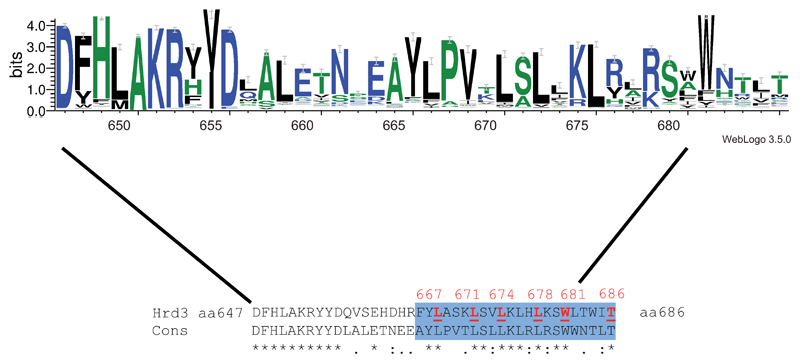
Sequence conservation of the amphipathic helix of Hrd3.
Consensus sequence of the amphipathic helix of Hrd3, generated with Weblogo 3.0. The size of the letters correlates with their conservation. Black, blue, and green letters indicate hydrophobic, hydrop...
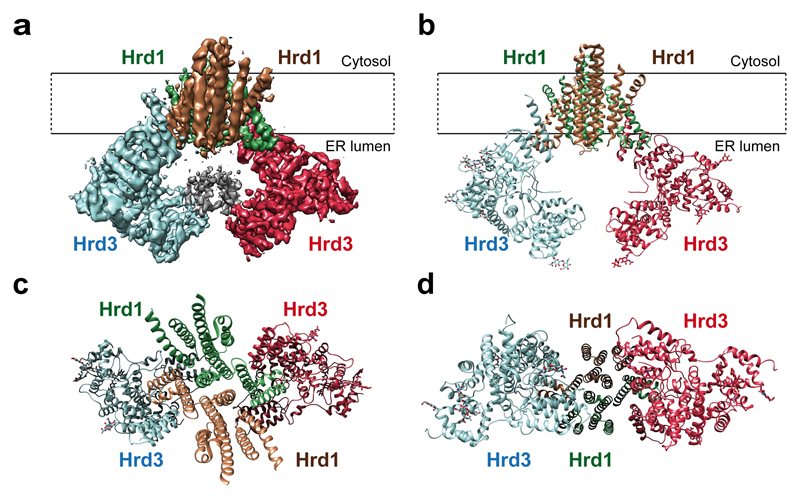
Figure 1
Architecture of the Hrd1/Hrd3 complex.
a, Side view of the density map of the dimeric Hrd1/Hrd3 complex at 4.7u00c5 resolution. The Hrd1 molecules are shown in brown and green, and the Hrd3 molecules in blue and red. Weak density between t...
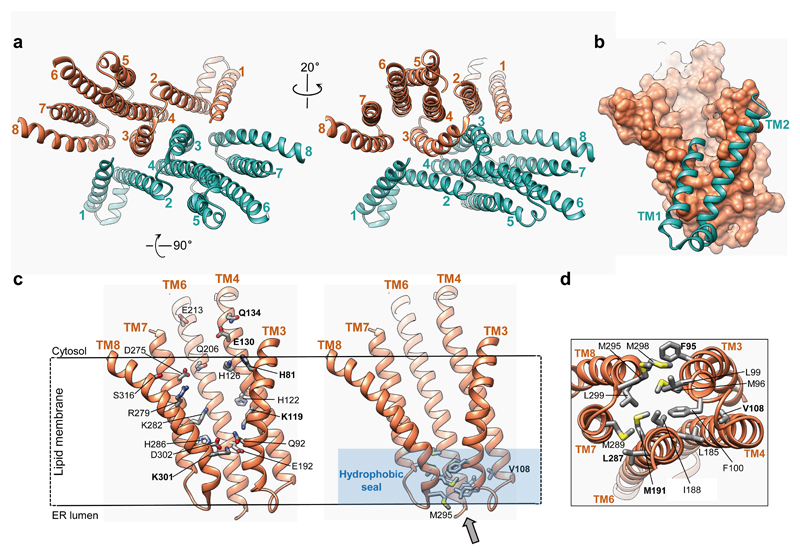
Figure 2
Structure of Hrd1.
a , Ribbon presentation of the Hrd1 dimer (brown, green) in two different views from the cytosol. Hrd3 was omitted for clarity. The TMs are numbered. b , Side view of a space-filling model of TMs 3-8 ...
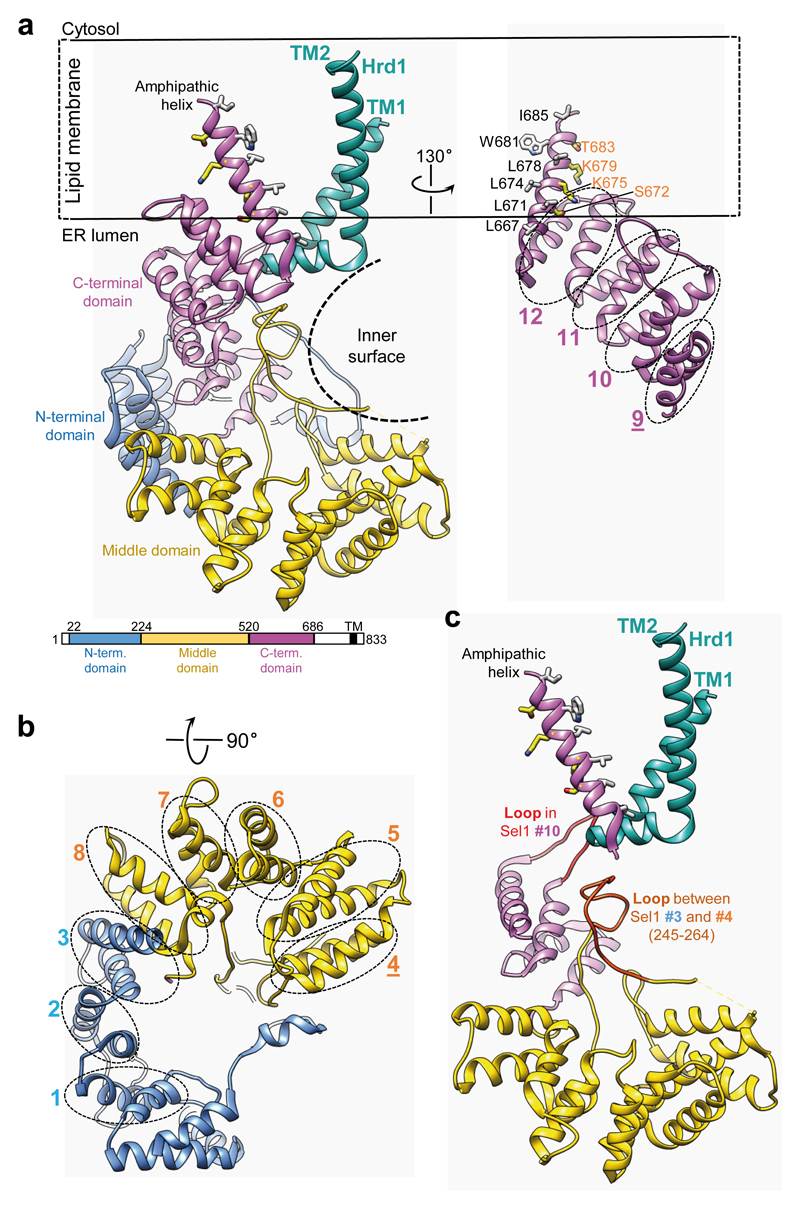
Figure 3
Structure of Hrd3.
a , Left: ribbon presentation of the Hrd3 model. Domain colors correspond to those in the sequence diagram. TM1-TM2 of Hrd1 are in green. The Hrd3 structure lacks the signal sequence and the segment f...
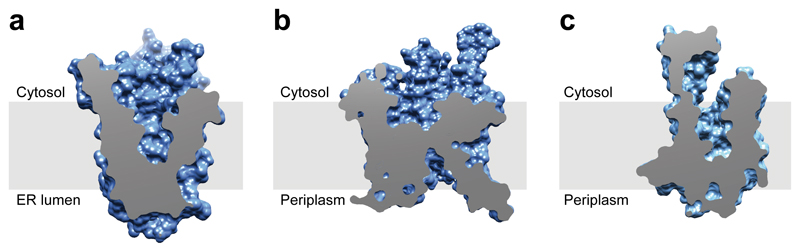
Figure 4
Hydrophilic funnels in protein-conducting channels.
a , Cut-away side view of a space-filling model of Hrd1. The membrane boundaries were determined with the OPM server ( http://opm.phar.umich.edu/server.php ). b , As in a , but for the SecY channel (P...
Figure images are served from the NIH/NLM PubMed Central Open Access Subset or Europe PMC; copyright remains with the publishers and authors.
💬 Discussion
0 commentsNo comments yet. Be the first to start a discussion!
Leave a Comment