Abstract
AbstractFrom a single domain of cyanobacteriochrome (CBCR) we developed a near-infrared (NIR) fluorescent protein (FP), termed miRFP670nano, with excitation at 645 nm and emission at 670 nm. This is the first CBCR-derived NIR FP evolved to efficiently bind endogenous biliverdin chromophore and brightly fluoresce in mammalian cells. miRFP670nano is a monomer with molecular weight of 17 kDa that is 2-fold smaller than bacterial phytochrome (BphP)-based NIR FPs and 1.6-fold smaller than GFP-like FPs. Crystal structure of the CBCR-based NIR FP with biliverdin reveals a molecular basis of its spectral and biochemical properties. Unlike BphP-derived NIR FPs, miRFP670nano is highly stable to denaturation and degradation and can be used as an internal protein tag. miRFP670nano is an effective FRET donor for red-shifted NIR FPs, enabling engineering NIR FRET biosensors spectrally compatible with GFP-like FPs and blue–green optogenetic tools. miRFP670nano unlocks a new source of diverse CBCR templates for NIR FPs.
🔬 Techniques
🧬 Organisms
💻 Software
✨ Fluorophores
🧪 Sample Preparation
🔬 Cell Lines
🏭 Microscope Brands
🧪 Reagent Suppliers
📷 Detectors
🔎 Objectives
🎨 Filters
💻 Software Details
💾 Data Repositories
🏛️ Research Organizations (ROR)
Affiliated research institutions:
📋 Methods
Mutagenesis and directed molecular evolution The CBCR GAF genes were synthesized by GenScript Company. The DNA sequences were optimized with OptimumGene algorithm (GenSript), taking into account the codon usage bias (human cells), GC (guanine-cytosine) content, CpG dinucleotides content, messenger RNA secondary structure, and other parameters. For expression in bacteria, DNA sequences encoding the GAF domains were cloned into pBAD/His-B vector (Life Technologies/Invitrogen) by Kpn I/ Eco RI sites. BV synthesis in bacteria was facilitated by co-transformation with a pWA23h plasmid encoding heme oxygenase from Bradyrhizobium ORS278 (hmuO) under the rhamnose promoter 17 , 40 .
LMG194 host cells
(Invitrogen) were used for protein expression. All oligonucleotide primers for polymerase chain reaction (PCR) were purchased from Biomers (Supplementary Table 1 ). For simultaneous site-specific mutagenesis at several positions, an overlap-extension approach was applied. Random mutagenesis was performed with GeneMorph II random mutagenesis kit (Agilent Technologies) under conditions resulting in a mutation frequency of up to 16 mutations per 1000 base pairs. After mutagenesis, a mixture of mutated genes was electroporated into LMG194 host cells containing the pWA23h plasmid. Typical mutant libraries consisted of more than 10 8 independent clones. Bacterial cells were incubated overnight at 37 °C in LB medium supplemented with ampicillin and kanamycin. To start protein expression 0.02% rhamnose and 0.004% arabinose were added. Cells were grown for 5 h at 37 °C, and then at 22 °C for 20 h. Before sorting, bacterial cells were washed with phosphate-buffered saline (PBS) and diluted with PBS to an optical density of 0.03 at 600 nm. Flow cytometry screening was performed on BD Influx cell sorter (BD Biosciences). Six hundred and forty nanometer laser for excitation and a 670/30 nm emission filter were used for selection of positive clones. Collected cells were rescued in SOC medium for 1 h at 37 °C, and then plated on LB/ampicillin/kanamycin Petri dishes supplemented with 0.004% arabinose and 0.02% rhamnose. Leica M205 FA fluorescence stereomicroscope equipped with a filter set ET CY5.5 (650/45 nm excitation and 710/50 nm emission filters) and a CCD camera (Tucsen) was used for screening of brightest clones. About 30 mutants selected in bacteria were then tested in HeLa cells, transfected with plasmids obtained after cloning of FP genes into pcDNA3.1(+) plasmid (Invitrogen/Thermo Fisher Scientific). A mixture of several selected mutants was then used as a template for the next round of mutagenesis.
Show full methods section
Mutagenesis and directed molecular evolution The CBCR GAF genes were synthesized by GenScript Company. The DNA sequences were optimized with OptimumGene algorithm (GenSript), taking into account the codon usage bias (human cells), GC (guanine-cytosine) content, CpG dinucleotides content, messenger RNA secondary structure, and other parameters. For expression in bacteria, DNA sequences encoding the GAF domains were cloned into pBAD/His-B vector (Life Technologies/Invitrogen) by Kpn I/ Eco RI sites. BV synthesis in bacteria was facilitated by co-transformation with a pWA23h plasmid encoding heme oxygenase from Bradyrhizobium ORS278 (hmuO) under the rhamnose promoter 17 , 40 .
LMG194 host cells
(Invitrogen) were used for protein expression. All oligonucleotide primers for polymerase chain reaction (PCR) were purchased from Biomers (Supplementary Table 1 ). For simultaneous site-specific mutagenesis at several positions, an overlap-extension approach was applied. Random mutagenesis was performed with GeneMorph II random mutagenesis kit (Agilent Technologies) under conditions resulting in a mutation frequency of up to 16 mutations per 1000 base pairs. After mutagenesis, a mixture of mutated genes was electroporated into LMG194 host cells containing the pWA23h plasmid. Typical mutant libraries consisted of more than 10 8 independent clones. Bacterial cells were incubated overnight at 37 °C in LB medium supplemented with ampicillin and kanamycin. To start protein expression 0.02% rhamnose and 0.004% arabinose were added. Cells were grown for 5 h at 37 °C, and then at 22 °C for 20 h. Before sorting, bacterial cells were washed with phosphate-buffered saline (PBS) and diluted with PBS to an optical density of 0.03 at 600 nm. Flow cytometry screening was performed on BD Influx cell sorter (BD Biosciences). Six hundred and forty nanometer laser for excitation and a 670/30 nm emission filter were used for selection of positive clones. Collected cells were rescued in SOC medium for 1 h at 37 °C, and then plated on LB/ampicillin/kanamycin Petri dishes supplemented with 0.004% arabinose and 0.02% rhamnose. Leica M205 FA fluorescence stereomicroscope equipped with a filter set ET CY5.5 (650/45 nm excitation and 710/50 nm emission filters) and a CCD camera (Tucsen) was used for screening of brightest clones. About 30 mutants selected in bacteria were then tested in HeLa cells, transfected with plasmids obtained after cloning of FP genes into pcDNA3.1(+) plasmid (Invitrogen/Thermo Fisher Scientific). A mixture of several selected mutants was then used as a template for the next round of mutagenesis.
Protein expression and characterization
LMG194 bacterial cells, containing pWA23h plasmid encoding HO and pBAD/His-B plasmid encoding miRFP670nano with polyhistidine tag on the N termini were grown in LB medium supplemented with ampicillin and kanamycin. To induce HO expression 0.02% rhamnose was added. After incubation for 3 h at 37 °C, the expression of miRFP670nano was induced by 0.002% arabinose. Cells were cultured for 3 h at 37 °C and then at 22 °C for 20 h. For protein purification Ni-NTA agarose (Qiagen) was used. Protein was eluted with PBS containing 100 mM EDTA. For samples desalting PD-10 columns (GE Healthcare) were used. Size-exclusion liquid chromatography of purified miRFP670nano was performed using HiLoad 16/600 Superdex 200 column (GE Healthcare) at a flow rate of 1 ml min −1 . The column was equilibrated with 10 mM HEPES buffer, pH 7.4, containing 150 mM NaCl, 10% glycerol, 50 μM EDTA, 1 mM dithiothreitol, 0.2 mM phenylmethylsulfonyl fluoride, 0.01% EP-40, and 0.2 mM benzodiazepin. The column was calibrated with Bio-Rad gel filtration standards. The fluorescence spectra were recorded with Cary Eclipse Fluorescence Spectrophotometer (Agilent Technologies), absorbance measurements were performed with Hitachi U-2000 spectrophotometer. The extinction coefficient of miRFP670nano was determined as a ratio between the absorbance value of the peak at Q-band and the value of the peak at Soret band, given a Soret band extinction coefficient of 39,900 M −1 cm −1 16 . The fluorescence quantum yield of miRFP670nano was determined using a Nile blue dye as a standard. pH stability was studied using a series of Hydrion buffers (Micro Essential Laboratory). Maturation rate of FPs was compared in LMG194 bacterial cells expressing miRFP670nano or miRFP670, respectively. Cells were cultured in LB medium supplemented with ampicillin, kanamycin, and 0.2% rhamnose for 2 h at 37 °C. Then, protein expression was induced by 0.002% arabinose, and cells were incubated for 1 h at 37 °C. Next, cells were washed and resuspended in LB medium supplemented with ampicillin, kanamycin, and 0.2% rhamnose, but without arabinose. Cells were cultured at 37 °C for 8 h. Fluorescence intensity of the cell suspension was measured every 1 h. To normalize number of cells, aliquots of the cell suspension were diluted to the same optical density. Protein crystallization and structure determination For crystallization the protein was dialyzed against 20 mM Tris-HCl, 200 mM NaCl at pH 8.0 buffer and concentrated to 28.4 mg ml −1 . Crystallization conditions were found with Mosquito crystallization robot (TTP LabTech) using Hampton Research crystallization and additive screens. Crystals suitable for X-ray data collection were obtained by hanging drop method from 0.1 M sodium acetate at pH 4.0, 10 mM EDTA, 10% v/v isopropanol, and 22% w/v polyethylene glycol 6000. In large-scale crystallization experiment, 2 μl of the protein solution was mixed with 2 μl of the reservoir solution and incubated over 500 ml of the same reservoir solution at 20 °C for 2 weeks. X-ray data were collected on SER-CAT 22-ID beamline (Advanced Photon Source, Argonne National Laboratory, Argonne, IL, USA) using standard equipment of the station. To minimize radiation damage the crystals were flash frozen in a 100 K nitrogen stream and a helical data collection technique was used for all X-ray data acquisitions. Diffraction images were processed with the HKL2000 41 . The statistics are given in Supplementary Table 2 . The structure of miRFP670nano was solved by the molecular replacement method with MOLREP 42 using the structure of AnPixJ(PDB ID: 3W2Z 24 ) in its red-absorbing state as a search model. To increase the contrast of rotation function the search model was truncated to the residues 36–183. To remove model bias, the chains were rebuilt with the PHENIX.AUTOBUILD crystallographic molecular model building suite 43 , 44 . Real space model correction was performed with COOT 45 , structure refinement was done with REFMAC 46 , and structure validation was carried out with COOT and PROCHECK 47 . The refinement statistics is given in Supplementary Table 3 .
Design of mammalian plasmids
To construct mammalian expression plasmids, the respective genes of miRFP670nano or mutants were inserted in a pcDNA3.1 plasmid (Invitrogen/Thermo Fisher Scientific) by Kpn I/ Eco RI sites. For protein tagging and labeling of intracellular structures study, miRFP670nano was amplified, digested with restriction enzymes, and then swapped with miRFP703 either as C- (for α-tubulin and clathrin) or N-terminal fusions (for keratin, α-actinin, LifeAct, EB3, myosin, vimentin, clathrin, LAMP1, and H2B) 3 . To engineer caspase-3 activity NIR-reporter, fusion of miRFPP670nano and miRFP720, containing 11 amino acid linker with the caspase-3 recognition site (GG DEVD GPVAT), was designed. For this, a miRFP670nano gene was PCR amplified using primers containing the linker sequence, Nhe I and Age I sites and inserted into pcDNA3.1 plasmid (Invitrogen/Thermo Fisher Scientific), then miRFP720 gene was inserted by Age I and Not I sites. To create a JNK and PKA activity NIR-biosensor plasmids, we used a pJNKAREV-NES (3555NES) and pAKAR3EV-NES (3536NES) plasmids 29 kindly provided by K. Aoki. A YPet gene was replaced with miRFP670nano gene by Eco RI/ Xho I sites. An ECFP gene was replased with miRFP720 gene by Not I/ Xba I sites. Then, fragments encoding NIR sensors were cut out with Eco RI and Sal I restriction endonucleases and inserted into pcDNA3.1 plasmid (Invitrogen/Thermo Fisher Scientific). Fragment encoding p38m-KTR was cut out from pLentiPGK Puro DEST p38KTRClover (a gift from Markus Covert (Addgene plasmid # 59152)) with Eco RI and Age I restriction endonucleases and inserted into pEGFP-N1 (Clontech). Venus-PA-PKI was a gift from Klaus Hahn (Addgene plasmid # 65456). OptoJNKi was cut out from OptopKCAG-mCherry-OptoJNKi (a gift from Michael Courtney (Addgene plasmid # 89738)) with Eco RI and Bam HI restriction endonucleases and inserted into pEGFP-C1 (Clontech). Mammalian cells and transfection HeLa (CCL-2), U87 (HTB-14), U-2 OS (HTB-96), and NIH3T3 (CRL-1658) cells were obtained from the ATCC, PC6-3 cells were a kind gift of Dan Lindholm (University of Helsinki). Cells were grown in a Dulbecco's modified Eagle's medium (DMEM) medium supplemented with 10% fetal bovine serum, 0.5% penicillin–streptomycin, and 2 mM glutamine (Life Technologies/Invitrogen). For microscopy, cells were cultured in 35 mm glass-bottom Petri dishes (Greiner Bio-One International). Plasmid transfections were performed using polyethylenimine 48 . Stably expressing cells were selected with 1 mg ml −1 G418 antibiotic. Sorting of positive cells was performed using a BD Influx cell sorter (BD Biosciences) equipped with 640 nm laser for excitation and a 670/30 nm emission filter.
Cell fixation
HeLa cells transfected with miRFP670nano, miRFP670, and miRFP703 were dissociated from culture dishes with 0.25% trypsin (Gibco/Thermo Fisher Scientific), washed and re-suspended in PBS. For fixation, 10 6 cells were incubated on ice with 1 ml of 4% paraformaldehyde solution for 10, 30, or 60 min and then washed. Fluorescence was measured using Cary Eclipse Fluorescence Spectrophotometer (Agilent Technologies).
Neuronal culture and transfection
Primary rat cortical neurons were prepared in Neuronal Cell Culture Unit, University of Helsinki. All animal work was performed in accordance with the ethical guidelines of the European convention and regulations of an Ethics committee for animal research of the University of Helsinki. Cells were plated at a density of 600,000–700,000 per glass bottom 35 mm dishes coated with poly- l -Lysine (0.01 mg ml −1 ) (Merck) in a neurobasal medium (Gibco) supplemented with B27 (Life Technologies/Invitrogen), l -glutamine (Invitrogen), and penicillin-streptomycin (Lonza). Cultured neurons were transfected at 2–3 days in vitro (DIV) with a pcDNA3.1 plasmid (Invitrogen/Thermo Fisher Scientific), encoding miRFP670nano using Effectene Transfection Reagent (Qiagen). Neurons were imaged 48 h after transfection.
Widefield fluorescence microscopy
Live cells were imaged with an Olympus IX81 inverted epifluorescence microscope 48 h after the transfection. The microscope was equipped with a 200 W metal halide arc lamp (Lumen220PRO, Prior), a 60 × 1.35 numerical aperture (NA) oil objective lens (UPlanSApo, Olympus) and an opiMOS sCMOS camera (QImaging).
During imaging
HeLa cells were incubated in a cell imaging medium (Life Technologies-Invitrogen) and kept at 37 °C. The microscope was operated with a SlideBook v.6.0.8 software (Intelligent Imaging Innovations). To separately image miRFP670nano and miRFP720 in one cell (two NIR color imaging), the two filter sets (605/30 nm exciter and 667/30 nm emitter, and 685/20 nm exciter and 725/40 nm emitter) (Chroma) were used.
Photobleaching measurements of cytoplasmically expressed NIR FPs in live
HeLa cells were performed with the 60 × 1.35 NA oil immersion objective lens (UPlanSApo, Olympus) and a 650/13 nm (exciter) and 684/24 nm (emitter) filter set (Semrock). To obtain FRET images a 605/30 excitation filter and two emission filters (667/30 nm for miRFP670nano and 725/40 nm for miRFP720) were used. Emission ratios were obtained by calculating background-subtracted FRET intensities divided by background-subtracted miRFP670nano intensities for JNK and PKA NIR biosensors. For caspase-3 reporter FRET to donor intensities ratio was calculated. FRET measurements were quantified using ImageJ (NIH). Intensity-modulated display mode was generated with a full-spectrum lookup table. Time-course ratio measurements were normalized to baseline prestimulation values. HeLa cells expressing JNK and PKA NIR biosensors were starved for 6 h with DMEM medium (Gibco/Thermo Fisher Scientific) before imaging. To photoactivate PA-PKI and OptoJNKi, the transfected cells were continuously illuminated using 460/20 nm custom‐assembled LED array (LED Engin) at the light power density of 0.5 mW cm −2 .
Flow cytometry
The samples were analyzed using a BD Accuri C6 flow cytometer. Prior to acquisition, cell pellets were washed with PBS and diluted in cold PBS to a density of 500,000 cells ml −1 . At least 50,000 cells per sample were recorded. miRFP670nano, miRFP670, and miRFP703 were excited with a 640 nm laser and their fluorescence was detected with a 675/25 or 670 nm LP emission filters. EGFP was excited with a 488 nm laser, and its fluorescence was detected with a 510/15 nm emission filter. Mean NIR fluorescent intensity of the double-positive cell population was normalized to mean green fluorescence intensity of the co-expressed EGFP to account for transfection efficiency. The data were analyzed using a FlowJo v.7.6.2 software. Imaging in mice The Swiss Webster 2- to 3-month-old female mice (National Cancer Institute, NIH) with body weights of 22–25 g were used. To compare brightness of miRFP670nano with miRFP670 as well as to show possibility of two-color imaging HeLa cells were injected subcutaneously in the interscapular area of FVB mice. For better imaging, the fur on the bellies of the mice was removed using a depilatory cream. HeLa cells were co-transfected with the pcDNA-miRFP670nano or pcDNA-miRFP670 and pRluc8 plasmids in a 10:1 ratio for comparison study. HeLa cells were transfected with the pcDNA-miRFP670nano or pmiRFP720 and pRluc8 plasmids for two-color study. Various number of HeLa cells in 100 μl of RPMI-1640 media supplemented with 2 mM l -glutamine were injected subcutaneously 72 h after the transfection. For fluorescence and bioluminescence detection, 1 h after the HeLa cells injection the animals were imaged using an IVIS Spectrum instrument (Perkin Elmer/Caliper Life Sciences). Fluorescence was detected with 640/20 nm excitation and 680/30 nm emission filters for miRFP670nano or 675/20 nm excitation and 720/30 nm emission filters for miRFP720. Bioluminescence was detected with an open emission filter. Throughout the imaging, animals were maintained under anesthesia with 1.5% vaporized isofluorane. Prior to imaging, 80 μg of Inject-A-Lume coelenterazine substrate for Rluc8 (NanoLight Technology) was intravenously injected through a retro-orbital vein. Data were analyzed using Living Image 3.0 software (Perkin Elmer/Caliper Life Sciences). All animal experiments were performed in an AAALAC-approved facility using protocols approved by the Albert Einstein College of Medicine Animal Usage Committee. Forty-five mice were used in this study. Reproducibility The experiments were not randomized. The investigators were not blinded to allocation during the experiments and outcome assessment. No sample-size estimation was performed to ensure adequate power to detect a pre-specified effect size.
📊 Figures
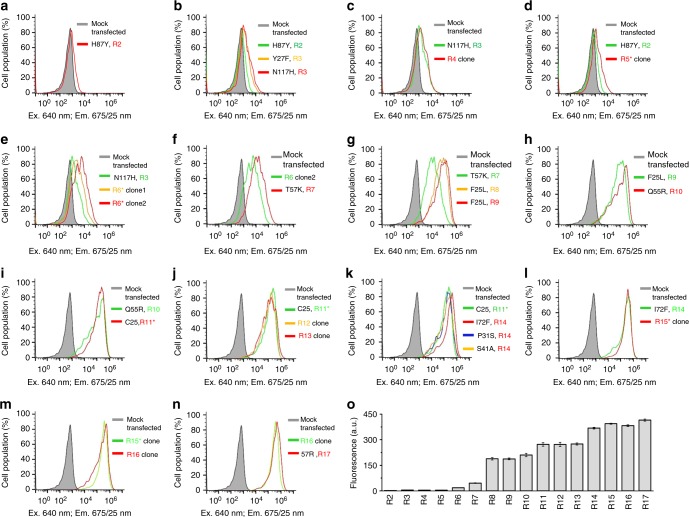
Fig. 1
Molecular engineering of miRFP670nano. a u2013 n Comparison of clones selected on each round of selection in HeLa cells. The main mutations are indicated. o Quantification of the data represented in a...
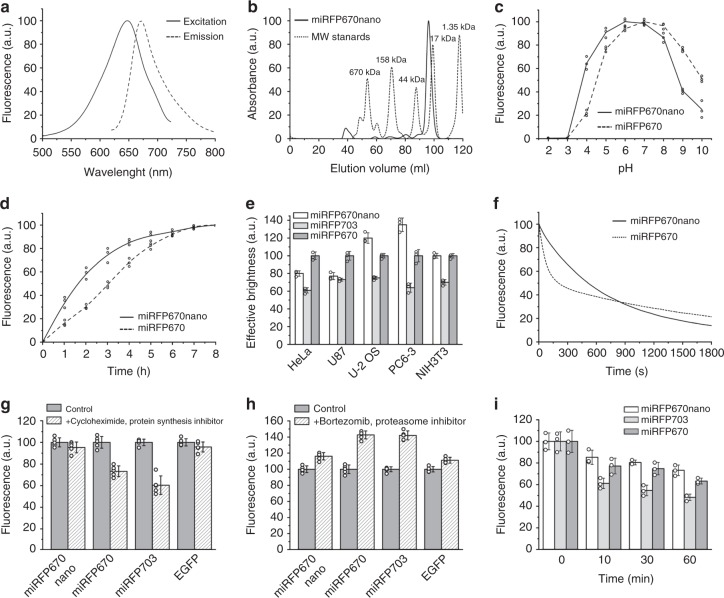
Fig. 2
Characterization of miRFP670nano. a Fluorescence excitation and emission spectra of miRFP670nano. b Size-exclusion chromatography of miRFP670nano at concentration 10u2009mgu2009ml u22121 and indicated...
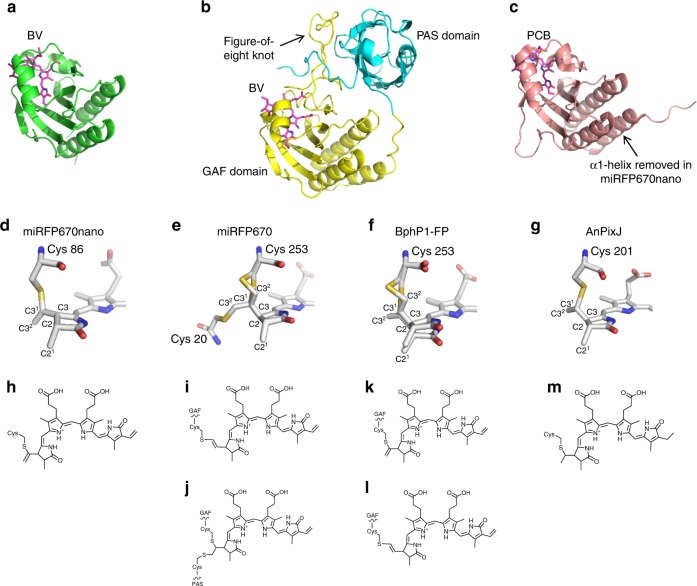
Fig. 3
Comparison of miRFP670nano, miRFP670, BphP1-FP, and AnPixJ structures and chromophores. a u2013 c Overall structures of a miRFP670nano, b miRFP670 (PDB ID: 5VIV), BphP1-FP (PDB ID: 4XTQ), and c AnPixJ...
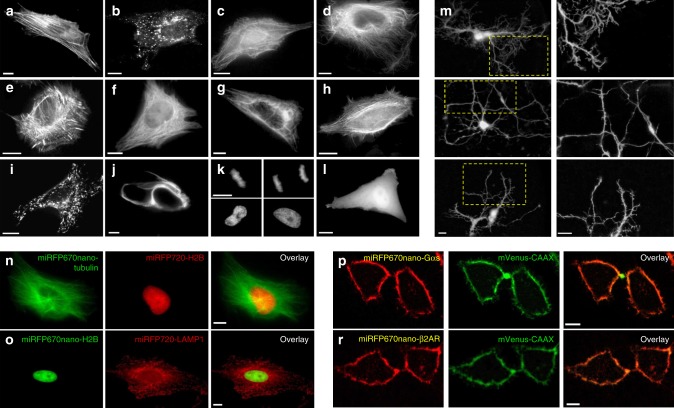
Fig. 4
miRFP670nano fusions imaged using epifluorescence microscopy. Live HeLa cells transfected with the miRFP670nano N- and C-terminal fusion constructs. The C-terminal fusions are a actin; b vesicular pro...
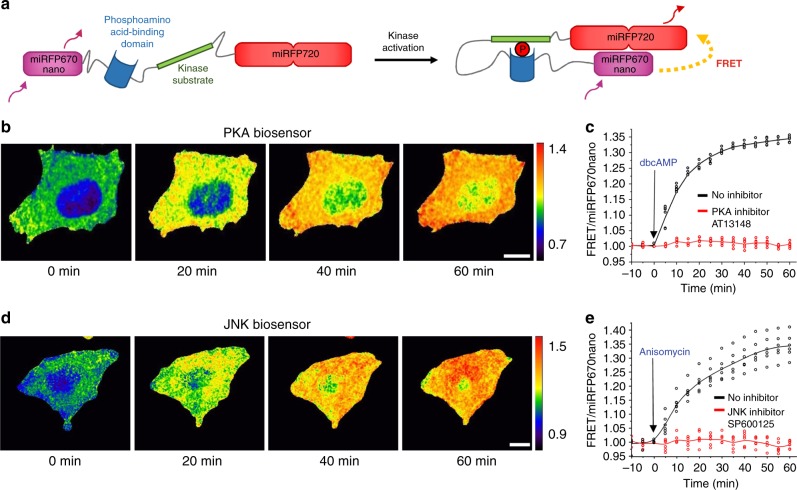
Fig. 5
NIR biosensors for detection of PKA and JNK kinase activities. a Schematic representation of miRFP670nano-miRFP720-based NIR FRET biosensor for kinase activity. b Time-lapse FRET/miRFP670nano ratio im...
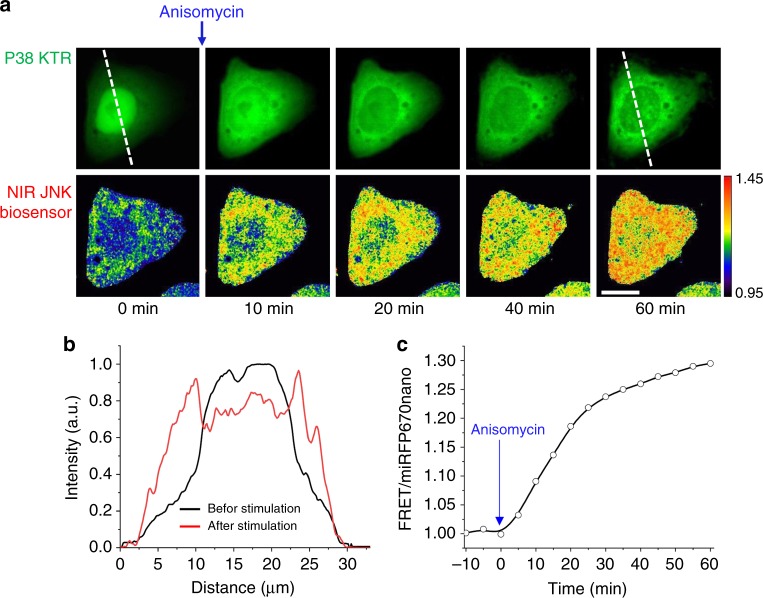
Fig. 6
HeLa cell stably expressing NIR JNK biosensor co-transfected with p38 kinase translocation reporter (p38 KTR). a p38 KTR-EGFP translocation (top row) and FRET/miRFP670nano ratio changes (bottom row) u...
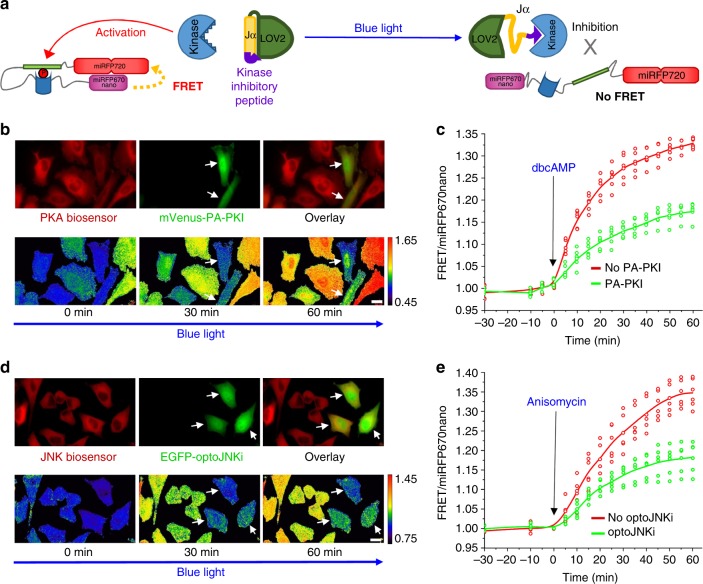
Fig. 7
Multiplexing of NIR PKA and JNK biosensors with optogenetic kinase inhibitors. a Schematic representation of LOV2-domain-based blue-light-regulatable kinase inhibitor in combination with respective fu...
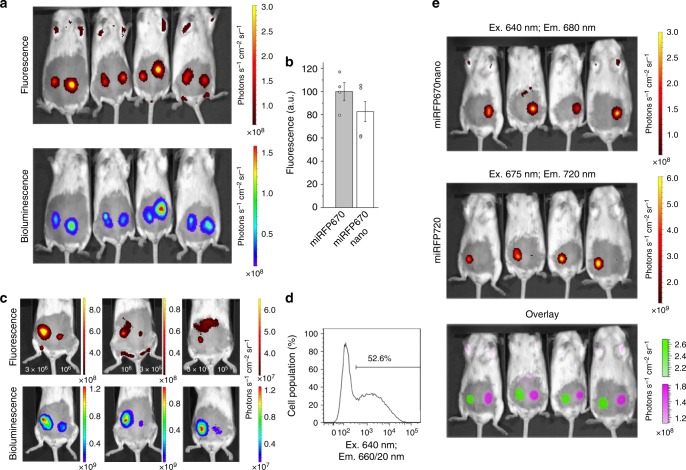
Fig. 8
Characterization of miRFP670nano in vivo. a Comparison of miRFP670nano with miRFP670 in vivo. Fluorescence (top row) and bioluminescence (bottom row) images of living mice injected with 3u2009u00d7u20...
Figure images are served from the NIH/NLM PubMed Central Open Access Subset or Europe PMC; copyright remains with the publishers and authors.
💬 Discussion
0 commentsNo comments yet. Be the first to start a discussion!
Leave a Comment