Abstract
Atherosclerosis is associated with a compromised endothelial barrier, facilitating the accumulation of immune cells and macromolecules in atherosclerotic lesions. In this study, we investigate endothelial barrier integrity and the enhanced permeability and retention (EPR) effect during atherosclerosis progression and therapy in Apoe-/- mice using hyaluronan nanoparticles (HA-NPs). Utilizing ultrastructural and en face plaque imaging, we uncover a significantly decreased junction continuity in the atherosclerotic plaque-covering endothelium compared to the normal vessel wall, indicative of disrupted endothelial barrier. Intriguingly, the plaque advancement had a positive effect on junction stabilization, which correlated with a 3-fold lower accumulation of in vivo administrated HA-NPs in advanced plaques compared to early counterparts. Furthermore, by using super-resolution and correlative light and electron microscopy, we trace nanoparticles in the plaque microenvironment. We find nanoparticle-enriched endothelial junctions, containing 75% of detected HA-NPs, and a high HA-NP accumulation in the endothelium-underlying extracellular matrix, which suggest an endothelial junctional traffic of HA-NPs to the plague. Finally, we probe the EPR effect by HA-NPs in the context of metabolic therapy with a glycolysis inhibitor, 3PO, proposed as a vascular normalizing strategy. The observed trend of attenuated HA-NP uptake in aortas of 3PO-treated mice coincides with the endothelial silencing activity of 3PO, demonstrated in vitro. Interestingly, the therapy also reduced the plaque inflammatory burden, while activating macrophage metabolism. Our findings shed light on natural limitations of nanoparticle accumulation in atherosclerotic plaques and provide mechanistic insight into nanoparticle trafficking across the atherosclerotic endothelium. Furthermore, our data contribute to the rising field of endothelial barrier modulation in atherosclerosis.
🔬 Techniques
🔭 Microscopes
💻 Software
✨ Fluorophores
🧪 Sample Preparation
🔬 Cell Lines
🏭 Microscope Brands
🧪 Reagent Suppliers
📷 Detectors
🔎 Objectives
💻 Software Details
🏛️ Research Organizations (ROR)
Affiliated research institutions:
📋 Methods
Experimental Setup
To investigate the relation between the vascular endothelial barrier integrity and HA-NP plaque targetability in the atherosclerotic plaque progression, Apoe –/– mice were put on a 6- or 12-week high-fat diet (HFD) to develop early or advanced atherosclerotic lesions, respectively ( n = 5/group). Two h before sacrifice, the mice received an intravenous (i.v.) injection of Cy5.5-labeled HA-NPs. The chosen time point post-HA-NP administration was based on the previously reported correlation between early accumulation levels of long-circulating nanoparticles and plaque permeability. 21 The correlation was strong at 30 min and 6 h and became non-significant at 24 h post-administration, which we attributed to the intraplaque NP redistribution and cell internalization. Therefore, 2 h circulation time ensures detectable levels of plaque-associated HA-NPs interacting with the endothelium. The excised aortas were cut longitudinally to expose the luminal endothelium surface for immunofluorescence imaging, as described previously, 29 and were stained for endothelial adherens junctions (vascular endothelial cadherin, VEC), macrophages (MAC-3), and nuclei (DAPI). Subsequently, the aortic arch samples were imaged by advanced microscopy methods, including confocal, super-resolution, electron, and correlative fluorescence and electron microscopy. Our experimental setup is outlined in Figure 1 A. Figure 1 (A) Schematic representation of experimental setup used to study atherosclerotic endothelial integrity. ApoE –/– mice were on either a 6-week or 12-week HFD to develop early or advanced atherosclerotic lesions, respectively. Subsequently, the mice received Cy5.5-labeled HA-NPs 2 h before their sacrifice. The excised aortic arches were fixed and cut longitudinally to expose luminal endothelial surface. The samples were stained and imaged en face by confocal and super-resolution fluorescence microscopy. Furthermore, sections of aortic arches were investigated by electron microscopy and correlative super-resolution fluorescence and electron microscopy. (B) Representative confocal microscopy data obtained by en face analysis of the aortic arch of an Apoe –/– mouse after 6 weeks HFD. 3D visualization of an early atherosclerotic lesion (left image; MAC-3: green, VEC: red, DAPI: blue, HA-NPs: cyan blue). MIP of the luminal surface of the same atherosclerotic plaque with the VEC-stained endothelium (middle image) and the corresponding MIP of the entire plaque volume displaying HA-NP fluorescence (left image). (C) Heterogeneity of intraplaque distribution of HA-NPs in mice after 6-week HFD. The images represent luminal (upper), intermediate (middle), and medial (lower) sections of atherosclerotic plaque. The changes in the plaque cellularity can be deduced from DAPI staining (blue, left panel), whereas the presence of vascular endothelium is visualized by VEC staining (red, middle). In the right panel, the intraplaque distribution of HA-NP fluorescence (cyan blue) can be followed. It changes from relatively homogeneous at the plaque surface to focal in the intermediate plaque compartment and finally disappears at the media. (D) The HA-NP uptake (cyan blue, right) by intimal macrophages (green, left). Upper panel displays single, presumably recently recruited macrophages in the aortic intima, which contain high levels of internalized HA-NPs. The middle and lower images display macrophages/foam cells found superficially and in deeper compartments of established atherosclerotic lesions, receptively. The former internalized efficiently HA-NPs, whereas the latter had only HA-NP-positive cell margins.
Show full methods section
Experimental Setup
To investigate the relation between the vascular endothelial barrier integrity and HA-NP plaque targetability in the atherosclerotic plaque progression, Apoe –/– mice were put on a 6- or 12-week high-fat diet (HFD) to develop early or advanced atherosclerotic lesions, respectively ( n = 5/group). Two h before sacrifice, the mice received an intravenous (i.v.) injection of Cy5.5-labeled HA-NPs. The chosen time point post-HA-NP administration was based on the previously reported correlation between early accumulation levels of long-circulating nanoparticles and plaque permeability. 21 The correlation was strong at 30 min and 6 h and became non-significant at 24 h post-administration, which we attributed to the intraplaque NP redistribution and cell internalization. Therefore, 2 h circulation time ensures detectable levels of plaque-associated HA-NPs interacting with the endothelium. The excised aortas were cut longitudinally to expose the luminal endothelium surface for immunofluorescence imaging, as described previously, 29 and were stained for endothelial adherens junctions (vascular endothelial cadherin, VEC), macrophages (MAC-3), and nuclei (DAPI). Subsequently, the aortic arch samples were imaged by advanced microscopy methods, including confocal, super-resolution, electron, and correlative fluorescence and electron microscopy. Our experimental setup is outlined in Figure 1 A. Figure 1 (A) Schematic representation of experimental setup used to study atherosclerotic endothelial integrity. ApoE –/– mice were on either a 6-week or 12-week HFD to develop early or advanced atherosclerotic lesions, respectively. Subsequently, the mice received Cy5.5-labeled HA-NPs 2 h before their sacrifice. The excised aortic arches were fixed and cut longitudinally to expose luminal endothelial surface. The samples were stained and imaged en face by confocal and super-resolution fluorescence microscopy. Furthermore, sections of aortic arches were investigated by electron microscopy and correlative super-resolution fluorescence and electron microscopy. (B) Representative confocal microscopy data obtained by en face analysis of the aortic arch of an Apoe –/– mouse after 6 weeks HFD. 3D visualization of an early atherosclerotic lesion (left image; MAC-3: green, VEC: red, DAPI: blue, HA-NPs: cyan blue). MIP of the luminal surface of the same atherosclerotic plaque with the VEC-stained endothelium (middle image) and the corresponding MIP of the entire plaque volume displaying HA-NP fluorescence (left image). (C) Heterogeneity of intraplaque distribution of HA-NPs in mice after 6-week HFD. The images represent luminal (upper), intermediate (middle), and medial (lower) sections of atherosclerotic plaque. The changes in the plaque cellularity can be deduced from DAPI staining (blue, left panel), whereas the presence of vascular endothelium is visualized by VEC staining (red, middle). In the right panel, the intraplaque distribution of HA-NP fluorescence (cyan blue) can be followed. It changes from relatively homogeneous at the plaque surface to focal in the intermediate plaque compartment and finally disappears at the media. (D) The HA-NP uptake (cyan blue, right) by intimal macrophages (green, left). Upper panel displays single, presumably recently recruited macrophages in the aortic intima, which contain high levels of internalized HA-NPs. The middle and lower images display macrophages/foam cells found superficially and in deeper compartments of established atherosclerotic lesions, receptively. The former internalized efficiently HA-NPs, whereas the latter had only HA-NP-positive cell margins.
Methods Hyaluronan Nanoparticle Preparation
Hyaluronan nanoparticles (HA-NPs) were prepared as previously described. 18 In short, HA was dissolved in 2-( N -morpholino)ethanesulfonic acid (MES) buffer and activated with 1-ethyl-3-(3-(dimethylamino)propyl)carbodiimide hydrochloride (EDC) (Thermo Fisher Scientific, Waltham MA, USA) and N -hydroxysulfosuccinimide (sulfo-NHS) (Thermo Fisher Scientific). Subsequently, ethylenediamine (Sigma-Aldrich, St. Louis, Missouri, United States) was added, and the reaction mixture was stirred at room temperature overnight. The amine-functionalized HA (HA-NH 2 ) was purified by dialysis against ultrapure water and ethanol precipitation. Afterward, the obtained product was lyophilized. NHS ester of cholanic acid (Sigma-Aldrich) was prepared by a reaction of cholanic acid with N , N′ -dicyclohexylcarbodiimide (Thermo Fisher Scientific) and N -hydroxysuccinimide (Sigma-Aldrich) in dry dimethylformamide (Sigma-Aldrich). The lyophilized HA-NH 2 was dissolved in 0.1 N NaHCO 3 pH 9, after which the cholanic ester solution was added drop-by-drop and stirred overnight. Purification of the product was performed by filtration and dialysis against ultrapure water. The final product was freeze-dried and stored at −20 °C. Fluorescent labeling of the nanoparticles was performed by a conjugation of cyanine5.5-NHS ester (Lumiprobe GmbH, Hannover, Germany) to the remaining primary amine groups on the HA. Cyanine5.5-NHS ester was dissolved in dry DMF and added to a solution of HA-NPs in 0.1 N NaHCO 3 pH 8.5 (40% (v/v) DMF) at a 8:1 molar ratio dye to residual NH 2 groups and stirred for 4 h at room temperature. Unconjugated dye was removed by ethanol precipitation and dialyses against ultrapure water. Animal Experiments Eight week-old Apoe –/– mice (Charles River Laboratories, Beerse, Belgium) were fed with a high-fat diet (HFD) (TD.88137, Envigo, Alconbury Huntington, UK) for either 6 or 12 weeks ( n = 5/group) to induce early and advanced atherosclerotic lesions, respectively. After the diet period, the mice received an injection of Cy5.5-labeled HA-NPs (25 mg/kg) via the tail vein. Two h after injection, the mice were sacrificed and perfused with PBS. The aortic arch samples were used for both the confocal and GSD microscopy experiments. For electron microscopy and correlative light and electron microscopy, two atherosclerotic mice were perfused with McDowell Trump’s fixative (4% paraformaldehyde (PFA) and 1% glutaraldehyde). In the therapeutic study, 8 week-old Apoe –/– mice on a HFD received either no treatment (control) or three times per week intraperitoneal injection of 3PO (Sigma-Aldrich; 25 mg/kg) (metabolic therapy) (n = 10). After 6 weeks of treatment and/or diet, the mice received i.v. injection of Cy5.5-HA-NPs and 2-NBDG, a fluorescent glucose analogue (Invitrogen, ThermoFisher Scientific), 2 h and 15 min before the sacrifice, respectively. The sacrificed animals were perfused with PBS, which was followed by excision of the entire aorta, that is, aortic arch and descending aorta including the renal arterial branching. Subsequently, the aortas were imaged using the IVIS imaging system, whereas aortic roots were processed for histology. All mouse experiments were performed in accordance with protocols approved by the Animal Experiment Committee of Academic Medical Center in Amsterdam, The Netherlands.
En Face Analysis of Aortic Samples by Confocal Microscopy
The aortas harvested for en face immunofluorescence microscopy experiments were fixed in 4% PFA in PBS (supplemented with 1 mM CaCl 2 and 0.5 mM MgCl 2 ) for 12 min at room temperature (RT). Aortic arches, which are the most prone to atherosclerotic plaque development, were taken for further analysis. First, the carotid and subclavian arteries were cut out of the aortas. The aortic arch was sectioned into pieces and immobilized with 0.1 mm diameter pins on a Petri dish coated with a silicone layer, with the endothelium facing up. Subsequently, the samples were permeabilized with 0.5% Triton X-100 in PBS for 10 min and blocked for 30 min with 2% bovine serum albumin (BSA) in PBS. Afterward, the vessels were incubated with goat antimouse VEC (Santa Cruz; 1:100 dilution; clone C-19) and rat antimouse CD107b (BD Pharmingen; dilution 1:100; clone M3/84) primary antibodies for 1 h at RT, then washed with 0.5% BSA in PBS, and incubated with the Alexa Fluor 594-conjugated chicken antigoat and Alexa Fluor 488-conjugated donkey antirat (both Thermo Fisher Scientific; dilution 1:100) secondary antibodies for an additional 1 h at RT. The cell nuclei were visualized using 4′,6-diamidino-2-phenylindole (DAPI) at the concentration of 2 μg/mL for 10 min. After staining, the vessels were mounted in a drop of mowiol on microscope slides with the endothelium facing up. A glass coverslip was then placed on the top and gently pressed to flatten the tissue. Imaging was performed by using Leica TCS SP8 confocal laser scanning microscope (Leica Microsystems, Wetzlar, Germany), equipped with CS2 63×/1.40 oil objective, 405 nm UV diode and 470–670 nm Argon lasers. The localization of atherosclerotic plaques was based on intimal MAC-3-positive macrophages. In each aortic arch, we visualized approximately four lesions, for which image Z-stacks were acquired.
Quantification of VE-cadherin
(VEC) continuity was performed using ImageJ. First, VEC images were processed with a Gaussian Blur filter with a radius of 1.5, which was followed by the image binarization and skeletonization. Subsequently, the length of VEC skeleton branches was calculated, and the data were imported into Prism5 (GraphPad Software, La Jolla, CA), with a minimum cutoff of 3 μm. The mean length of VEC branching per lesion was used for the statistical comparison of VEC continuity. To determine the efficacy of HA-NP accumulation in the plaque, first, the plaque area was defined in each Z -stack plane. Subsequently, an intensity threshold was manually set to select high-intensity Cy5.5-HA-NP-positive pixels. From the binary image, the HA-NP area was determined and normalized to the plaque area. The mean percentage of HA-NP-positive plaque area, calculated from all plaque focal planes, was used as a quantifier of the plaque accessibility to HA-NPs.
En Face Analysis of Aortic Samples by Super-Resolution Fluorescence Microscopy
Samples used for super-resolution fluorescence microscopy underwent the same fixation protocol as the samples used for confocal microscopy imaging (4% PFA; 12 min). The samples were stained using rat antimouse VEC (Biolegend, San Diego, USA; dilution 1:100; clone BV13) primary antibody, for 1 h, in combination with a goat antirat Alexa Fluor 555-conjugated secondary antibody (Thermo Fischer Scientific; dilution 1:100) for an additional 1 h. The aortic sample was placed on an ultraclean coverslip and covered with a drop of imaging buffer (50 μL mercaptoethylamine (MEA; Sigma-Aldrich) 0.5 M, pH 8–8.5; 3 μL of NaOH 5M; 15 μL of oxygen-reducing reagent OxeA (Oxyrase Inc., Mansfield, USA); 100 μL of sodium d , l -lactate (equal concentration of d and l isomers and 350 μL PBS) before being covered with a second coverslip to stabilize its position. The sample was then mounted on a Chamlide CMB magnetic chamber (Live Cell Instrument, Chamlide CM-B25-1). Ground-state depletion (GSD) followed by individual molecule return (GSDIM) imaging was performed in total internal reflection fluorescence (TIRF) mode with a Leica SR-GSD microscope (Leica Microsystems; Wetzlar, Germany), equipped with a 160×/oil immersion dedicated SR objective, a sCMOS pco.edge42 camera, and a 647 nm/500 mW laser. Between 20,000 and 40,000 frames were acquired with a 10 ms exposure time with image size of 180 × 180. Raw data sets were processed using the ImageJ plug-in ThunderStorm, 75 and images were reconstructed with a rendering pixel size of 20 nm. The processed GSDIM images were analyzed with respect to the continuity of VEC expression, which was manually determined as the largest distance between VEC molecules by using ImageJ. This was done for both the normal vessel wall and atherosclerotic endothelial data ( n = 13). The subcellular localization of HA-NPs in the atherosclerotic endothelium was analyzed for the para- (junction) and intracellular compartments. First, the total number of HA-NPs was determined from the binary image, applying a size threshold of four pixels. Subsequently, the endothelial junction area was delineated based on the VEC molecule expression, and the number of associated HA-NPs was determined ( Figure S1C ). HA-NPs outside the junction were considered as intracellular. For statistical comparison, normalized HA-NP values were used. Transmission Electron Microscopy and Correlative Light and Electron Microscopy of Aortic Sections Aortic arches were fixed using McDowell Trump’s fixative for 24 h. Subsequently, they were infiltrated in a series of gelatin (until 12%) in PBS, incubated overnight in 2 M sucrose, and snap-frozen in liquid nitrogen. Semi-thin cryo-sections (100–250 nm) were cut as described by Bedussi et al . 76 and transferred to a copper finder or normal 150 mesh grid. For transmission electron microscopy, the samples were stained with a mixture of uranyl acetate/tylose and imaged using a Tecnai T12 electron microscope at 120 kV. For correlative fluorescence and electron microscopy, the aortic sections were first imaged with GSDIM microscope to detect Cy5.5-labeled HA-NPs. The sample preparation and image acquisition was the same as described in the section on super-resolution microscopy. Additionally, epifluorescence images were acquired for the morphological context. Subsequently, the sample grids were carefully washed with water, stained with a uranyl acetate/tylose mixture and imaged using a Tecnai T12 electron microscope. The image alignment was based on morphological hallmarks visible by both fluorescence and electron microcopy, that is, elastin and macrophage lipid droplets, and was performed in Adobe Photoshop CS6 (Adobe inc., San Jose, USA). In Vitro Effects of 3PO on the Endothelial Barrier Integrity HUVEC (passage 3) were seeded on fibronectin-coated glass coverslips and grown for 24 h until confluency. The cells were stimulated with either TNF-α (10 ng/mL) alone or in combination with 10 μM 3PO (Axon Medchem). DMSO was used as vehicle control. After 24 h, the cells were fixed for 10 min at RT with 4% PFA in PBS ++ . Fixed HUVEC were permeabilized with 0.5% Triton X-100 in PBS for 5 min and blocked for 15 min with 2% BSA in PBS. After blocking, the cells were incubated for 45 min at RT with VEC primary polyclonal rabbit antibody (Cayman Chemical; dilution 1:100), washed with 0.5% BSA in PBS, and incubated at RT with a secondary chicken antirabbit Alexa Fluor 594 coupled antibody (Invitrogen; dilution 1:100) in combination with Promofluor 488-coupled phalloidin (F-actin staining; PromoKine; dilution 1:200) for an additional 45 min. DAPI (2 μg/mL) was used to visualize the cell nuclei. Coverslips were then mounted with mowiol on microscope slides. Widefield imaging was performed on Nikon microscope, equipped with Apo TIRF 40× oil objective, 470–670 argon laser, and an Andor Zyla sCMOS digital camera. All obtained images were adjusted for brightness/contrast and processed with an unsharp mask filter in ImageJ (National Institute of Health). Image processing and quantification of VEC continuity were performed using the same method as described in the en face analysis of aortic samples by confocal microscopy. F-actin continuity was quantified using the same protocol as for VEC, using a minimum branch length cutoff of 7 μm. In Vitro Evaluation of Metabolic Effects of 3PO in Human Endothelial Cells and Macrophages To determine the cell type specific metabolic effects of 3PO, the uptake of fluorescent glucose analogue 2-NBDG and expression of GLUT-1 receptor was measured by flow cytometry (FACS). HUVEC and HMDM were incubated with 3PO at a concentration ranging from 1 μM to 30 μM. Non-treated or DMSO (Sigma-Aldrich) treated cells were used as controls. After 30 min of pretreatment, 100 ng/mL of lipopolysaccharide (LPS) and 10 ng/mL of TNF-α were added to HMDM and HUVEC, respectively. After 24 h, the medium was replaced by fresh medium containing 100 μM of 2-NBDG. After 30 min of incubation, the medium was removed, and the cells were washed with PBS. The HUVEC and HMDM were detached by 5 min incubation with trypsin or citrate solution, respectively. The cell suspension was transferred to U-bottom 96-wells plates (Greiner), centrifuged for 5 min at 600 g , and resuspended in FACS buffer (2 mM EDTA, 0.5% BSA in PBS). Cells that were incubated with either DMSO or 10 μM 3PO were resuspended in FACS buffer containing rabbit polyclonal antimouse GLUT-1 antibody (Merck; dilution 1:100) and incubated for 30 min. For HMDM, i.v. immunoglobulin (IVIG; Sanquin, Amsterdam, The Netherlands; dilution 1:100) was used to block fc-receptor binding. After washing with FACS buffer, antirabbit Alexa Fluor 647 secondary antibody (dilution 1:500) was added, and the cell suspension was incubated for another 30 min. Afterward, the cells were washed two times and resuspended in 100 μL of FACS buffer. FACS measurements were performed on a CytoFLEX S flow cytometer (Beckman Coulter). Data analysis was carried out using FlowJo V10 software (FLOWJO, Ashland, OR, USA). A single cell population was selected on the basis of forward and side scatter. Within this population, the median fluorescence intensity (MFI) of 2-NGBG signal was determined as a parameter of glucose uptake, while MFI of Alexa Fluor 647 was used as a measure of GLUT-1 expression. IVIS Imaging of Aortas IVIS imaging was performed on a IVIS 200 Spectrum optical imaging system (Xenogen, Corporation, Alameda, USA) at the imaging unit of the Mouse Cancer Clinic at The Netherlands Cancer Institute. The vessels were immobilized on clear plastic dishes with lids (dimensions 41 × 23 × 12 mm), coated with BISON silicone (color antracid). The dishes were filled with PBS to prevent dehydration, sealed, and stored in dark at 4 °C until imaging. The fluorescence signal of 2-NBDG was imaged using an excitation filter of 465 nm and emission filter of 540 nm. For imaging of Cy5.5-HA-NP fluorescence, an excitation filter of 675 nm and emission filter of 720 nm were used. For both 2-NBDG and Cy5.5-HA-NP imaging, the exposure time was 1 s. Image analysis was performed using Living Image 4.0 software (PerkinElmer, Waltham, USA). For each sample, a ROI was drawn around the aortic arch and the first part of subclavian and carotid branches. For each ROI, the average radiant efficiency of 2-NBDG and Cy5.5-HA-NP was quantified and used for statistical comparison. Histology of Aortic Roots To determine the effects of metabolic therapy on the atherosclerotic plaque size and morphology, the hearts with aortic roots were fixed in 4% paraformaldehyde for 24 h, followed by dehydration and embedding in paraffin. Subsequently, the roots where cut into 4 μM-thick sections. Before staining, the sections were deparaffinized and rehydrated. The plaque size and necrosis fraction was determined from the hematoxyline and eosin (H&E; Sigma-Aldrich)-stained aortic root sections. The mean plaque area was derived from measurements of 5–6 sections per mouse, in which all three aortic valves were present. The plaque necrosis was measured as the acellular plaque area and normalized to the total plaque area. Collagen content was quantified based on Sirius red (Sigma-Aldrich) staining. For immunohistochemical stainings, endogenous peroxidase activity was blocked by treatment with 0.3% H 2 O 2 (Merck, Burlington, USA) in methanol for 30 min. Subsequently, the samples were placed in boiling citrate-based antigen unmasking solution (Vector Laboratories, Burlingame, USA) for 10 min. Blocking was performed for 60 min using 4% FCS in Tris-buffered saline (TBS) containing 1% BSA and 0.1% Tween-20. The macrophage and smooth muscle cell content was determined in sections stained with rat antimouse MAC-3 (BD Pharmingen; dilution 1:30; clone M3/84) and mouse antimouse α smooth muscle actin (αSMA; Sigma-Aldrich; 1:500; clone 1A4) primary antibody, respectively. After overnight incubation with the primary antibodies, biotinylated rabbit antirat (Vector Laboratories, Burlingame, CA; dilution 1:300) or biotinylated goat antimouse (DAKO; dilution 1:1250) secondary antibody was applied for 30 min. Thereafter, avidin-peroxidase (Vectastatin Elite ABC HRP Kit, Vector Laboratories) was added for another 30 min. Color development was induced using ImmPact AMEC red peroxidase substrate (Vector Laboratories). Images were acquired using a light microscope (Leica Microsystems) at 100× magnification. The expression of HIF-1α and Glut1 in aortic root plaques was determined by immunofluorescence. HIF-1α and Glut1 were stained with a rabbit antimouse HIF-1α (Novus, Littleton, USA; dilution 1:50) and rabbit antimouse Glut1 (Merck; dilution 1:200) polyclonal primary antibody, respectively. As a secondary antibody, a donkey antirabbit Alexa 647 conjugated secondary antibody (Thermo Fischer Scientific; 1:500 dilution) was applied. Macrophages were visualized using a rat antimouse MAC-3 primary antibody (BD Pharmingen; dilution 1:100; clone M3/84) in combination with a donkey antirat Alexa 594-conjugated secondary antibody (Thermo Fischer Scientific; 1:500 dilution). Smooth muscle cells were stained with a FITC-conjugated antimouse αSMA primary antibody (Sigma-Aldrich; 1:3000; clone 1A4). The sections were incubated with the aforementioned primary antibodies overnight at 4 °C, after which the samples were washed, and secondary antibodies were applied for 1 h. Nuclei were stained with DAPI at a concentration of 2 μg/mL for 10 min. Images were acquired using a Leica TCS SP8 confocal microscope (Leica Microsystems). Quantification of collagen, MAC-3, and αSMA area was performed using ImageJ. First, RGB images were converted to 8-bit gray-scale images. After adjusting an intensity threshold, the stained area was masked, quantified, and normalized to the total plaque area. Quantification of the Glut1 and HIF-1α expression was performed using LAS X software (Leica Microsystems). For Glut1, first the atherosclerotic plaques were defined as ROIs on the basis MAC-3 and αSMA staining. Subsequently, the average fluorescence intensity of Alexa 647-stained Glut1 was calculated from all ROIs. Glut1 expression was also determined separately for MAC-3 and αSMA-positive plaque areas. Nuclear expression of HIF-1α was determined for plaque-associated macrophages. Only macrophages with a well-defined cytoplasm and nucleus were included in the analysis (∼50 cells/plaque). For each included macrophage, a line was drawn through the cytoplasm and nucleus to generate the signal intensity histogram of Alexa Fluor 647-HIF-1α. DAPI histogram served as a reference (representative histograms can be found in Figure S11 ). The nucleus was considered as HIF-1α positive if its HIF-1α fluorescence signal was approximately 3-fold higher compared to the cytoplasm. The percentage of HIF-1α positive macrophage nuclei was used as a quantifier of hypoxic activation.
Statistical Analysis
The normality of data distribution was tested with a Shapiro-Wilk test. The comparison of the endothelial junction continuity in the plaque and normal vessel wall was performed using a two-tailed paired Student’s t test. The intergroup comparisons of the endothelial junction continuity and HA-NP plaque accumulation were done using a two-tailed unpaired Student’s t test. The same analysis was performed when comparing the largest intrajunctional distance and endothelial cell thickness between the plaque and normal vessel wall. In vitro data on glucose uptake in HUVEC and HMDM were analyzed using one-way ANOVA with Tukey’s post hoc test. The in vitro VEC continuity and F-actin fiber length data were analyzed using an unpaired Student’s t test. The same test was used to compare the histological outcome of the 3PO and control group. All of the analyses were performed using IBM SPSS Statistics 23 by setting the significance level at p < 0.05.
Supplementary Material nn8b08875_si_001.pdf
📊 Figures
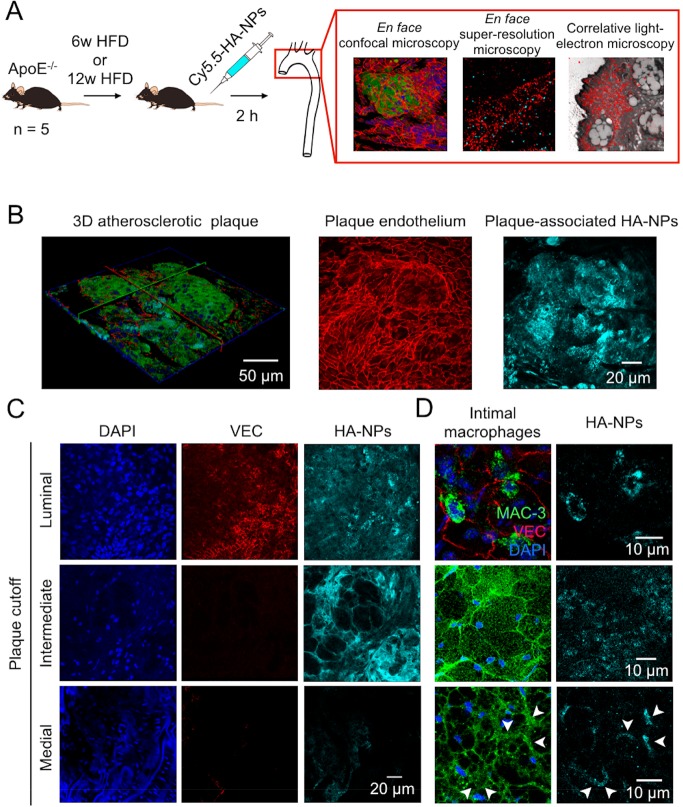
Figure 1
(A) Schematicnrepresentation of experimental setup used to studynatherosclerotic endothelial integrity. ApoE u2013/u2013 mice were on either a 6-week orn12-week HFD to develop early or advanced athero...
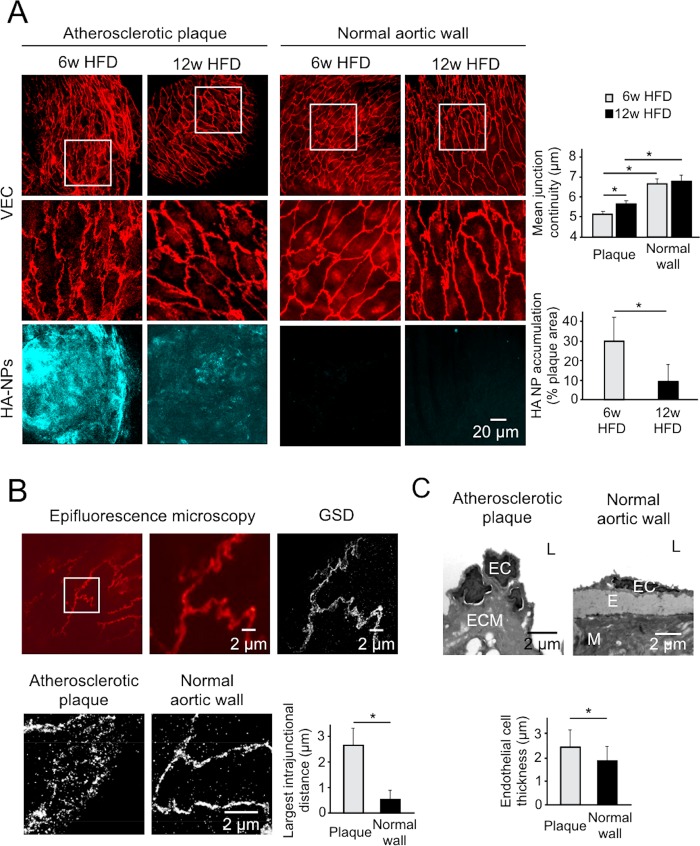
Figure 2
(A) Comparison of thenendothelial adherens junction architecturenand HA-NP uptake efficacy in atherosclerotic lesions and normal vesselnwall. Upper, left panel displays representative MIPs of VEC-stai...
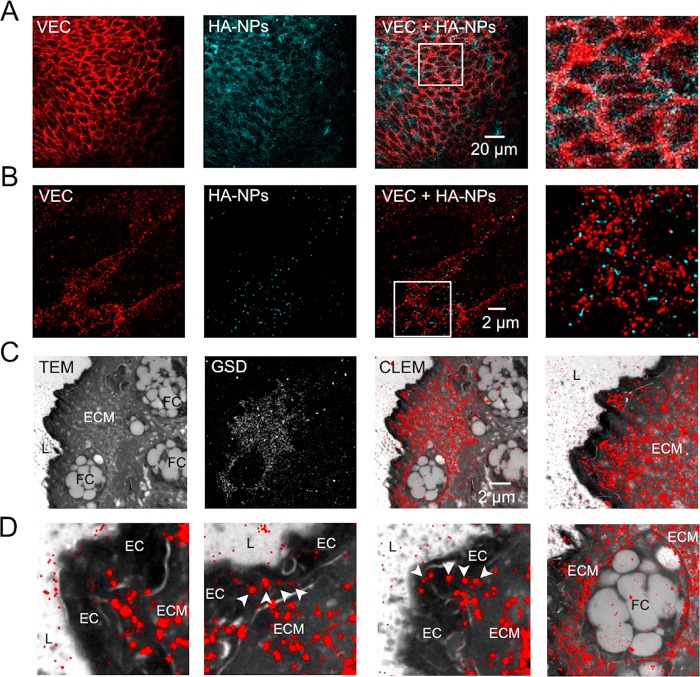
Figure 3
(A) Confocal microscopy images of VEC-stainednendothelial junctionsn(red, first image) and HA-NPs (cyan blue, second image) at the surfacenof an atherosclerotic plaque. The co-distribution of HA-NP an...
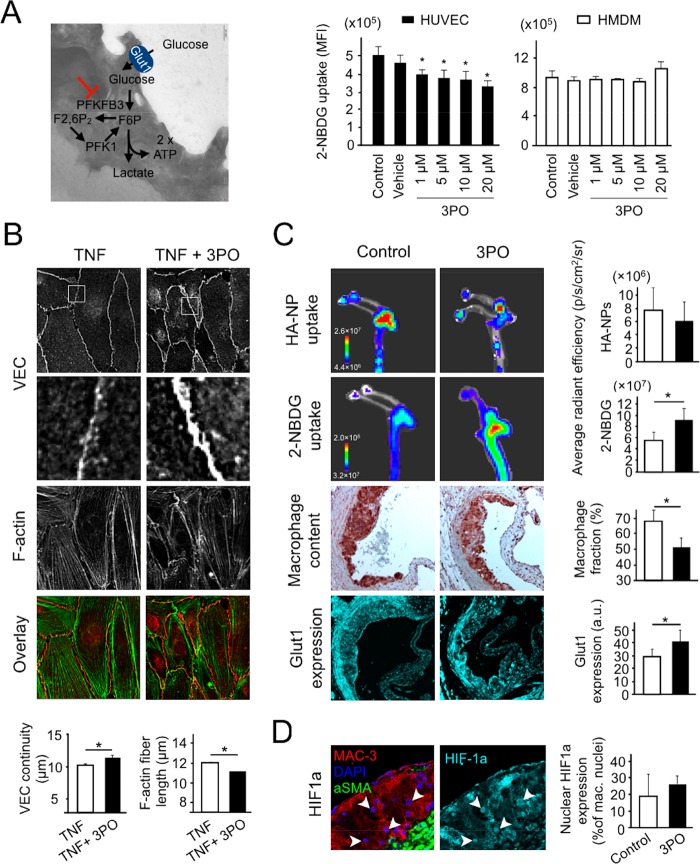
Figure 4
(A) Schematic representation of the glycolysisnpathway, in whichn3PO inhibits activity of PFKFB3 enzyme (left panel). The right panelndisplays in vitro effects of different concentrationsnof 3PO (1u20...
Figure images are served from the NIH/NLM PubMed Central Open Access Subset or Europe PMC; copyright remains with the publishers and authors.
💬 Discussion
0 commentsNo comments yet. Be the first to start a discussion!
Leave a Comment