Abstract
ABSTRACTBiofluid‐accessible extracellular vesicles (EVs) may represent a new means to improve the sensitivity and specificity of detecting disease. However, current methods to isolate EVs encounter challenges when they are used to select specific populations. Moreover, it has been difficult to comprehensively characterize heterogeneous EV populations at the single vesicle level. Here, we robustly assessed heterogeneous EV populations from cultured cell lines via nanoparticle tracking analysis, proteomics, transcriptomics, transmission electron microscopy, and quantitative single molecule localization microscopy (qSMLM). Using qSMLM, we quantified the size and biomarker content of individual EVs. We applied qSMLM to patient plasma samples and identified a pancreatic cancer‐enriched EV population. Our goal is to advance single molecule characterization of EVs for early disease detection.Abbreviations: EV: Extracellular Vesicle; qSMLM: quantitative Single Molecule Localization Microscopy; PDAC: Pancreatic Ductal Adenocarcinoma; EGFR: epidermal growth factor receptor 1; CA19‐9: carbohydrate antigen 19‐9; SEC: size exclusion chromatography; WGA: wheat germ agglutinin; AF647: Alexa Fluor 647; Ab: antibody; HPDEC: Healthy Pancreatic Ductal Epithelial Cell; TEM: Transmission Electron Microscopy.
🔬 Techniques
🔭 Microscopes
🧬 Organisms
💻 Software
✨ Fluorophores
🧪 Sample Preparation
🔬 Cell Lines
🏭 Microscope Brands
🧪 Reagent Suppliers
📷 Detectors
🔎 Objectives
💻 Software Details
💾 Data Repositories
🏛️ Research Organizations (ROR)
Affiliated research institutions:
📋 Methods
Cell culture PANC-1 cells
(ATCC) were cultured in RPMI-1640 phenol red-free media supplemented with 10% (v/v) EV depleted FBS (Gibco; A2720801), 1% (v/v) penicillin-streptomycin (Thermo; 15140148), 2 mM glutamax (Gibco; 35030061), and 1 mM sodium pyruvate (Gibco; 11360070). Human immortalized pancreatic ductal epithelial cells (HPDEC, AddexBio, San Diego, CA) were grown in Keratinocyte SFM medium with defined Keratinocyte SFM supplements (Life Technologies; 17005042 and S0015) per supplier suggestion and subsequently cultured in phenol red–free Epilife media supplemented with calcium chloride and Epilife supplements (Life Technologies; MEPICFPRF500 and S0125). EVs from PANC-1 cells were collected between passages 8–15 and EVs from HPDECs were collected between passages 3–7. EV purification from cells Three 150 mm plates (Corning; 430599) were each plated with 6 × 10 6 cells in 40 mL of culture media, cells reached 80% confluency three days after seeding. 40 mL of conditioned media was collected from each plate after three days in culture. The resulting 120 mL of conditioned media was spun at 300xG for 10 minutes at room temperature to remove cell debris. Then the total volume of conditioned media was concentrated to 400 μL using a Vivaspin 20 100 kDa concentrator (VWR; 95056–134) by centrifuging at 1000xG in 10 minute increments. Between each spin, dilute media was added and pipetted to homogenize the concentrating solution, ensuring the EVs remained soluble. For EV purification from cell line conditioned media, the resulting 400 μL of concentrated media was loaded onto a qEV column (iZON; qEVoriginal) equilibrated at room temperature with PBS, according to manufacturer instructions. EV purification from plasma For EV purification from PDAC patients or healthy subject plasma, ~200 μL of plasma was loaded onto a PBS-equilibrated qEVoriginal column. 500 μL fractions 6–22 were collected. F8 was analysed by NanoSight for EV concentration. Nanoparticle tracking analysis (NTA) A NS300 Nanosight (Nanosight, Malvern) instrument was used to analyse EVs. To determine the concentration of EVs in qEV fractions, purified EVs were diluted 1:20 in PBS. Automatic settings were applied for the blur and minimum track length. For capture settings, screen gain was set at 1 and camera level was set at 15 or 16. For analysis settings, screen gain was set at 8–10 and detection threshold was set at 5. Two movies of 60 seconds were captured at 30 frames per second for each sample, and the determined concentrations were averaged. Negative staining transmission electron microscopy 4 μL of EVs were absorbed to glow discharged, carbon-coated 200 mesh EM grids. Grids were washed in Milli-Q water three times for 20 seconds followed by conventional negative staining with 1% (w/v) uranyl acetate. Images were collected using an FEI Tecnai 12 transmission electron microscope (Thermo Fisher Scientific) equipped with a LaB6 filament and operated at an acceleration voltage of 120 kV. Images were recorded with a Gatan 2 k × 2 k CCD camera (Gatan, Inc., Pleasanton, CA, USA) at a magnification of 11,000X and a defocus value of ~1.5 μm. Images from three independent preparations were processed using custom MATLAB code to extract EV sizes from TEM images. Images were first binarized with an intensity threshold adjusted to account for the brightness of each image. Detected objects smaller than 800 pixels and those that were not roughly circular were removed. Remaining objects were then morphologically closed and filled. EV area was determined by integrating the number of pixels, given a 0.95 nm pixel size. Diameters were taken to be 2√(Area/π).
Show full methods section
Cell culture PANC-1 cells
(ATCC) were cultured in RPMI-1640 phenol red-free media supplemented with 10% (v/v) EV depleted FBS (Gibco; A2720801), 1% (v/v) penicillin-streptomycin (Thermo; 15140148), 2 mM glutamax (Gibco; 35030061), and 1 mM sodium pyruvate (Gibco; 11360070). Human immortalized pancreatic ductal epithelial cells (HPDEC, AddexBio, San Diego, CA) were grown in Keratinocyte SFM medium with defined Keratinocyte SFM supplements (Life Technologies; 17005042 and S0015) per supplier suggestion and subsequently cultured in phenol red–free Epilife media supplemented with calcium chloride and Epilife supplements (Life Technologies; MEPICFPRF500 and S0125). EVs from PANC-1 cells were collected between passages 8–15 and EVs from HPDECs were collected between passages 3–7. EV purification from cells Three 150 mm plates (Corning; 430599) were each plated with 6 × 10 6 cells in 40 mL of culture media, cells reached 80% confluency three days after seeding. 40 mL of conditioned media was collected from each plate after three days in culture. The resulting 120 mL of conditioned media was spun at 300xG for 10 minutes at room temperature to remove cell debris. Then the total volume of conditioned media was concentrated to 400 μL using a Vivaspin 20 100 kDa concentrator (VWR; 95056–134) by centrifuging at 1000xG in 10 minute increments. Between each spin, dilute media was added and pipetted to homogenize the concentrating solution, ensuring the EVs remained soluble. For EV purification from cell line conditioned media, the resulting 400 μL of concentrated media was loaded onto a qEV column (iZON; qEVoriginal) equilibrated at room temperature with PBS, according to manufacturer instructions. EV purification from plasma For EV purification from PDAC patients or healthy subject plasma, ~200 μL of plasma was loaded onto a PBS-equilibrated qEVoriginal column. 500 μL fractions 6–22 were collected. F8 was analysed by NanoSight for EV concentration. Nanoparticle tracking analysis (NTA) A NS300 Nanosight (Nanosight, Malvern) instrument was used to analyse EVs. To determine the concentration of EVs in qEV fractions, purified EVs were diluted 1:20 in PBS. Automatic settings were applied for the blur and minimum track length. For capture settings, screen gain was set at 1 and camera level was set at 15 or 16. For analysis settings, screen gain was set at 8–10 and detection threshold was set at 5. Two movies of 60 seconds were captured at 30 frames per second for each sample, and the determined concentrations were averaged. Negative staining transmission electron microscopy 4 μL of EVs were absorbed to glow discharged, carbon-coated 200 mesh EM grids. Grids were washed in Milli-Q water three times for 20 seconds followed by conventional negative staining with 1% (w/v) uranyl acetate. Images were collected using an FEI Tecnai 12 transmission electron microscope (Thermo Fisher Scientific) equipped with a LaB6 filament and operated at an acceleration voltage of 120 kV. Images were recorded with a Gatan 2 k × 2 k CCD camera (Gatan, Inc., Pleasanton, CA, USA) at a magnification of 11,000X and a defocus value of ~1.5 μm. Images from three independent preparations were processed using custom MATLAB code to extract EV sizes from TEM images. Images were first binarized with an intensity threshold adjusted to account for the brightness of each image. Detected objects smaller than 800 pixels and those that were not roughly circular were removed. Remaining objects were then morphologically closed and filled. EV area was determined by integrating the number of pixels, given a 0.95 nm pixel size. Diameters were taken to be 2√(Area/π).
Western and dot blot
For western blots, 20 μL of purified EV fractions were added to 5 μL of sample buffer and boiled for 3 minutes. Samples were spun at 16000xG for 3 minutes at 4°C. 10 μL of sample was loaded and separated by SDS-PAGE using 4–20% gradient gels (Bio-Rad; 456–1096). Following electrophoresis, proteins were transferred to a nitrocellulose membrane (Bio-Rad; 1620115), using the Bio-Rad Trans-Blot Turbo transfer system. For dot blots, 0.1 μg of HPDEC or PANC-1 cell lysate was diluted into 20 μL of PBS. 5 μL of diluted cell lysate or F8 EVs were dotted onto nitrocellulose membranes, and allowed to dry as previously described [ 14 ]. Membranes were blocked with 5% BSA Fraction V (RPI; A30075-100) in TBS-T for 30 minutes and then incubated with primary Ab overnight at 4°C. Primary Abs used for these experiments were anti-TSG101 (1:1000, Sigma; T5701-200UL), anti-CD63 (1:250, Abcam; ab134045), and anti-EGFR (1:1000, Abcam; ab52894). After several washes with TBS-T, membranes were incubated with either goat anti-rabbit (1:5000, Abcam; ab97051) or goat anti-mouse (1:5000, Abcam; ab97023) HRP-conjugated secondary Ab for 1 hour at room temperature. Protein detection was performed using the Bio-Rad ChemiDoc Touch imaging system.
Surface assay
The following molecules, primary Abs, and secondary Abs were used for the specific isolation and detection of EVs: WGA-AF647 (Invitrogen; W32466 ), cetuximab (Bristol-Myers Squibb), mouse anti CA19-9 (US Biologics; C0075-03A), goat anti-human (Jackson Laboratory; 109-005-098), goat anti-mouse (Millipore; Ap124), and goat anti-rabbit (Abcam; ab6702). The membrane label Cell Tracker CM-DiI (Cell Tracker, Invitrogen; C7000) stock was prepared in DMSO, as per manufacturer instructions. Where applicable, primary Abs were fluorescently labelled with AF647 N -hydroxysuccinimidyl (NHS) ester (Thermo; A20006). We used optimized Ab labelling conditions [ 25 ] to obtain approximately one dye per Ab. The degree of labelling was calculated with a NanoDrop for each batch of labelled Abs. To minimize the effects of labelling heterogeneity on molecular counting, we defined the average number of detected localizations using the SAMI assay [ 17 ]. To calculate the photophysical properties, surfaces of sparsely attached reporters were prepared. Briefly, 25-mm #1.5 coverslips (Warner Instruments, Hamden, CT) were cleaned, flame dried, stored, then activated for covalent protein attachment as described in detail previously [ 26 ]. The soluble extracellular fragment of EGFR (R&D systems; 344-ER) was attached to coverslips (30 nM final concentration in 150 µL of PBS) and detected with cetuximab-AF647 (30 nM final concentration in 150 µL of PBS). Anti CA19-9 Ab-AF647 was directly attached to coverslips (30 nM final concentration in 150 µL of PBS). Surfaces were blocked after initial protein attachment with PEG-His 6 (50 μM final concentration in 150 μL of PBS). These surfaces were imaged under the same conditions as surfaces with EVs, described below. The resulting localizations were analysed to determine the average number of fluorophore appearances per molecule as described [ 17 ]. Average values of 2 appearances per molecule were determined for both cetuximab-AF647 and anti CA19-9 Ab-AF647 (Figure S2). For EV affinity isolation, secondary Ab (1 μM final concentration in 150 μL of PBS) followed by PEG-His 6 (50 μM final concentration in 150 μL of PBS) was covalently attached to the surface of activated coverslips as previously described [ 17 ]. Concurrently, 7 × 10 8 EVs were diluted in EV blocking buffer (PBS with 0.5% BSA and 0.01% Tween-20) to a final volume of 150 μL. Primary Ab or WGA was added to the 150 μL diluted EV sample (final concentration of 2 µg/mL) and rotated for 1 hour at room temperature. CM-DiI was added during the last 15 minutes of this incubation (final concentration of 2 µg/mL). Excess primary Ab, WGA, and CM-DiI were partially removed by centrifugation in a 300 kDa concentrator (VWR; 29300–626). Specifically, EV samples were washed in 400 μL of blocking buffer and centrifuged at max speed (15000xG) for 30 seconds (repeated three times). Subsequently, labelled EVs were incubated on secondary Ab or PEG coated surfaces, as indicated, for 30 minutes at room temperature. Surfaces were washed with EV blocking buffer three times then PBS three times, fixed with 4% paraformaldehyde (VWR; 102091–918) and 0.2% glutaraldehyde (VWR; 100505–010) in PBS for 30 minutes, and quenched for 10 minutes with 25 mM glycine. Fixative was removed by washing with PBS three times, then coverslips were loaded into Attofluor cell chambers (Life Technologies; A7816) with PBS until ready for imaging. Important controls included surfaces prepared with PEG-His 6 alone (50 μM final concentration in 150 μL of PBS) and lysed EVs. For the lysed EV control, EVs were incubated with EV lysis buffer (50 mM TRIS pH 7.5, 150 mM NaCl, 1% Triton-X 100, 5% glycerol, 1 mM DTT) for 30 minutes at room temperature. Lysed EVs were then buffer exchanged into EV blocking buffer with a 100 kDa concentrator (VWR; 29300–624) followed by incubation with cetuximab-AF647 and CM-DiI as described above. dSTORM imaging EVs were localized in TIRF using fluorescent signal from the membrane dye CM-DiI. Surfaces were imaged immediately after preparation in dSTORM imaging buffer (50 mM Tris pH 8.0, 10 mM NaCl, 10% glucose, 100 mM mercaptoethylamine, and GLOX (10% v/v)) as previously described [ 27 ]. Imaging was performed on a 3D N-STORM super-resolution microscope (Nikon). The N-STORM system is a fully automatic Ti-E inverted microscope with a piezo stage on a vibration isolation table. This system includes a 100 × 1.49 NA TIRF objective (Apo), N-STORM lens, λ/4 plate, and Quad cube C-NSTORM (97355 Chroma). To maintain imaging at the appropriate focal plane, the microscope has a Perfect Focus Motor. A MLC-MBP-ND laser launch included 405, 488, 561, and 647 nm lasers (Agilent). Images are captured with an EM-CCD camera iXon DU897-Ultra (Andor Technology, South Windsor, CT).
Using NIS-Elements 4.3 Software
(Nikon) dSTORM images of 41 × 41 μm were collected with an exposure time of 10 ms. 10,000 frames were acquired for each field of view. To activate/excite AF647, the 647 nm laser power was set to 146 mW. TIRF images were collected using NIS-Elements 4.3 Software and CM-DiI was excited using the 561 nm laser with a power of 0.615–0.123 mW.
Data analysis
Fluorophore localizations (above 700 photons) were extracted from raw image data using NIS-Elements. The NIS-Elements density filter with a 70 nm distance and 30 count threshold was used to remove background localizations (e.g. single fluorescent Ab molecules that were not removed during the 300 kDa filter dilution step; see filter optimization below). We performed drift correction and then used custom MATLAB code to remove artifact puncta (e.g. impurities that persistently fluoresce) via a filter removing all points within a 100 nm radius of any region where at least 400 frames registered a localization within a 1000 frame window. Next, Voronoi tessellation was used to segment localizations into “clusters” and extract EV diameters and the number of molecules per EV. EVs with a radius below 7 nm or with fewer than 2 molecules were removed. Tessellation polygons were considered clustered if their aggregate area was smaller than 600 nm 2 . The Voronoi tessellation method was based on ClusterViSu [ 28 ], but modified to improve processing speed. To obtain the number of detected molecules, we divided the total number of localizations within a tessellated EV cluster by the average number of localizations for a given reporter (see Figure S2 and [ 17 ]). Simulations to characterize filters and thresholds To test the effect of the NIS-Elements thresholds used to remove signal unassociated with EVs, we simulated the localizations from individual EVs and background molecules. We varied the simulated EV size and molecules per EV to understand which EV parameters were detectable. Figure S3A shows the results of these simulations. Each grid cell corresponds to a simulated image with a particular EV size and molecules per EV. In Figure S3A (left) the cell colour indicates the ratio of the number of detected EVs to simulated EVs. Figure S3A (centre) shows the ratio of detected cluster diameter to simulated diameter. Figure S3A (right) shows the ratio of detected molecules per EV to simulated molecules per EV. Underestimations (dark blue) appear to occur in cases where there are less than 15 molecules per EV and large EVs with a low number of molecules per EV. Overestimations (yellow) appear to occur in cases where the diameters of EVs are below 40 nm, likely due to localization uncertainty (simulated to be 10 nm). Filters should be optimized by users for different preparation/imaging conditions. EV movement over the course of dSTORM imaging was measured to confirm insignificant effects on the calculation of EV size. Individual EV centroids were first extracted from Voronoi tessellation results. Using these centroids and cross-correlation [ 29 ], with a bin size of 500 frames, the average Brownian motion was tracked across the total image acquisition. The root mean squared error (RMSE) was then calculated for the overall drift and included with the drift plots shown in Figure S4. Simulations to characterize differences between EGFR-enriched EV populations detected with WGA-AF647 or cetuximab-AF647 Synthetic data was generated in MATLAB to validate the apparent differences in diameter between EVs detected with WGA and cetuximab. Experimental data (Figure S7B, top row) for EV diameters (WGA mean with SD: 72 ± 46 nm; cetuximab mean with SD: 51 ± 25 nm) and localization numbers (WGA mean with SD: 99 ± 117; cetuximab mean with SD: 56 ± 66) were used to inform the simulations (Figure S7B, middle row). Specifically, a spherical coordinate system was established to place localizations, in three dimensions, for an individual EV. The radial distance, polar angle, and azimuthal angle were all given levels of randomization (MATLAB rand function) within the space characterized by possible EV diameters, given a defined number of localizations. Features were also incorporated in the simulations to ensure that the majority of EVs were not perfectly spherical in shape. This included a second round of randomization on any one of the three dimensions to either extend or shorten the distance by the average localization precision (predetermined experimentally to be ~8 nm). In addition to the assigned random spherical coordinate, each localization was further provided with some average spatial error (
📊 Figures
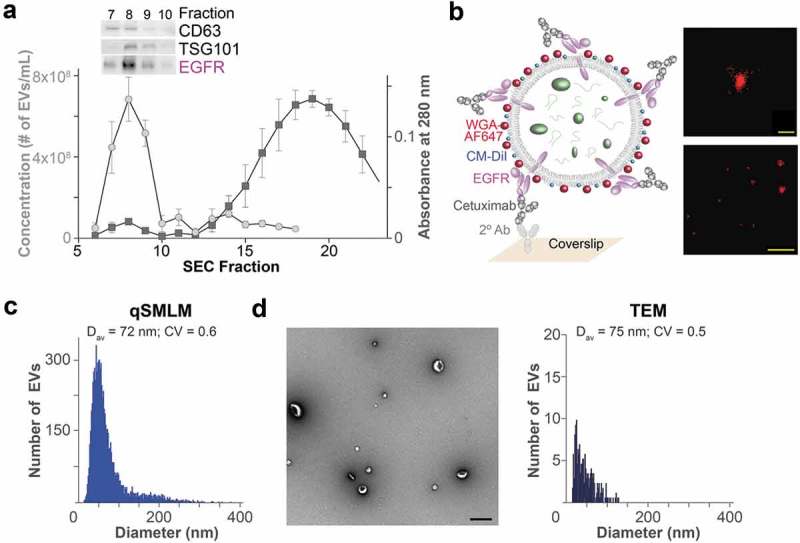
Figure 1.
Quantification of EV sizes. (a) EVs from PANC-1 cells were isolated using SEC and characterized for EV and protein concentration. Error bars represent SEM; N =u00a03. Protein levels for the EV markers...
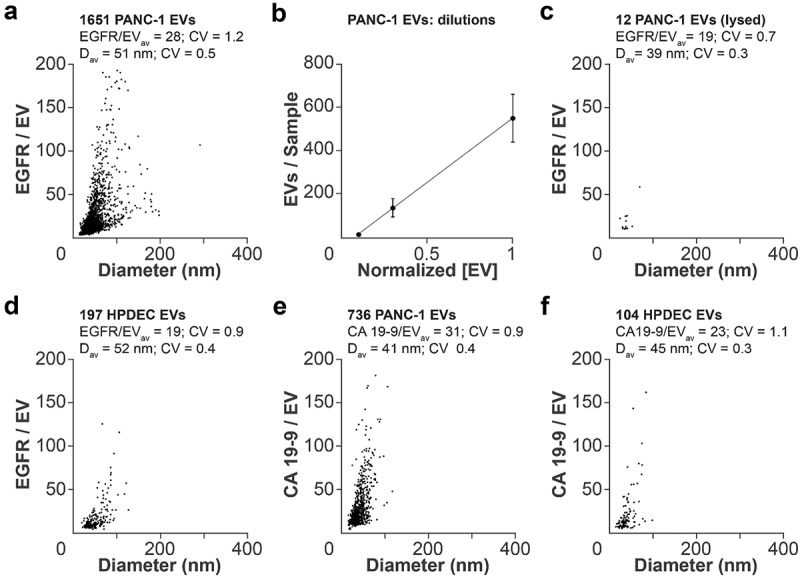
Figure 2.
Quantification of EV content. (a) qSMLM quantification of EGFR-enriched EVs from PANC-1 cells using cetuximab-AF647 as a reporter. (b) Average number of detected EVs from PANC-1 cells using different ...
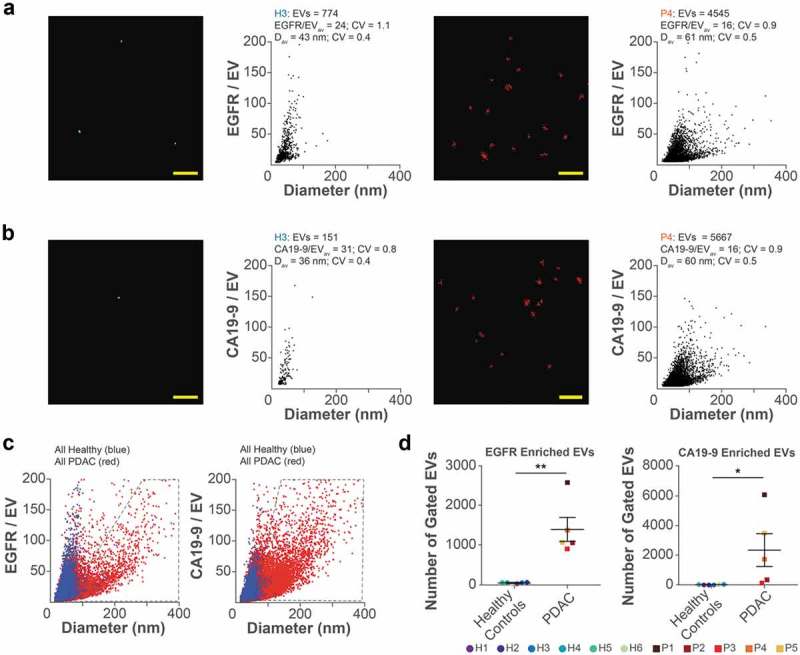
Figure 3.
Quantification of EVs from patient plasma. (a) Filtered dSTORM images and qSMLM quantification of EGFR-enriched EVs from plasma of healthy subject 3 (H3, left) and PDAC patient 4 (P4, right) using cet...
Figure images are served from the NIH/NLM PubMed Central Open Access Subset or Europe PMC; copyright remains with the publishers and authors.
💬 Discussion
0 commentsNo comments yet. Be the first to start a discussion!
Leave a Comment