Abstract
AbstractLiver sinusoidal endothelial cells (LSECs) act as a filter between blood and the hepatocytes. LSECs are highly fenestrated cells; they contain transcellular pores with diameters between 50 to 200 nm. The small sizes of the fenestrae have so far prohibited any functional analysis with standard and advanced light microscopy techniques. Only the advent of super-resolution optical fluorescence microscopy now permits the recording of such small cellular structures. Here, we demonstrate the complementary use of two different super-resolution optical microscopy modalities, 3D structured illumination microscopy (3D-SIM) and single molecule localization microscopy in a common optical platform to obtain new insights into the association between the cytoskeleton and the plasma membrane that supports the formation of fenestrations. We applied 3D-SIM to multi-color stained LSECs to acquire highly resolved overviews of large sample areas. We then further increased the spatial resolution for imaging fenestrations by single molecule localization microscopy applied to select small locations of interest in the same sample on the same microscope setup. We optimized the use of fluorescent membrane stains for these imaging conditions. The combination of these techniques offers a unique opportunity to significantly improve studies of subcellular ultrastructures such as LSEC fenestrations.
🔬 Techniques
✨ Fluorophores
🧪 Sample Preparation
🔬 Cell Lines
🧪 Reagent Suppliers
📷 Detectors
📋 Protocols
🏛️ Research Organizations (ROR)
Affiliated research institutions:
📋 Methods
Materials Reagents included Type 1 A Collagenase (Sigma Chemical, St. Louis, MO #C2674,) RPMI (Gibco Invitrogen #11875-093), CellMask Deep Red Plasma Membrane Stain, Invitrogen, # C10046 Mouse monoclonal Anti-β-Tubulin antibody, SIGMA, T8328 Alexa Fluor® 647 F(ab’)2 Fragment of Goat Anti-Mouse IgG (H + L), Invitrogen, A-21237, Lot# 1094366 CellMask Orange 5 mg/ml, Invitrogen, C10045 , Lot# 1159930 Alexa Fluor 488 – phalloidin 300 u in 1.5 ml Methanol, Invitrogen, A12379, Lot# 1120408 Vybrant DiD cell-labeling solution 1 mM, Invitrogen, V22887, Lot# 1046290 VECTASHIELD Mounting Medium with DAPI, Vector Laboratories, H-1200, Collagen and Fibronectin were purchased from Sigma Chemical.
Isolation and culture of LSECs Sprague
Dawley male rats (Scanbur BK, Sollentuna, Sweden) were kept under standard conditions and fed standard chow ad libitum (Scanbur, Nittedal, Norway). The experimental protocols were approved by the Norwegian National Animal Research Authority (NARA) in accordance with the Norwegian Animal Experimental and Scientific Purposes Act of 1986. All experiments were performed in accordance with relevant approved guidelines and regulations. The rats (body wt 150–300 g) were anesthetized with a mixture of medetomidin (Domitor vet, Orion, Turku, Finland) and ketamine (Ketalar, Pfizer, New York, NY) and LSECs were isolated and purified as described 32 and plated on fibronectin coated #1.5 coverslips for 3 h in RPMI-1640. The LSECs were then fixed with 4% paraformaldehyde (PFA) in phosphate buffered saline (PBS) and 0.02 M sucrose, pH 7.2 for 15 min, and stored under PBS. Following fixation the cells were prepared for visualization using 3D-SIM and d STORM.
Show full methods section
Materials Reagents included Type 1 A Collagenase (Sigma Chemical, St. Louis, MO #C2674,) RPMI (Gibco Invitrogen #11875-093), CellMask Deep Red Plasma Membrane Stain, Invitrogen, # C10046 Mouse monoclonal Anti-β-Tubulin antibody, SIGMA, T8328 Alexa Fluor® 647 F(ab’)2 Fragment of Goat Anti-Mouse IgG (H + L), Invitrogen, A-21237, Lot# 1094366 CellMask Orange 5 mg/ml, Invitrogen, C10045 , Lot# 1159930 Alexa Fluor 488 – phalloidin 300 u in 1.5 ml Methanol, Invitrogen, A12379, Lot# 1120408 Vybrant DiD cell-labeling solution 1 mM, Invitrogen, V22887, Lot# 1046290 VECTASHIELD Mounting Medium with DAPI, Vector Laboratories, H-1200, Collagen and Fibronectin were purchased from Sigma Chemical.
Isolation and culture of LSECs Sprague
Dawley male rats (Scanbur BK, Sollentuna, Sweden) were kept under standard conditions and fed standard chow ad libitum (Scanbur, Nittedal, Norway). The experimental protocols were approved by the Norwegian National Animal Research Authority (NARA) in accordance with the Norwegian Animal Experimental and Scientific Purposes Act of 1986. All experiments were performed in accordance with relevant approved guidelines and regulations. The rats (body wt 150–300 g) were anesthetized with a mixture of medetomidin (Domitor vet, Orion, Turku, Finland) and ketamine (Ketalar, Pfizer, New York, NY) and LSECs were isolated and purified as described 32 and plated on fibronectin coated #1.5 coverslips for 3 h in RPMI-1640. The LSECs were then fixed with 4% paraformaldehyde (PFA) in phosphate buffered saline (PBS) and 0.02 M sucrose, pH 7.2 for 15 min, and stored under PBS. Following fixation the cells were prepared for visualization using 3D-SIM and d STORM.
Fluorescent staining of LSECs and imaging buffers
The fixed samples were washed with PBS. For Figs 1 , 3 and 4 the LSECs were permeabilised for 90 s with 0.5% Triton-X100 and washed 2–3 times with PBS. Non-specific binding sites were blocked by incubating the cells for 90 min with 5% BSA in PBS at 4 °C. The cells were incubated with the primary antibody (mouse anti beta-tubulin, 1:400) for 2 h at RT, then washed 3 times for 10 min with 0.1% PBS Tween-20. The secondary antibody (anti mouse AlexaFluor647, 1:400) was applied overnight at 4 °C. The staining solution was removed and washing steps with 0.1% PBS Tween-20 (3 times for 10 min) and PBS followed. The phalloidin AlexaFluor488 (1:40) and CellMask Orange (1:2000) were applied together for 20 min at 4 °C. Cells were washed with PBS and post-fixed with 4% PFA for 10 min, followed by a PBS washing step. The LSECs in Fig. 4 were incubated with phalloidin AlexaFluor488 (1:40) and Vybrant DiD (1:100) overnight at 4 °C. All samples were mounted in Vectashield containing DAPI and sealed with nail polish. For Suppl. Figure S1 , LSECs were stained with CellMask Deep Red (1:2000), or Vybrant DiD (1:200) for 20 min at RT, respectively. For Fig. 2 LSECs were stained with Vybrant DiD (1:200) for 20 min at RT. After removing the dye and rinsing each sample 3 times with PBS, these samples were mounted with a reservoir of an oxygen scavenging system including MEA 22 . Super resolution imaging of LSECs 3D-SIM images of LSECs were acquired on a commercial structured illumination microscope (DeltaVision|OMXv4.0 BLAZE, GE Healthcare) and reconstructed using the SoftWorX package from GE Healthcare. To achieve even higher spatial resolution of microtubules and fenestrations we used single molecule localization microscopy of conventional fluorophores (direct Stochastic Optical Reconstruction Microscopy - d STORM) on the same setup by changing the illumination mode from structured illumination to ring-TIRF (total internal reflection fluorescence excitation), albeit at an angle just below the critical angle to obtain a highly inclined laminated optical sheet (HiLo) illumination mode. To enable their controlled blinking, the AlexaFluor647 and DiD molecules were excited with a 642 nm laser and recovered from the dark state either with a weak 405 nm or 488 nm laser. The 642 nm laser power was set for Alexa647 at 100% and for DiD at 50% such that the density of the fluorophores in the fluorescent state is as high as possible while still being well separated to enable single molecule localization. Typical excitation laser power densities were approximately 0.25–0.5 kW/cm 2 . The acquisition time was 10–30 ms per frame and 10,000–15,000 frames were recorded using a sCMOS camera (total time ~10–15 min). Raw data were preprocessed to reduce background signal and single pixel characteristics intrinsic to sCMOS cameras by subtracting the average of the image stack from each individual frame. For the final reconstruction of a d STORM image at least 10,000 frames are analyzed by the open source reconstruction software rapidSTORM 30 33 . Images were corrected for sample drift by assuming linear drift using the built-in drift correction of rapidSTORM.
Materials Reagents included Type 1 A Collagenase (Sigma Chemical, St. Louis, MO #C2674,) RPMI (Gibco Invitrogen #11875-093), CellMask Deep Red Plasma Membrane Stain, Invitrogen, # C10046 Mouse monoclonal Anti-β-Tubulin antibody, SIGMA, T8328 Alexa Fluor® 647 F(ab’)2 Fragment of Goat Anti-Mouse IgG (H + L), Invitrogen, A-21237, Lot# 1094366 CellMask Orange 5 mg/ml, Invitrogen, C10045 , Lot# 1159930 Alexa Fluor 488 – phalloidin 300 u in 1.5 ml Methanol, Invitrogen, A12379, Lot# 1120408 Vybrant DiD cell-labeling solution 1 mM, Invitrogen, V22887, Lot# 1046290 VECTASHIELD Mounting Medium with DAPI, Vector Laboratories, H-1200, Collagen and Fibronectin were purchased from Sigma Chemical.
Supplementary Material Supplementary Movie 1 Supplementary Information
📊 Figures
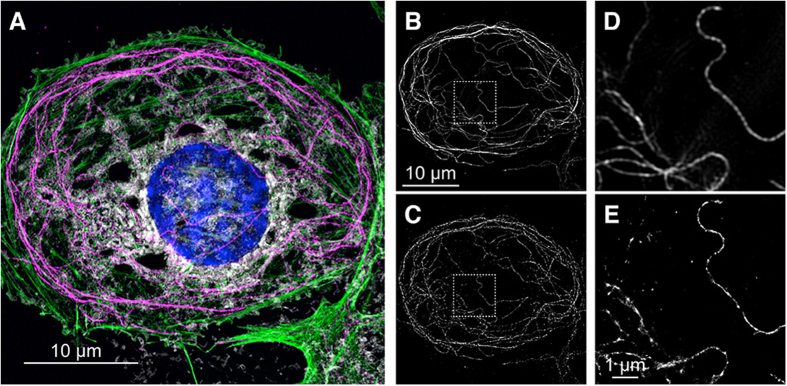
Figure 1
Correlating 3D-SIM and d STORM images of a rat liver sinusoidal endothelial cell (LSEC).
( A ) Maximum intensity z-projection 3D-SIM image of a 4-color-stained fixed rat LSEC. The nucleus was stained with DAPI (blue), actin filaments with Phalloidin-Alexa488 (green), membranes with CellMa...
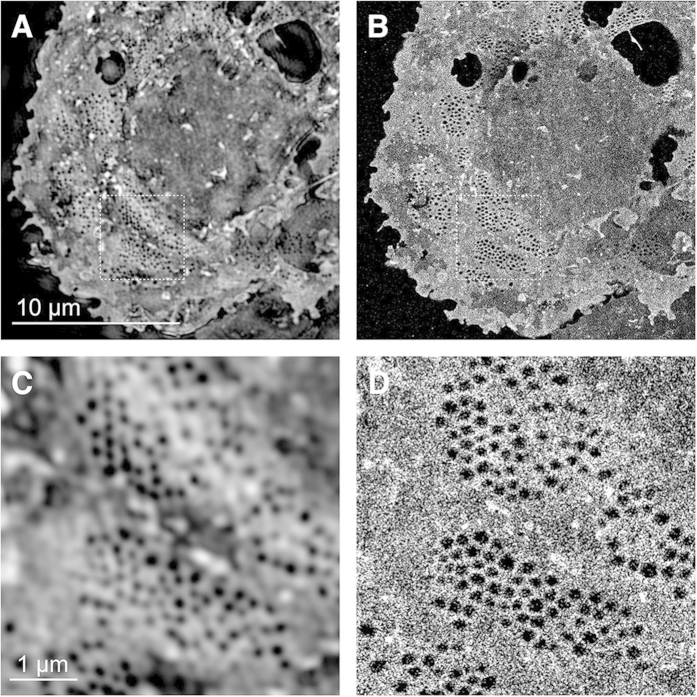
Figure 2
Comparison of 3D-SIM and d STORM images of fenestrations in rat LSECs stained with Vybrant DiD.
( A,C ) 3D-SIM and corresponding ( B,D ) d STORM images of a fixed rat LSECs stained with Vybrant DiD. The cells were mounted in the reducing buffer OSSu2009+u2009MEA (see Materials and Methods). ( C,...
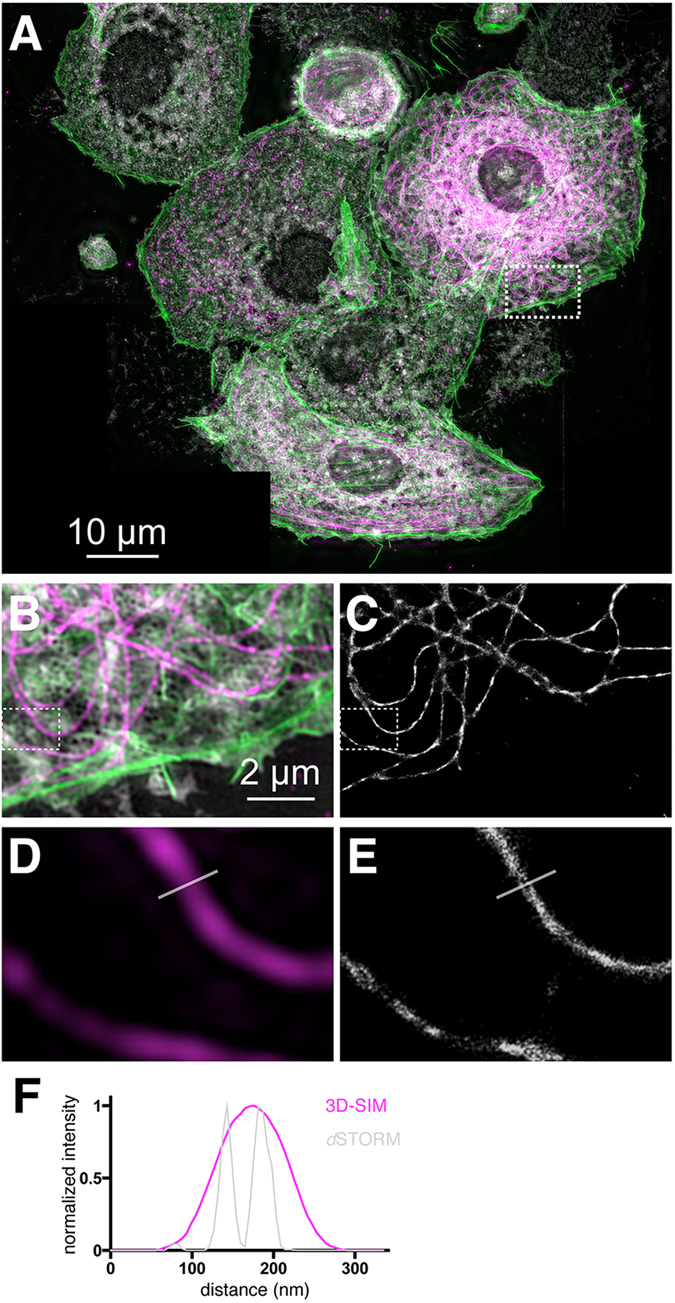
Figure 3
Stitching of multicolor 3D-SIM super-resolution images aids in the search for sieve plates in LSECs.
( A ) Seven multi-color maximum intensity z-projection 3D-SIM images of LSECs were stitched together to produce a large-scale overview image. The fixed rat LSECs were stained for membranes (CellMask O...
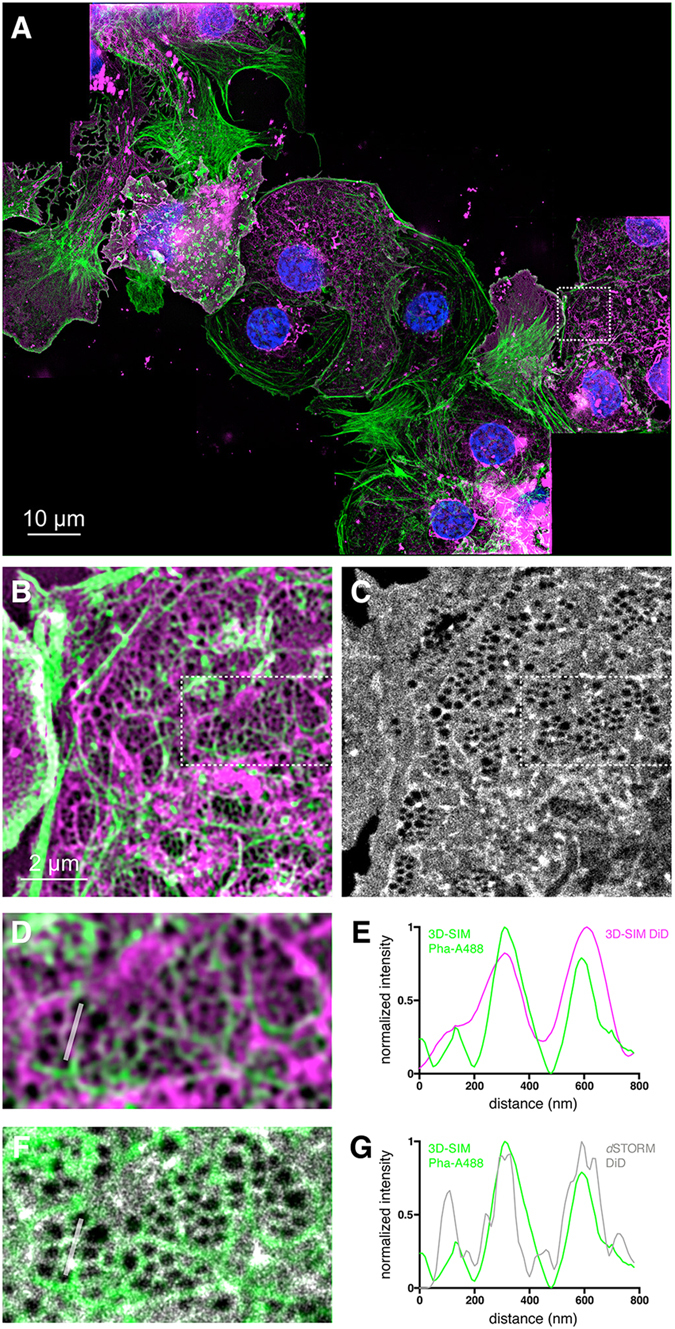
Figure 4
Comparison of cellular features imaged by different super-resolution microscopy modalities.
( A ) Nine multi-color maximum intensity z-projection 3D-SIM images of fixed rat LSECs were stitched together to produce this overview image. The cells were stained for nuclei (DAPI, blue), actin (Pha...
Figure images are served from the NIH/NLM PubMed Central Open Access Subset or Europe PMC; copyright remains with the publishers and authors.
💬 Discussion
0 commentsNo comments yet. Be the first to start a discussion!
Leave a Comment