Abstract
While calcium imaging has become a mainstay of modern neuroscience, the spectral properties of current fluorescent calcium indicators limit deep-tissue imaging as well as simultaneous use with other probes. Using two monomeric near-infrared (NIR) fluorescent proteins (FPs), we engineered an NIR Förster resonance energy transfer (FRET)-based genetically encoded calcium indicator (iGECI). iGECI exhibits high levels of brightness and photostability and an increase up to 600% in the fluorescence response to calcium. In dissociated neurons, iGECI detects spontaneous neuronal activity and electrically and optogenetically induced firing. We validated the performance of iGECI up to a depth of almost 400 µm in acute brain slices using one-photon light-sheet imaging. Applying hybrid photoacoustic and fluorescence microscopy, we simultaneously monitored neuronal and hemodynamic activities in the mouse brain through an intact skull, with resolutions of ~3 μm (lateral) and ~25-50 μm (axial). Using two-photon imaging, we detected evoked and spontaneous neuronal activity in the mouse visual cortex, with fluorescence changes of up to 25%. iGECI allows biosensors and optogenetic actuators to be multiplexed without spectral crosstalk.
🔬 Techniques
🔭 Microscopes
🧬 Organisms
💻 Software
✨ Fluorophores
🧪 Sample Preparation
🔬 Cell Lines
🏭 Microscope Brands
🧪 Reagent Suppliers
📷 Detectors
🔎 Objectives
🎨 Filters
💻 Software Details
🏛️ Research Organizations (ROR)
Affiliated research institutions:
📋 Methods
Design of bacterial and mammalian plasmids. Truncated version of miRFP670 (deletion of 13 N-terminal amino acids, miRFP670Δ13N) and miRFP720 (deletion of 17 N-terminal amino acids, miRFP720Δ17N) were PCR amplified from pmiRFP670-C1 13 and pmiRFP720-C1 17 plasmids. A calmodulin-M13 (CaM-M13) sensing module was PCR amplified from pYC3.6-C1 plasmid (Addgene #67899). A NIR-GECO1 gene was PCR amplified from pDuEx2-NIR-GECO1 (Addgene #113680) 16 . A plasmid pUCmini-iCAP-PHP.eB encoding modified AAV2/9 capsid was kindly provided by V. Gradinaru (California Institute of Technology, Addgene #103005). A pHelper plasmid was from AAV-Helper Free System kit (Agilent #240071). For bacterial expression of GECI variants, pBAD/HisD vector (Life Technologies/Invitrogen) was used. Mammalian expression plasmids were based on a pEGFP-N1 vector (Clontech) with a standard CMV promoter. For expression in dissociated neurons and live mice iGECIs or NIR-GECO1 genes were cloned into pAAV-CW3SL-EGFP (Addgene #61463) instead of EGFP. Molecular evolution of iGECI. DNA fragments encoding miRFP670Δ13N, CaM-M13 and miRFP720Δ17N were PCR amplified and ligated into pEGFP-N1 vector. After rational designing of L1 and L2 linkers, the promising variant was cloned into pBAD/His-D vector and subjected to random mutagenesis and screening in E.coli . BL21 AI host (ThermoFisher Scientific) containing a pWA23h plasmid encoding heme oxygenase (HO) for BV synthesis in E.coli 39 , was electroporated with library DNA, grown overnight in LB medium containing 0.02% rhamnose and 0.05% arabinose for induction of HO and iGECI synthesis, respectively. Library of clones was sorted with FACS, using double positive gating for eliminating non-fluorescent clones resulting from stop-codons and frame shifts. Pre-sorted library was plated on Petri dishes containing 0.02% rhamnose and 0.05% arabinose. Dishes were incubated overnight at 37°C, then for 12 h at 30°C, and for 24 h at 18°C. Colonies were transferred to nitrocellulose membranes and permeabilized by spraying with Ca 2+ -free solution (30 mM MOPS, pH 7.5, 100 mM KCl, 50 μg/ml poly-L-lysine, 50 μg/ml ionomycin). Membranes were incubated for 5 min, and basal fluorescence in the donor (ex. 605 nm, em. 680 nm) and FRET (ex. 605 nm, em. 720 nm) channels was acquired using an IVIS instrument (Perkin Elmer/Caliper Life Sciences). Then membranes were treated by spraying with high Ca 2+ solution (30 mM MOPS, pH 7.5, 100 mM KCl, 50 μg/ml poly-L-lysine, 50 μg/ml ionomycin, 100 mM CaCl 2 ), incubated for 5 min, and Ca 2+ -loaded state of fluorescence was recorded using the same filter sets. Data were analyzed using Living Image v.3.0 software (Perkin Elmer/Caliper Life Sciences). Clones with the best Ca 2+ -loaded/basal fluorescence ratio were subjected to the next step of screening. They were transferred to 5 ml LB liquid culture in 24 deep-well plates containing 0.02% rhamnose and incubated for 8 h at 37°C on a rotating shaker. Then arabinose was added to 0.05%, temperature decreased to 30°C, and the cultures were incubated overnight. Next morning the temperature was changed to 18°C and the cultures were incubated for 24 h. Then the bacterial cultures were lysed with B-PER (ThermoFisher Scientific) and pelleted. Supernatants were transferred to 96-well plates and divided, one part was loaded with 1 mM CaCl 2 , another one with 2 mM EGTA. Fluorescence in the donor (ex. 605 nm, em. 680 nm) and FRET (ex. 605 nm, em. 720 nm) channels was acquired using the IVIS instrument. The best performing clones were re-cloned into a mammalian expression vector and evaluated in HeLa cell lysates. HeLa cells were transiently transfected using Effectene (Qiagen), 48 h after transfection cells were harvested and lysed with M-PER (ThermoFisher Scientific). Lysates were clarified by spinning and divided in two samples, one part was loaded with 1 mM CaCl 2 , another one with 2 mM EGTA. Fluorescence spectra were recorded with the FluoroMax-3 spectrofluorometer. The best performing clones were subjected to a new round of L1 and L2 evolution in E.coli and HeLa cells. About 4000 clones were analyzed in each round of screening. Lastly, we performed mutagenesis of a L3 linker between CaM and M13 peptide by introducing a modification similar to YC-Nano140 18 . Then we introduced the mutation in CaM sequence, reverting glutamic acid to glutamine and making all four Ca 2+ -binding EF-hand active, similar to YC2.6 8 . Then, we added two glycine residues and a serine, similar to YC-Nano15, which showed the highest ΔF/F in HeLa cells. Protein purification and in vitro characterization. iGECIs with polyhistidine tags on the N-terminus were expressed in BL21 AI host (Life Technologies/Invitrogen) containing a pWA23h plasmid. Bacteria were grown in LB medium supplemented with ampicillin, kanamycin, and 0.02% rhamnose for 6–8 h, followed by an induction of the protein expression by adding 0.05% arabinose. The proteins were purified using a Ni-NTA agarose (Qiagen). For absorbance measurements, a Hitachi U-2000 spectrophotometer was used. Fluorescence spectra in the range of 660–780 nm were recorded with the FluoroMax-3 spectrofluorometer. Ca 2+ titrations were carried out using EGTA-buffered Ca 2+ solutions (Calcium Calibration Buffer Kit, Life Technologies). We prepared buffers by mixing a Ca-EGTA buffer and an EGTA buffer to give free Ca 2+ concentrations ranging from zero to 39 μM at 25°C. Fluorescence intensities were plotted against Ca 2+ concentrations and fitted by a double sigmoidal binding function to determine K d . To measure Ca 2+ transitions evoked by histamine, HeLa cells were transiently transfected with iGECI1.0 using Effectene (Qiagen) and cultured 48 h. Then the medium was changed to Live cell imaging solution (Life Technologies/Invitrogen), supplemented with 1 mM CaCl 2 , 100 mM KCl and 1 mM D-glucose, and basal fluorescence in the donor (ex. 605 nm, em. 680/20 nm) and FRET channels (ex. 605 nm, em. 725/40 nm) was recorded. Time-lapse imaging was performed using an Olympus IX81 inverted epifluorescence microscope, equipped with a 200 W Xenon lamp (Sutter Instruments) and a 60× 1.35 NA oil immersion objective lens (UPlanSApo, Olympus). The microscope was operated with a SlideBook v.6.0.8 software (Intelligent Imaging Innovations). Histamine solution was added to the cells to a final concentration of 100 μM and fluorescence was recorded for 10 min. After that, the imaging solution with calcium and histamine was replaced by a Ca 2+ -free imaging solution, and cells were incubated for 5 min equilibrate calcium. Then, an imaging solution containing 2 mM EDTA was added to the cells and fluorescence was recorded for another 5 min. Solution changes were done using MPII peristaltic pump perfusion system (Warner Instruments).
Show full methods section
Design of bacterial and mammalian plasmids. Truncated version of miRFP670 (deletion of 13 N-terminal amino acids, miRFP670Δ13N) and miRFP720 (deletion of 17 N-terminal amino acids, miRFP720Δ17N) were PCR amplified from pmiRFP670-C1 13 and pmiRFP720-C1 17 plasmids. A calmodulin-M13 (CaM-M13) sensing module was PCR amplified from pYC3.6-C1 plasmid (Addgene #67899). A NIR-GECO1 gene was PCR amplified from pDuEx2-NIR-GECO1 (Addgene #113680) 16 . A plasmid pUCmini-iCAP-PHP.eB encoding modified AAV2/9 capsid was kindly provided by V. Gradinaru (California Institute of Technology, Addgene #103005). A pHelper plasmid was from AAV-Helper Free System kit (Agilent #240071). For bacterial expression of GECI variants, pBAD/HisD vector (Life Technologies/Invitrogen) was used. Mammalian expression plasmids were based on a pEGFP-N1 vector (Clontech) with a standard CMV promoter. For expression in dissociated neurons and live mice iGECIs or NIR-GECO1 genes were cloned into pAAV-CW3SL-EGFP (Addgene #61463) instead of EGFP. Molecular evolution of iGECI. DNA fragments encoding miRFP670Δ13N, CaM-M13 and miRFP720Δ17N were PCR amplified and ligated into pEGFP-N1 vector. After rational designing of L1 and L2 linkers, the promising variant was cloned into pBAD/His-D vector and subjected to random mutagenesis and screening in E.coli . BL21 AI host (ThermoFisher Scientific) containing a pWA23h plasmid encoding heme oxygenase (HO) for BV synthesis in E.coli 39 , was electroporated with library DNA, grown overnight in LB medium containing 0.02% rhamnose and 0.05% arabinose for induction of HO and iGECI synthesis, respectively. Library of clones was sorted with FACS, using double positive gating for eliminating non-fluorescent clones resulting from stop-codons and frame shifts. Pre-sorted library was plated on Petri dishes containing 0.02% rhamnose and 0.05% arabinose. Dishes were incubated overnight at 37°C, then for 12 h at 30°C, and for 24 h at 18°C. Colonies were transferred to nitrocellulose membranes and permeabilized by spraying with Ca 2+ -free solution (30 mM MOPS, pH 7.5, 100 mM KCl, 50 μg/ml poly-L-lysine, 50 μg/ml ionomycin). Membranes were incubated for 5 min, and basal fluorescence in the donor (ex. 605 nm, em. 680 nm) and FRET (ex. 605 nm, em. 720 nm) channels was acquired using an IVIS instrument (Perkin Elmer/Caliper Life Sciences). Then membranes were treated by spraying with high Ca 2+ solution (30 mM MOPS, pH 7.5, 100 mM KCl, 50 μg/ml poly-L-lysine, 50 μg/ml ionomycin, 100 mM CaCl 2 ), incubated for 5 min, and Ca 2+ -loaded state of fluorescence was recorded using the same filter sets. Data were analyzed using Living Image v.3.0 software (Perkin Elmer/Caliper Life Sciences). Clones with the best Ca 2+ -loaded/basal fluorescence ratio were subjected to the next step of screening. They were transferred to 5 ml LB liquid culture in 24 deep-well plates containing 0.02% rhamnose and incubated for 8 h at 37°C on a rotating shaker. Then arabinose was added to 0.05%, temperature decreased to 30°C, and the cultures were incubated overnight. Next morning the temperature was changed to 18°C and the cultures were incubated for 24 h. Then the bacterial cultures were lysed with B-PER (ThermoFisher Scientific) and pelleted. Supernatants were transferred to 96-well plates and divided, one part was loaded with 1 mM CaCl 2 , another one with 2 mM EGTA. Fluorescence in the donor (ex. 605 nm, em. 680 nm) and FRET (ex. 605 nm, em. 720 nm) channels was acquired using the IVIS instrument. The best performing clones were re-cloned into a mammalian expression vector and evaluated in HeLa cell lysates. HeLa cells were transiently transfected using Effectene (Qiagen), 48 h after transfection cells were harvested and lysed with M-PER (ThermoFisher Scientific). Lysates were clarified by spinning and divided in two samples, one part was loaded with 1 mM CaCl 2 , another one with 2 mM EGTA. Fluorescence spectra were recorded with the FluoroMax-3 spectrofluorometer. The best performing clones were subjected to a new round of L1 and L2 evolution in E.coli and HeLa cells. About 4000 clones were analyzed in each round of screening. Lastly, we performed mutagenesis of a L3 linker between CaM and M13 peptide by introducing a modification similar to YC-Nano140 18 . Then we introduced the mutation in CaM sequence, reverting glutamic acid to glutamine and making all four Ca 2+ -binding EF-hand active, similar to YC2.6 8 . Then, we added two glycine residues and a serine, similar to YC-Nano15, which showed the highest ΔF/F in HeLa cells. Protein purification and in vitro characterization. iGECIs with polyhistidine tags on the N-terminus were expressed in BL21 AI host (Life Technologies/Invitrogen) containing a pWA23h plasmid. Bacteria were grown in LB medium supplemented with ampicillin, kanamycin, and 0.02% rhamnose for 6–8 h, followed by an induction of the protein expression by adding 0.05% arabinose. The proteins were purified using a Ni-NTA agarose (Qiagen). For absorbance measurements, a Hitachi U-2000 spectrophotometer was used. Fluorescence spectra in the range of 660–780 nm were recorded with the FluoroMax-3 spectrofluorometer. Ca 2+ titrations were carried out using EGTA-buffered Ca 2+ solutions (Calcium Calibration Buffer Kit, Life Technologies). We prepared buffers by mixing a Ca-EGTA buffer and an EGTA buffer to give free Ca 2+ concentrations ranging from zero to 39 μM at 25°C. Fluorescence intensities were plotted against Ca 2+ concentrations and fitted by a double sigmoidal binding function to determine K d . To measure Ca 2+ transitions evoked by histamine, HeLa cells were transiently transfected with iGECI1.0 using Effectene (Qiagen) and cultured 48 h. Then the medium was changed to Live cell imaging solution (Life Technologies/Invitrogen), supplemented with 1 mM CaCl 2 , 100 mM KCl and 1 mM D-glucose, and basal fluorescence in the donor (ex. 605 nm, em. 680/20 nm) and FRET channels (ex. 605 nm, em. 725/40 nm) was recorded. Time-lapse imaging was performed using an Olympus IX81 inverted epifluorescence microscope, equipped with a 200 W Xenon lamp (Sutter Instruments) and a 60× 1.35 NA oil immersion objective lens (UPlanSApo, Olympus). The microscope was operated with a SlideBook v.6.0.8 software (Intelligent Imaging Innovations). Histamine solution was added to the cells to a final concentration of 100 μM and fluorescence was recorded for 10 min. After that, the imaging solution with calcium and histamine was replaced by a Ca 2+ -free imaging solution, and cells were incubated for 5 min equilibrate calcium. Then, an imaging solution containing 2 mM EDTA was added to the cells and fluorescence was recorded for another 5 min. Solution changes were done using MPII peristaltic pump perfusion system (Warner Instruments).
Photobleaching measurements of iGECI and NIR-GECO1 in live
HeLa cells and in dissociated mouse neurons were performed with the 100× 1.4 NA oil immersion objective lens (UPlanSApo, Olympus), 605/30 nm excitation, and 647 nm longpass emission filters at 14 mW/cm 2 light power density measured at the back aperture of the objective lens (~8.3 W/cm 2 at the specimen plane) and normalized to the efficiency of absorption at 605 nm by each indicator. Brightness comparison of iGECI and NIR-GECO1 was performed in HeLa cells transiently co-transfected with the corresponding calcium indicator and EGFP at 10:1 plasmid ratio. 48 h after transfection, cells were analyzed with BD LSRII flow cytometer using 488 nm and 640 nm excitation lasers and 520/40 nm emission filter for EGFP, and 647 nm longpass edge emission filter. The cells were first gated using the EGFP signal and then NIR fluorescence intensity of the calcium indicators was quantified. The NIR fluorescence intensity was normalized to the efficiency of absorption at 640 nm for each indicator. To study the dependence of brightness on the BV chromophore, saturated 25 μM concentration of exogenous BV was added to cells for 24 h prior to flow cytometry. Flow cytometry gating was performed using intact cells, single cells and live cells. The live cells were further gated in the NIR channel ( Supplementary Fig. 15 ). pH stability was studied using a series of Hydrion buffers (Micro Essential Laboratory) in the presence of either 2 mM EGTA or 1 mM of Ca 2+ . Fluorescence was excited at 620 nm, and emission was recorded at 640–760 nm. The area under the spectra at different pH values was quantified. Preparation of high-titer AAVs. AAV particles were obtained as described 40 . Briefly, plasmid DNA for AAV production was purified with NucleoBond Xtra Maxi EF kit (Macherey-Nagel) and AAV-293T cells (Agilent) were co-transfected with AAV2/9 genome plasmid, pAAV2-CaMKII-iGECI, pAAV2-CaMKII-NIRGECO1 or pAAV2-hSyn1-CheRiff, AVV capsid plasmid pUCmini-iCAP-PHP.eB and pHelper using polyethyleneimine (PEI, Santa Cruz). Cell media was collected 72 h after transfection. 120 h after transfection cells and media were collected and combined with the media collected at 72 h. Cells were harvested by centrifugation and then lysed with a salt-active nuclease (HL-SAN, Arcticzyme). 8% PEG was added to the media, incubated for 2 h on ice and then pelleted. PEG pellet was treated with SAN and combined with lysed cells. Cell suspension was clarified by centrifugation. Supernatant was applied on iodixanol gradient and subjected to ultracentrifugation 2 h 25 min at 350,000 g. Virus fraction was collected, washed and enriched on Amicon 15 100,000 MWCO centrifuge device. Purified virus stored at 4°C. Virus titer was defined by qPCR. Aliquot of virus was consequently treated with DNAse I and proteinase K and then used as a template for qPCR. A NheI digested pAAV2-CaMKII-iGECI plasmid with known concentration was used as a reference. AAV9-CaMKIIa-hChR2(H134R)-EYFP and AAV9-CaMKII-GCaMP6s.WPRE.SV40 were obtained from Addgene. Imaging in dissociated neuron cultures. Neurons were isolated from the hippocampi of postnatal (P0-P1) Swiss-Webster mice using a published protocol 41 and cultured in Neurobasal Plus Medium with B-27 Plus Supplement (Gibco), additional 1 mM GlutaMAX (Gibco), 100 U/ml penicillin and 100 μg/ml streptomycin, on poly-D-lysine (EMD Millipore) coated glass coverslips (thickness 0.13–0.17 mm, diameter 12 mm, ThermoFisher Scientific) at the density of ~70,000 cells per coverslip. Half of the medium was exchanged twice a week. Transfection was performed on DIV10 using Calcium Phosphate Transfection Kit (Invitrogen) and a previously published protocol 42 . For experiments with AAVs, neurons were transduced on DIV7 with 10 9 viral genomes per well (in 24-well plate) and recorded on DIV16–18 at 37°C. Grass S48 stimulator (Grass Instruments) and custom platinum electrodes (0.5 mm diameter) were used for field stimulation (1–160 square pulses per stimulus, 1 ms pulse width, 85 Hz, 50 V). Synaptic transmission inhibitors were applied 43 : 10 μM CNQX (R&D Systems), 10 μM gabazine (SantaCruz Biotechnology), 10 μM R-CPP (Enzo Life Sciences), and 1 μM S-MCPG (Cayman Chemicals). The 617 nm LED (Mightex Systems) was used for fluorescence excitation. The excitation filter was 620/15 nm, with a 640LP dichroic mirror, and the emission filter was 667/30 nm for iGECI and 720/40 nm for NIR-GECO1. The frame rate was 10 Hz for NIR-GECO1 and 5 Hz for iGECI. Fluorescence was recorded using an Orca Flash 4.0LT camera (Hamamatsu), Olympus IX81 microscope, and LUCPlanFLN 20× 0.45 NA air objective lens (Olympus). Light power density at the specimen plane was 1.4 W/cm 2 (6-fold lower than in the photobleaching experiments), and total duration of imaging was less than 0.5 h. Bath solution contained (in mM): 125 NaCl, 2.5 KCl, 1 MgCl 2 , 10 HEPES, 3 CaCl 2 , 30 glucose, pH 7.3, 305–307 mOsm 44 . For experiment with CheRiff, neurons were co-transduced with iGECI AAV and CheRiff AAV and incubated with 25 μM BV and 2 μM all-trans retinal for 3 h before recording. Synaptic activity was blocked by inhibitors, as described before 43 : 10 μM CNQX (R&D Systems), 10 μM gabazine (Santa Cruz Biotechnology), 10 μM R-CPP (Enzo Life Sciences), and 1 μM S-MCPG (Cayman Chemicals). Trains of 2 or 10 pulses of green light (505 nm Mightex Systems LED, 510/20 nm optical filter, 4 ms pulse width, 50 ms interval between pulses, using 3 mW/cm 2 measured at the back aperture of a 40× 0.75 NA UPLFLN dry objective lens) were used for CheRiff activation. The stimulator, camera and LEDs were controlled by Master-8 (AMPI) and MatLab R2018b (MathWorks). Neonatal injections. P2–5 neonates were cryo-anesthetized, mounted on a stereotaxic frame (David Kopf Instruments), and maintained under anesthesia for the duration of the procedure, as described previously 45 . AAV2/9-CaMKII-iGECI (2.5×10 12 vg/ml) was injected into the motor cortex through a pulled glass pipette (100 nl/min, 500 nl) with an UltraMicroPump controller (World Precision Instruments). For experiments using optogenetic stimulation and dual sensor comparison, AAV9-CaMKIIa-hChR2(H134R)-EYFP.WPRE.hGH (3.9×10 12 vg/ml) or AAV9-CaMKII-GCaMP6s.WPRE.SV40 (1×10 12 vg/ml), respectively, were co-injected along with AAV2-CaMKII-iGECI. The pipette was held in place for 5 min after injection ended. Experiments were carried out 2–8 weeks after the injection. Acute brain slice preparation. P16-P55 mice were deeply anesthetized with isoflurane, followed by a transcardial perfusion using ice cold ACSF (artificial cerebrospinal fluid) containing (mM) 127 NaCl, 2.5 KCl, 1.25 NaH 2 PO 4 , 25 NaHCO 3 , 20 glucose, 2 CaCl 2 , and 1 MgCl 2 . Brain was removed, blocked, mounted, and placed into a chamber containing 34°C ACSF oxygenated with 95% O 2 , 5% CO 2 . Coronal 250 μm cortical brain slices were made using a Leica VT1200s vibratome, as previously described 46 , 47 . Slices were transferred to a holding chamber containing 34°C ACSF and recovered for 30 min before being cooled to room temperature (22–24°C). For a subset of experiments, slices were incubated in 25 μM BV (0.1% DMSO, Sigma-Aldrich) for 1–2 h at room temperature. Spectral multiplexing experiments with ChR2 or GCaMP6s were carried out in the presence of 10 μM Gabazine, 10 μM NBQX, 10 μM CPP (Tocris) and 25 μM BV. Scanned oblique plane illumination (SOPi) microscopy. A single objective based light-sheet microscope was modified for iGECI imaging. In the illumination path, a HeNe laser (632.8 nm, HNL100L, Thorlabs) was scanned rapidly with a galvanometer based planar scan mirror (GVSM001, Thorlabs) and an achromatic doublet lens as scan lens (AC254–100A-ML, Thorlabs) to create the light-sheet. A dichroic beam-splitter (Di03-R405/488/532/635-t1, Semrock) and another achromatic doublet lens (AC254–100A-ML, Thorlabs) were used to conjugate the plane containing first galvanometer’s rotation axis onto second galvanometer (QS-12, Nutfield Technology). A telescope formed by two achromatic doublet lenses (AC508–100A-ML, AC508–200A-ML, Thorlabs) conjugated the galvanometer rotation axes to the back focal plane of the main microscope objective (20x, 1 W, XLUMPLFLN20XW, Olympus). A lateral offset in the incident laser beam introduced the desired 45° tilt in the illumination light-sheet in the sample volume. In the detection path, the fluorescence signal reverse traced the same path as the illumination beam until the dichroic beam-splitter followed by a tube lens (AC254–150A-ML) and a microscope objective (20x, 0.75 NA, UPLSAPO20X, Olympus), to form an intermediate image of the illuminated plane. This intermediate image was then magnified and imaged on a scientific CMOS camera (Prime 95B, Photometrics) with the help of a microscope objective (20× 0.45 NA, LUCPLFLN20X, Olympus), a filter (FF01 676/37–25, Semrock) and a tube lens (AC254–150A-ML). Functionally, the first galvanometer scanner provided rapid scanning for light-sheet creation, and the second galvanometer scanner enabled tilt-invariant lateral scan of the oblique light-sheet in the sample volume. For dual biosensor imaging, a dichroic beam splitter (FF495-Di03, Semrock) was used to integrate a blue laser (473 nm, Dragonlasers) in the illumination path for GCaMP6s excitation. For optogenetic stimulation, a blue LED (CREE, 470 nm) was used with a collimating lens and a 500 nm long pass dichroic beam splitter (#69–899, Edmund Optics). The beam splitter was placed between the tube lens and the scan lens of the main microscope objective. Functional light-sheet imaging. Acute brain slices were placed in a chamber containing room temperature ACSF, recirculated at a rate of 1–2 ml/min. A monopolar glass pipette electrode was positioned using a Siskiyou manual manipulator. The electrode was placed within the motor cortex, 200–400 μm away from the imaging region. Electrical stimulation was done with a DS3 isolated current stimulator (Digitimer). Stimulation parameters: 1 mA, 20 Hz, 1 or 10 ms pulse width. Two digital output pins on an Arduino board (UNO Rev3, Arduino) were used to produce TTL compatible trigger signals for electrical stimulation and image acquisition through the camera. Total number of camera trigger signals, start and end of electrical stimulation trigger signal, and the frequency of both trigger signals were controlled through custom C++ code. μManager was used for image acquisition on the camera 48 . For experiments involving optogenetic stimulation, a blue LED (470 nm, CREE) with a current driver circuit was used. This LED was controlled through the same Arduino board, where its pulse width was varied from 100 μs to1 ms. Power was measured at 3.75 mW/cm 2 and maintained constant for all experiments. A custom Matlab GUI was used to control both galvanometer scanners. The sample holder was mounted on a XYZ translation stage (PT3, Thorlabs). A manual manipulator was attached to the main objective arm of the SOPi system. A flip mirror was placed behind the first tube lens of the SOPi setup to visualize electrode placement in bright-field mode prior to functional imaging at 20 fps. Image intensity analysis was carried out using Fiji ROI Manager 4 . Data were analyzed using a custom Matlab script. Traces were converted into -ΔF/F; a 1 s long period immediately prior to electrical or optogenetic stimulation was used to calculate baseline fluorescence. Histology. Mice were deeply anesthetized with isoflurane, followed by a transcardial perfusion using PBS containing 2% paraformaldehyde and 2% glutaraldehyde. Brains were extracted, postfixed for 24 h at 4°C, and sectioned at a thickness of 60 μm on a vibratome (Leica VT1200s). Slices were mounted, dried and coverslipped in glycerol:TBS with Hoechst. Large scale images were acquired on an epifluorescence motorized-stage microscope (Olympus VS120). Confocal images were acquired with a Leica SP5 confocal microscope (Leica Microsystems). Statistical analyses for in vivo experiments. Group statistical analyses were done using GraphPad Prism (GraphPad). For group sizes, both the number of experiments and the number of animals is provided. All data are expressed as mean SEM or individual plots. For two-group comparisons, statistical significance was determined by two-tailed Student’s t-tests. For multiple group comparisons, two-way analysis of variance (ANOVA) tests were used, followed by Bonferroni post hoc comparisons. Pearson regression was used for correlation analyses. p
📊 Figures
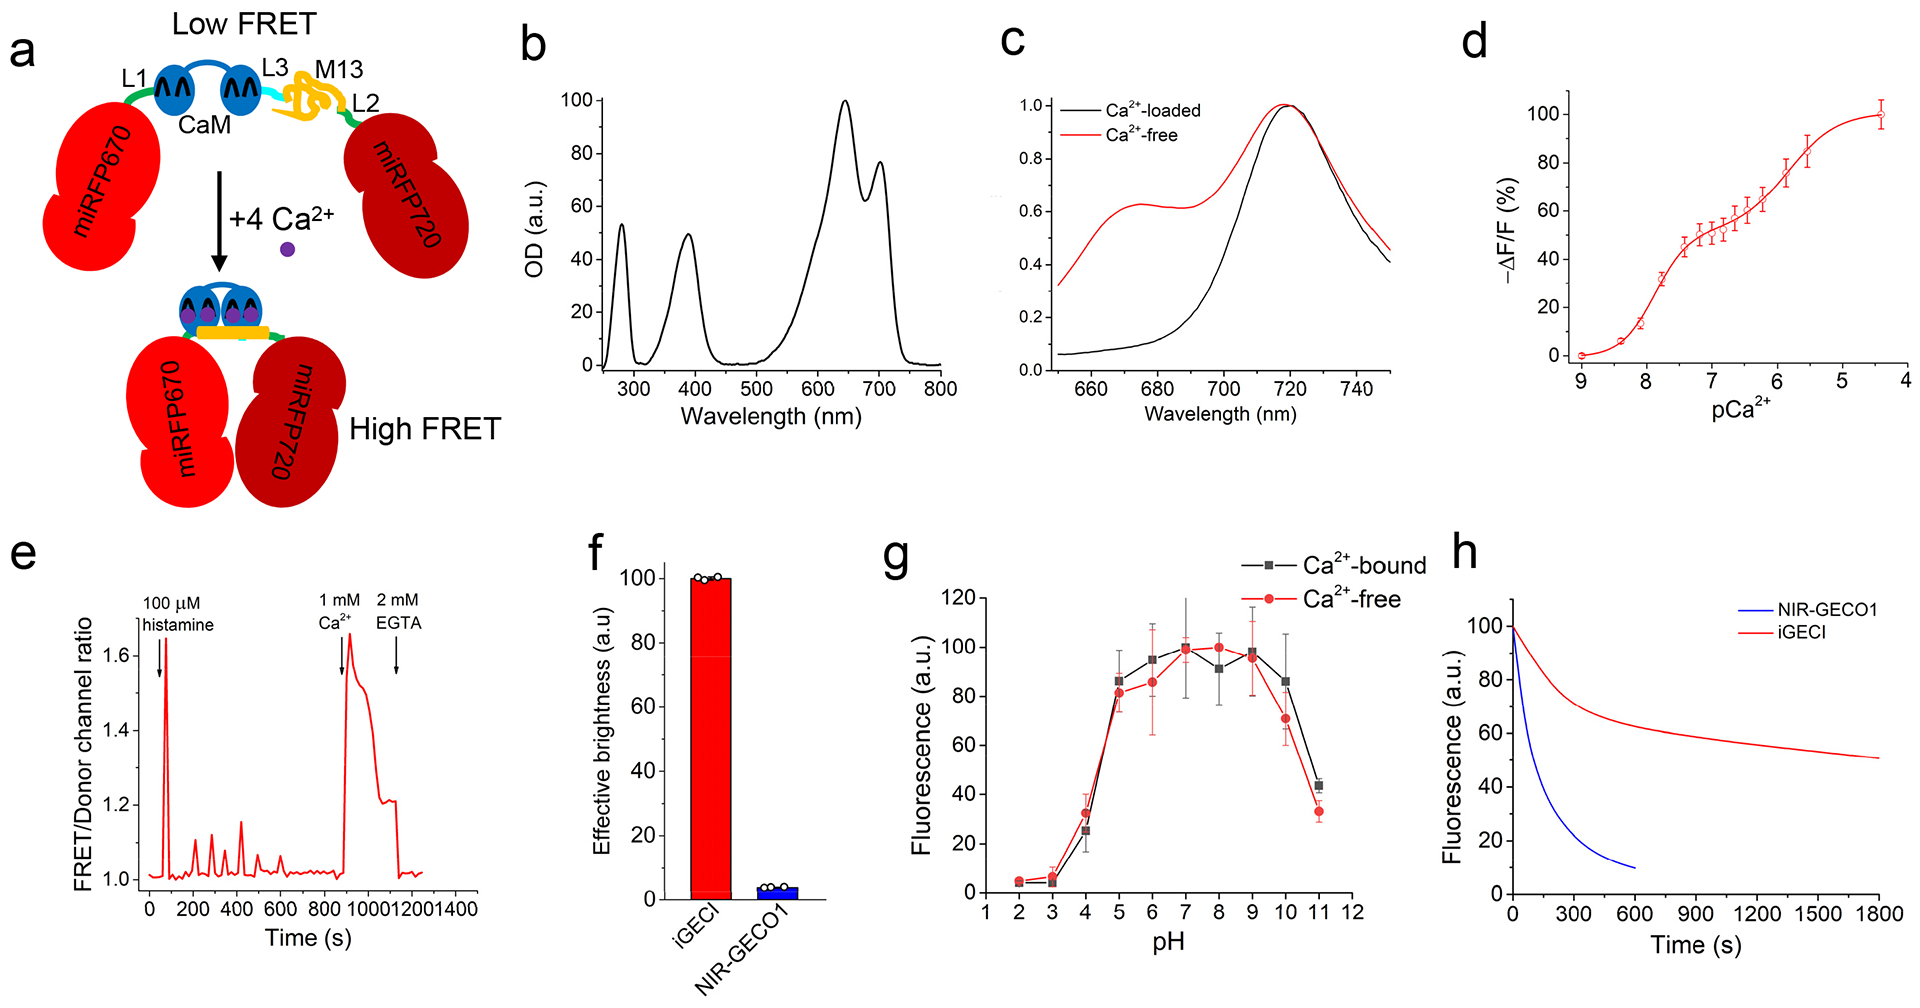
Figure 1.
Characterization of iGECI in vitro and in HeLa cells.
(a) Schematic representation of iGECI and its mechanism of Ca 2+ response. miRFP670, the FRET donor, is colored red; miRFP720, the FRET acceptor, is colored dark-red. Ca 2+ -sensing module is represen...
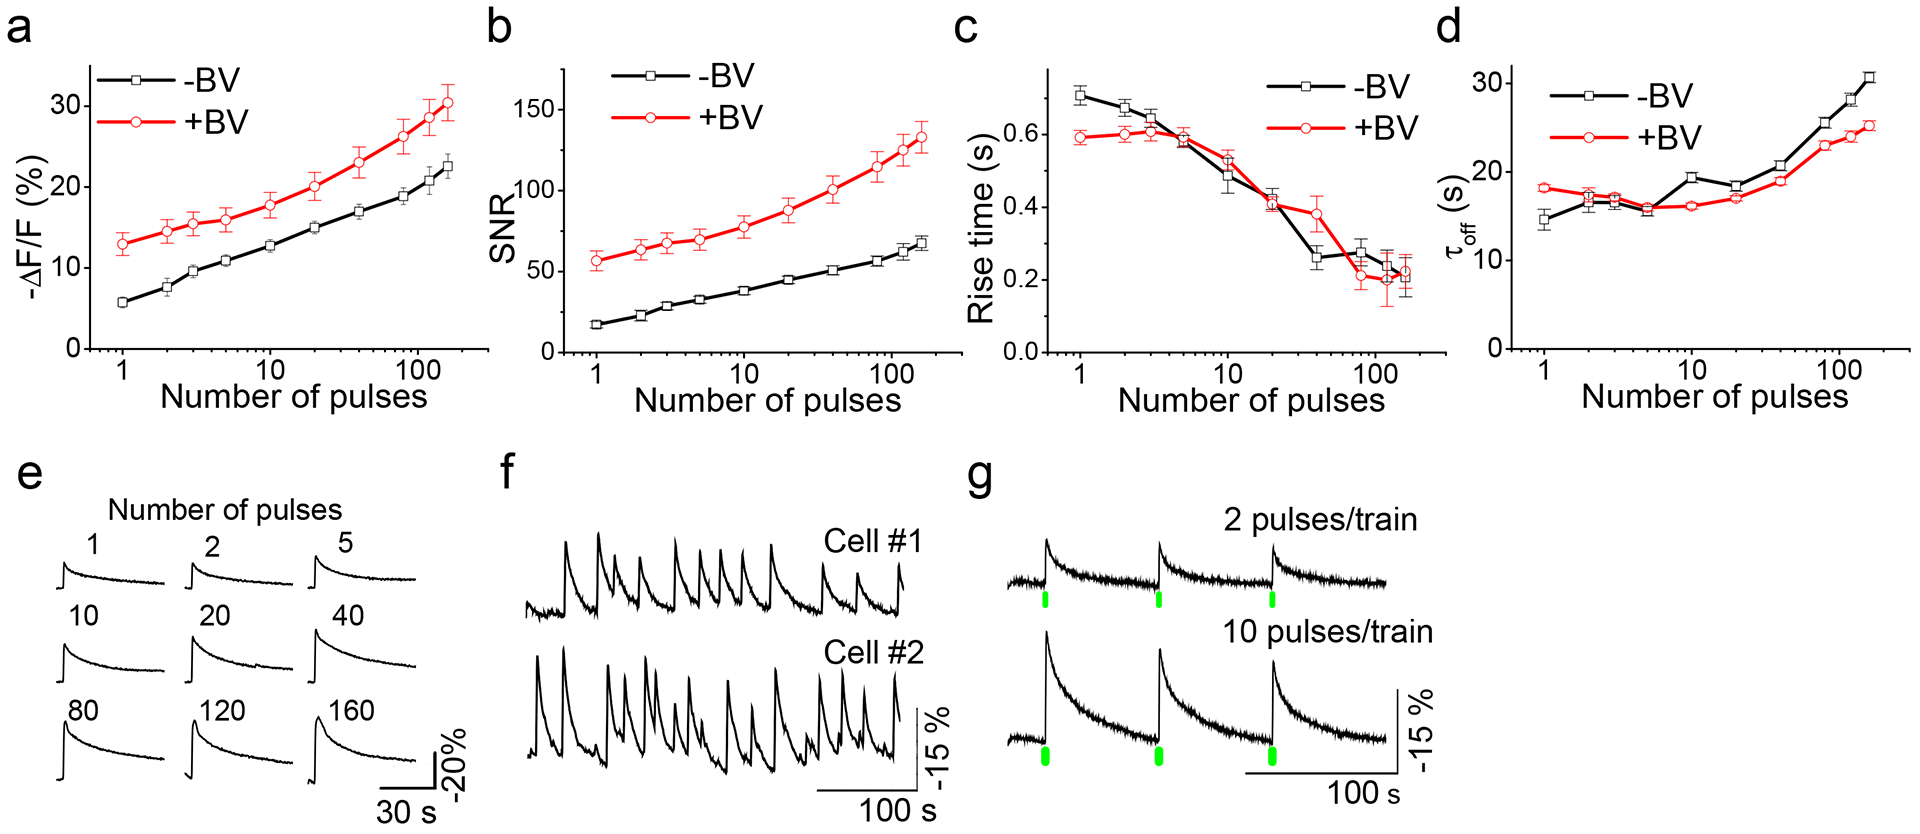
Figure 2.
Characterization of iGECI in dissociated mouse neurons.
( a ) Response amplitudes of iGECI as a function of the number of field stimulation pulses. Spontaneous activity was suppressed by synaptic inhibitors. ( b ) Signal-to-noise ratios. The noise was defi...
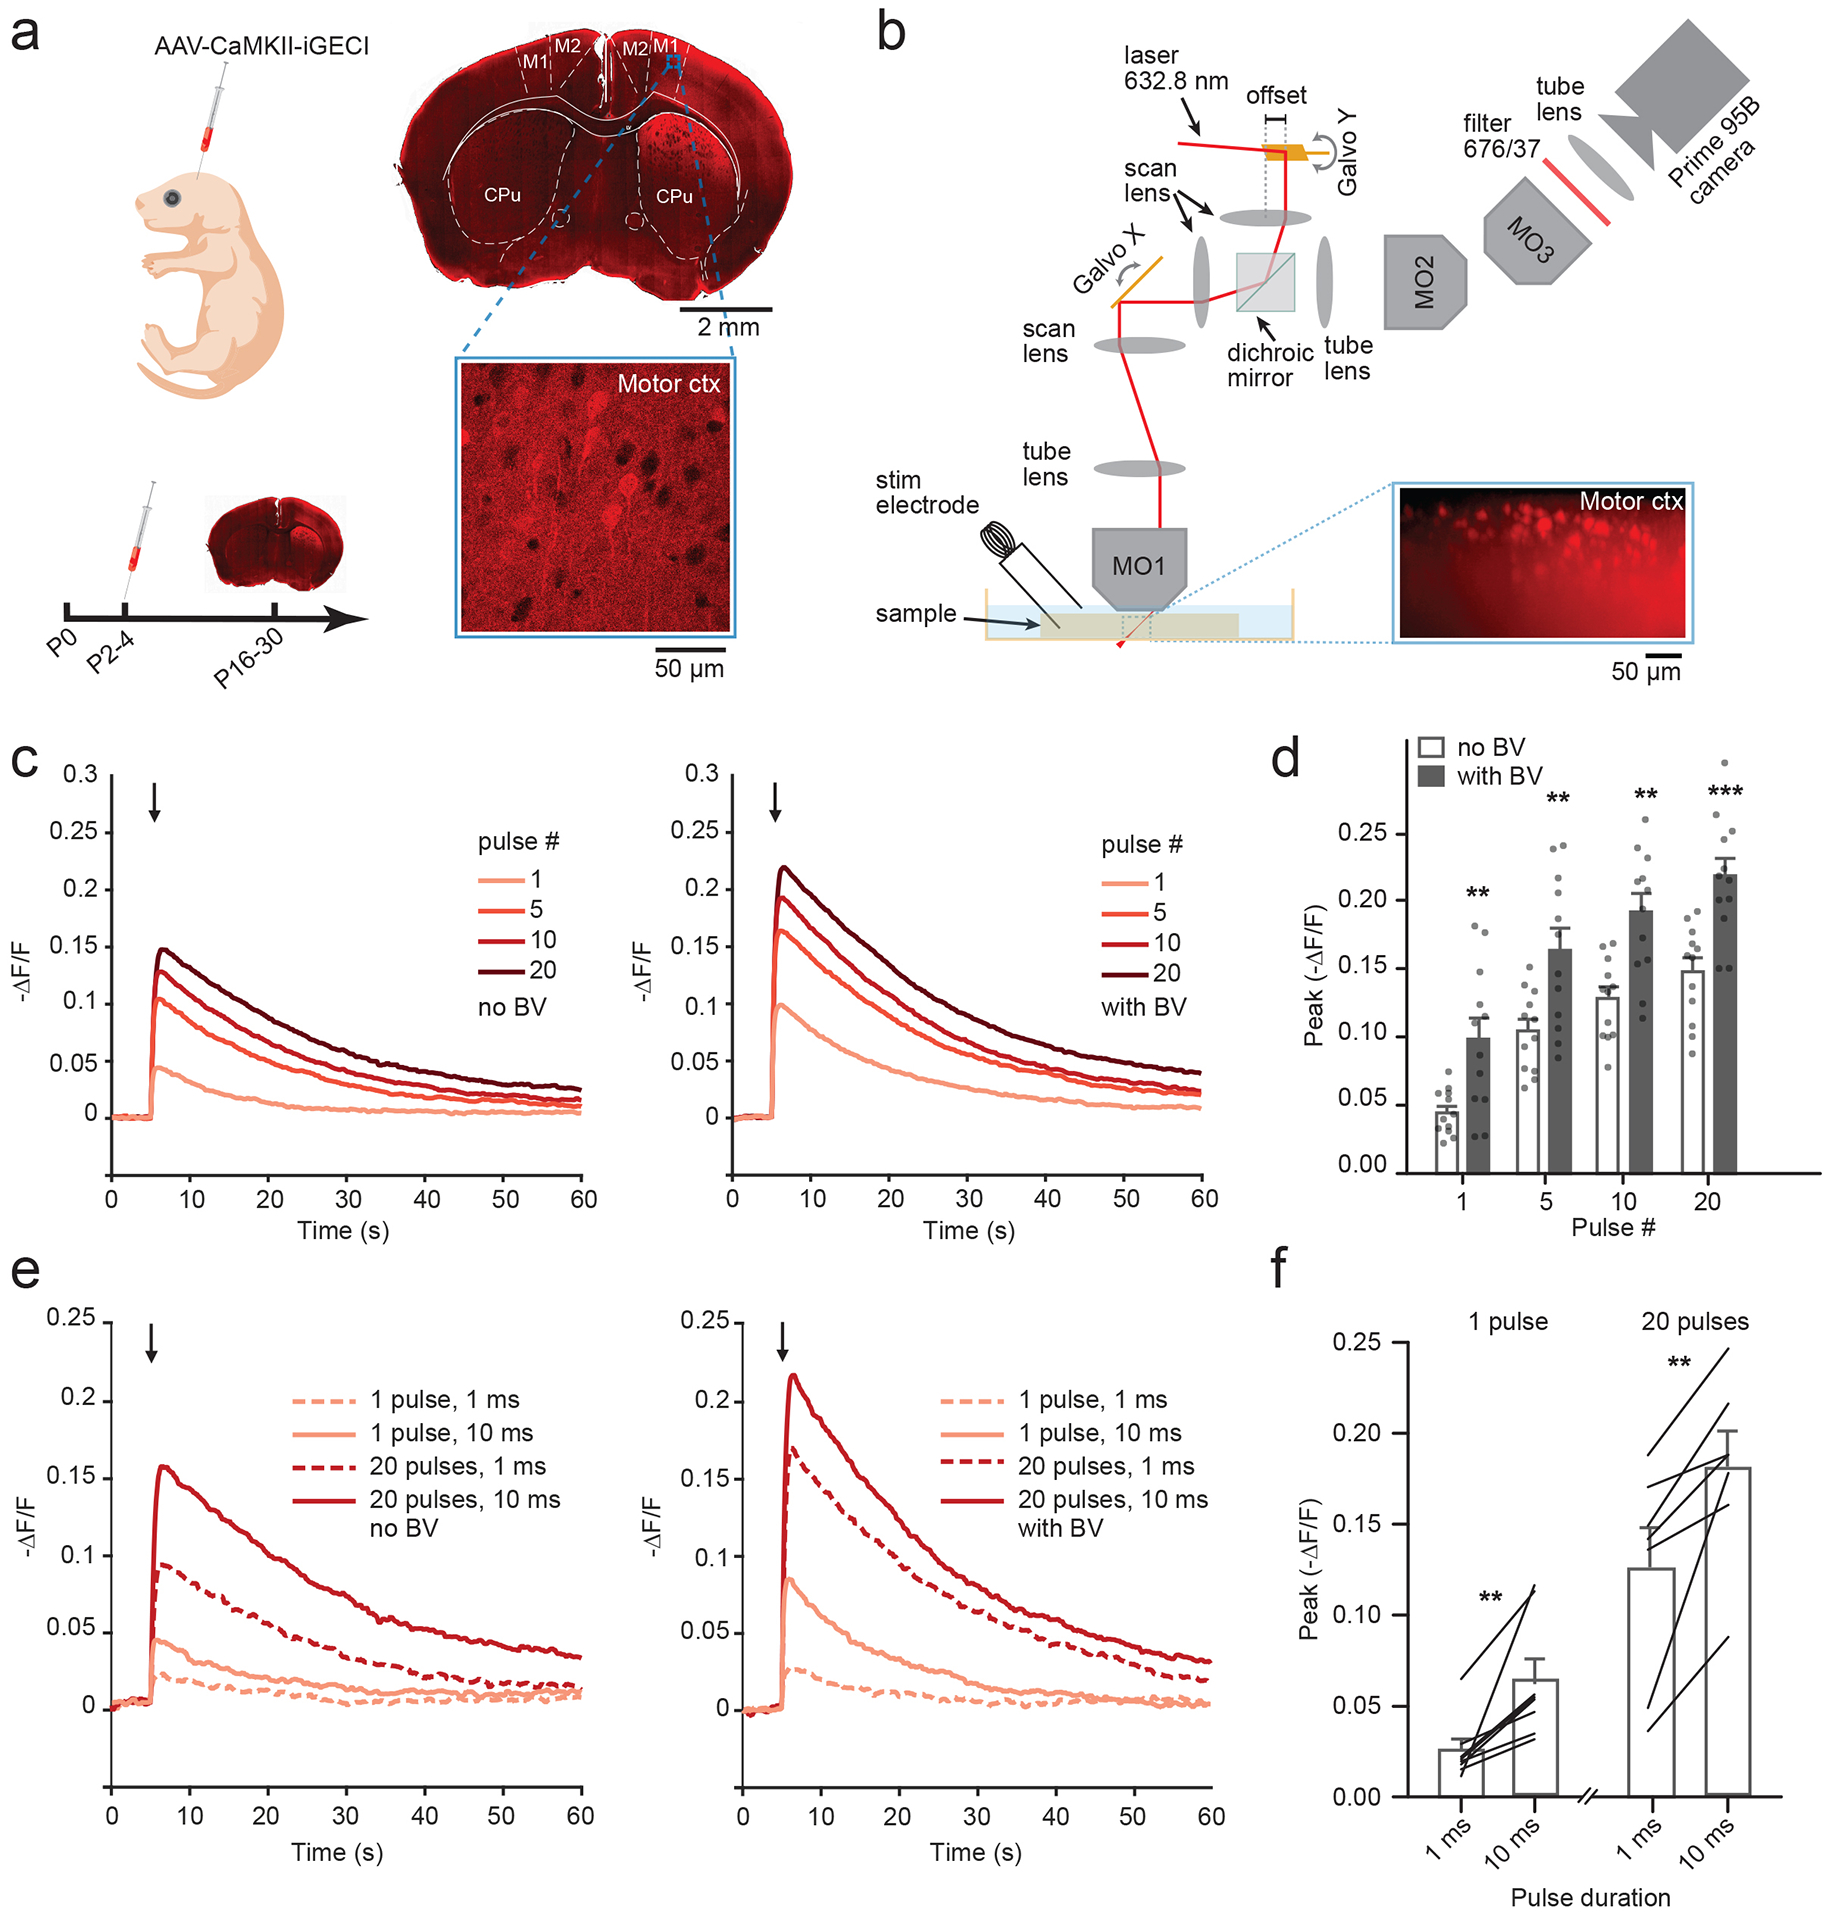
Figure 3.
Oblique light-sheet functional imaging of iGECI in acute brain slices.
( a ) Left , neonatal viral transduction schematic, with experimental timeline. Right , an epifluorescence image of iGECI expression 4 weeks after a unilateral injection. Close up, confocal image of v...
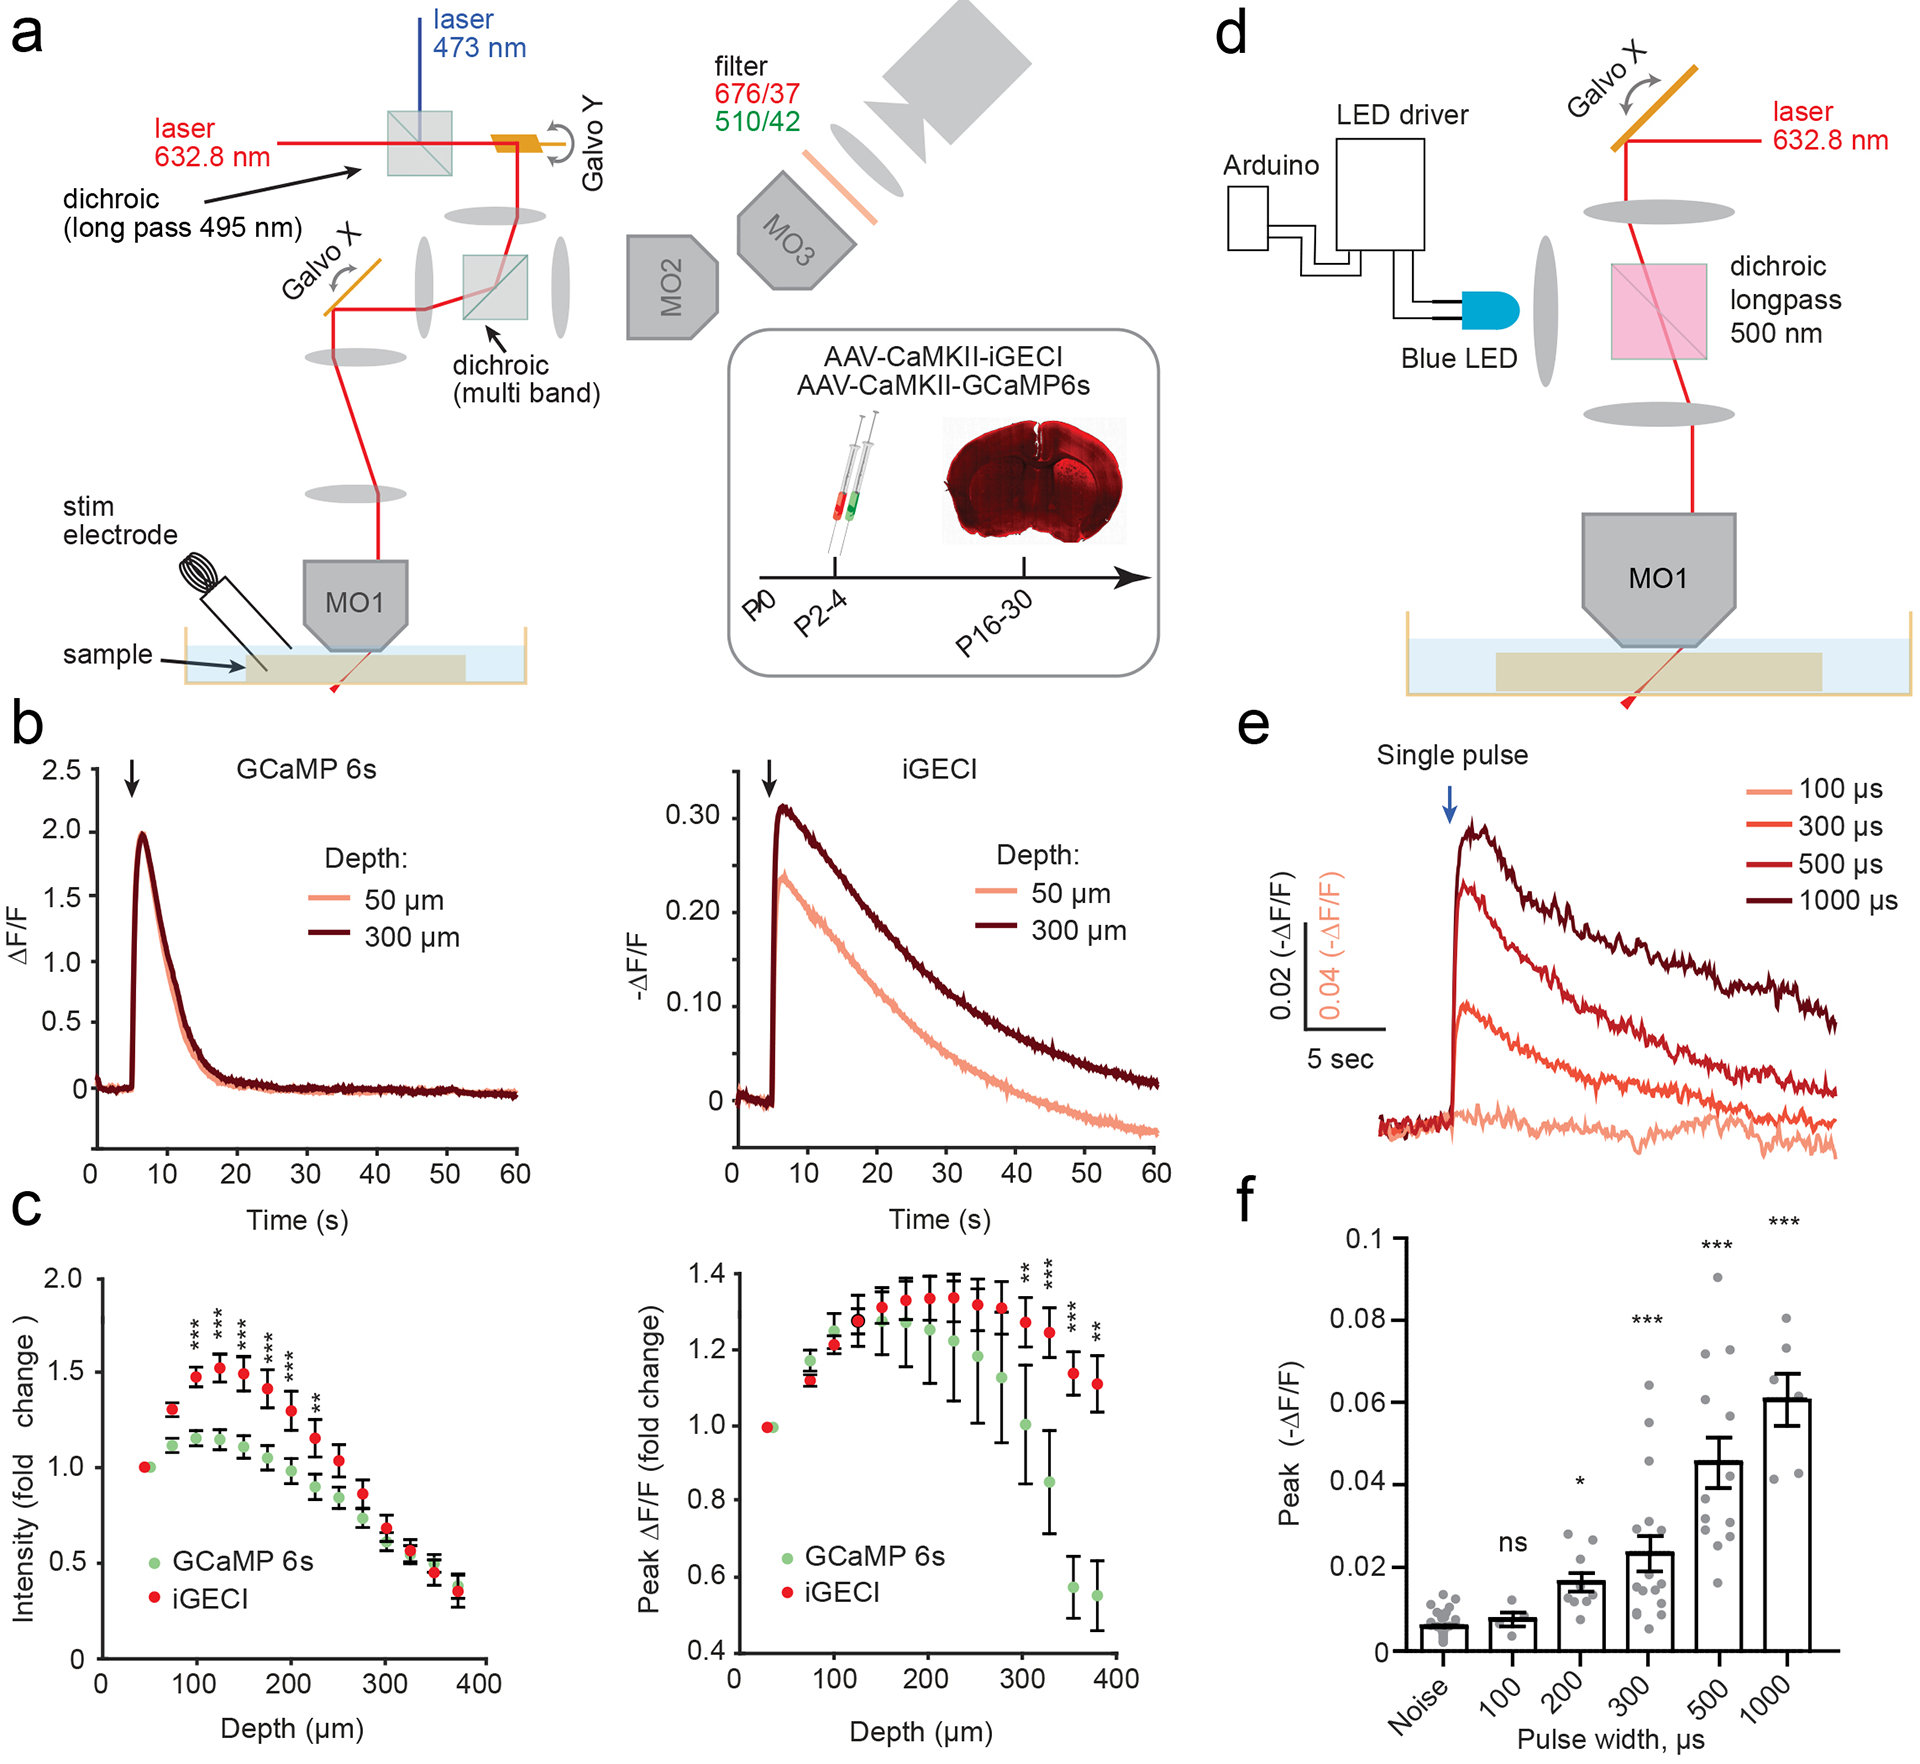
Figure 4.
Spectral multiplexing of iGECI with GCaMP6s or ChR2 optogenetic actuator in acute brain slices.
(a) SOPi imaging system showing modifications for dual sensor imaging. Inset: schematics of AAV injections and experimental timeline. ( b ) Example data from a single experiment using electrical stimu...
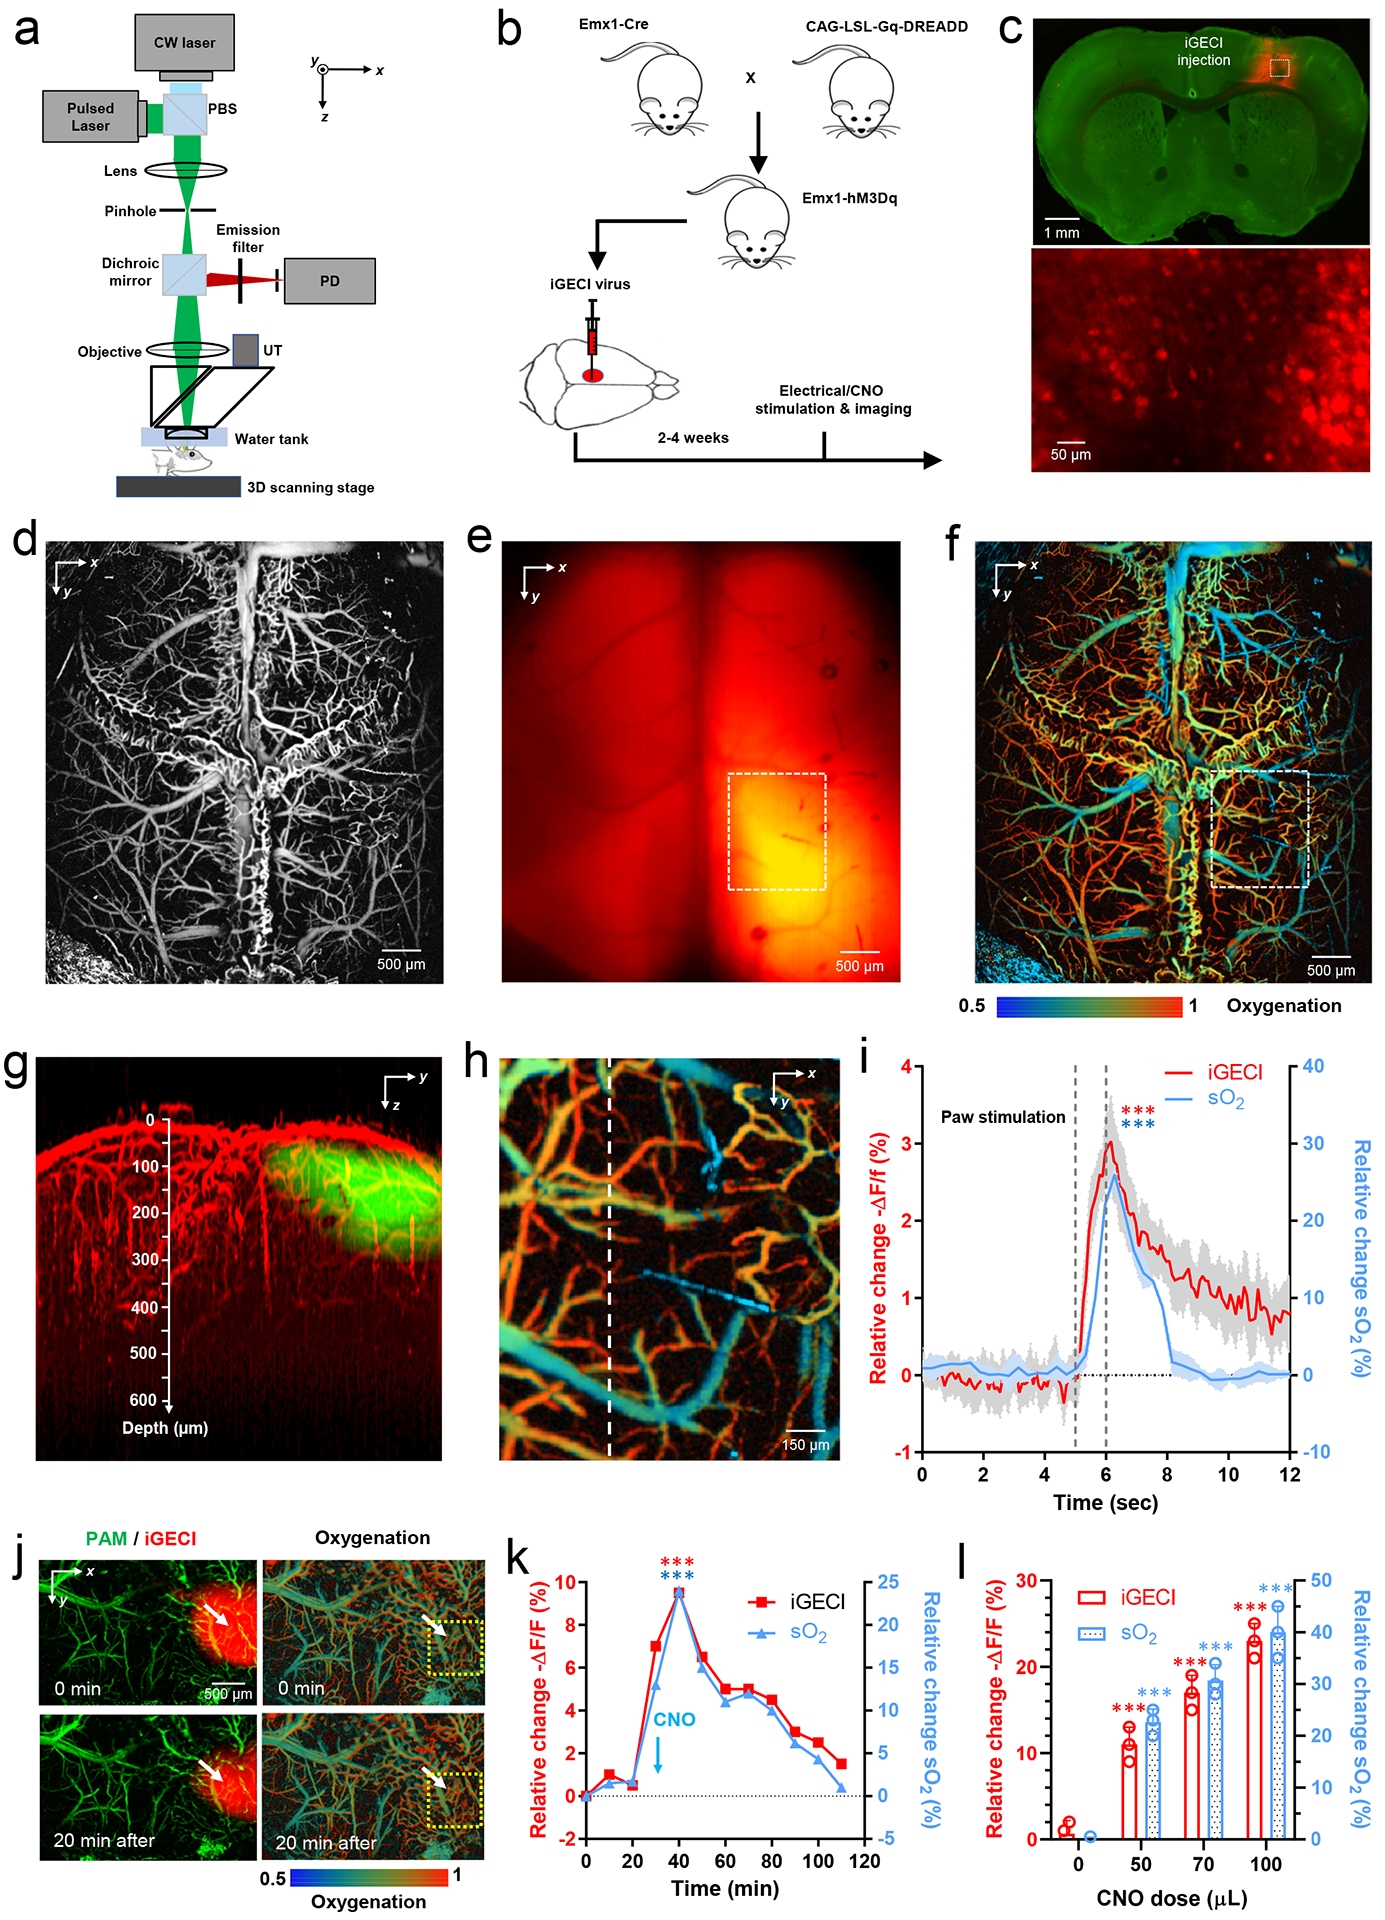
Figure 5.
In vivo imaging of iGECI using hybrid photoacoustic and fluorescence microscopy.
(a) Hybrid photoacoustic and fluorescence microscopy. PBS, polarizing beam splitter; PD, photodiode; UT, ultrasonic transducer. (b) Transgenic mouse cross that expresses an excitatory hM3Dq DREADD in ...
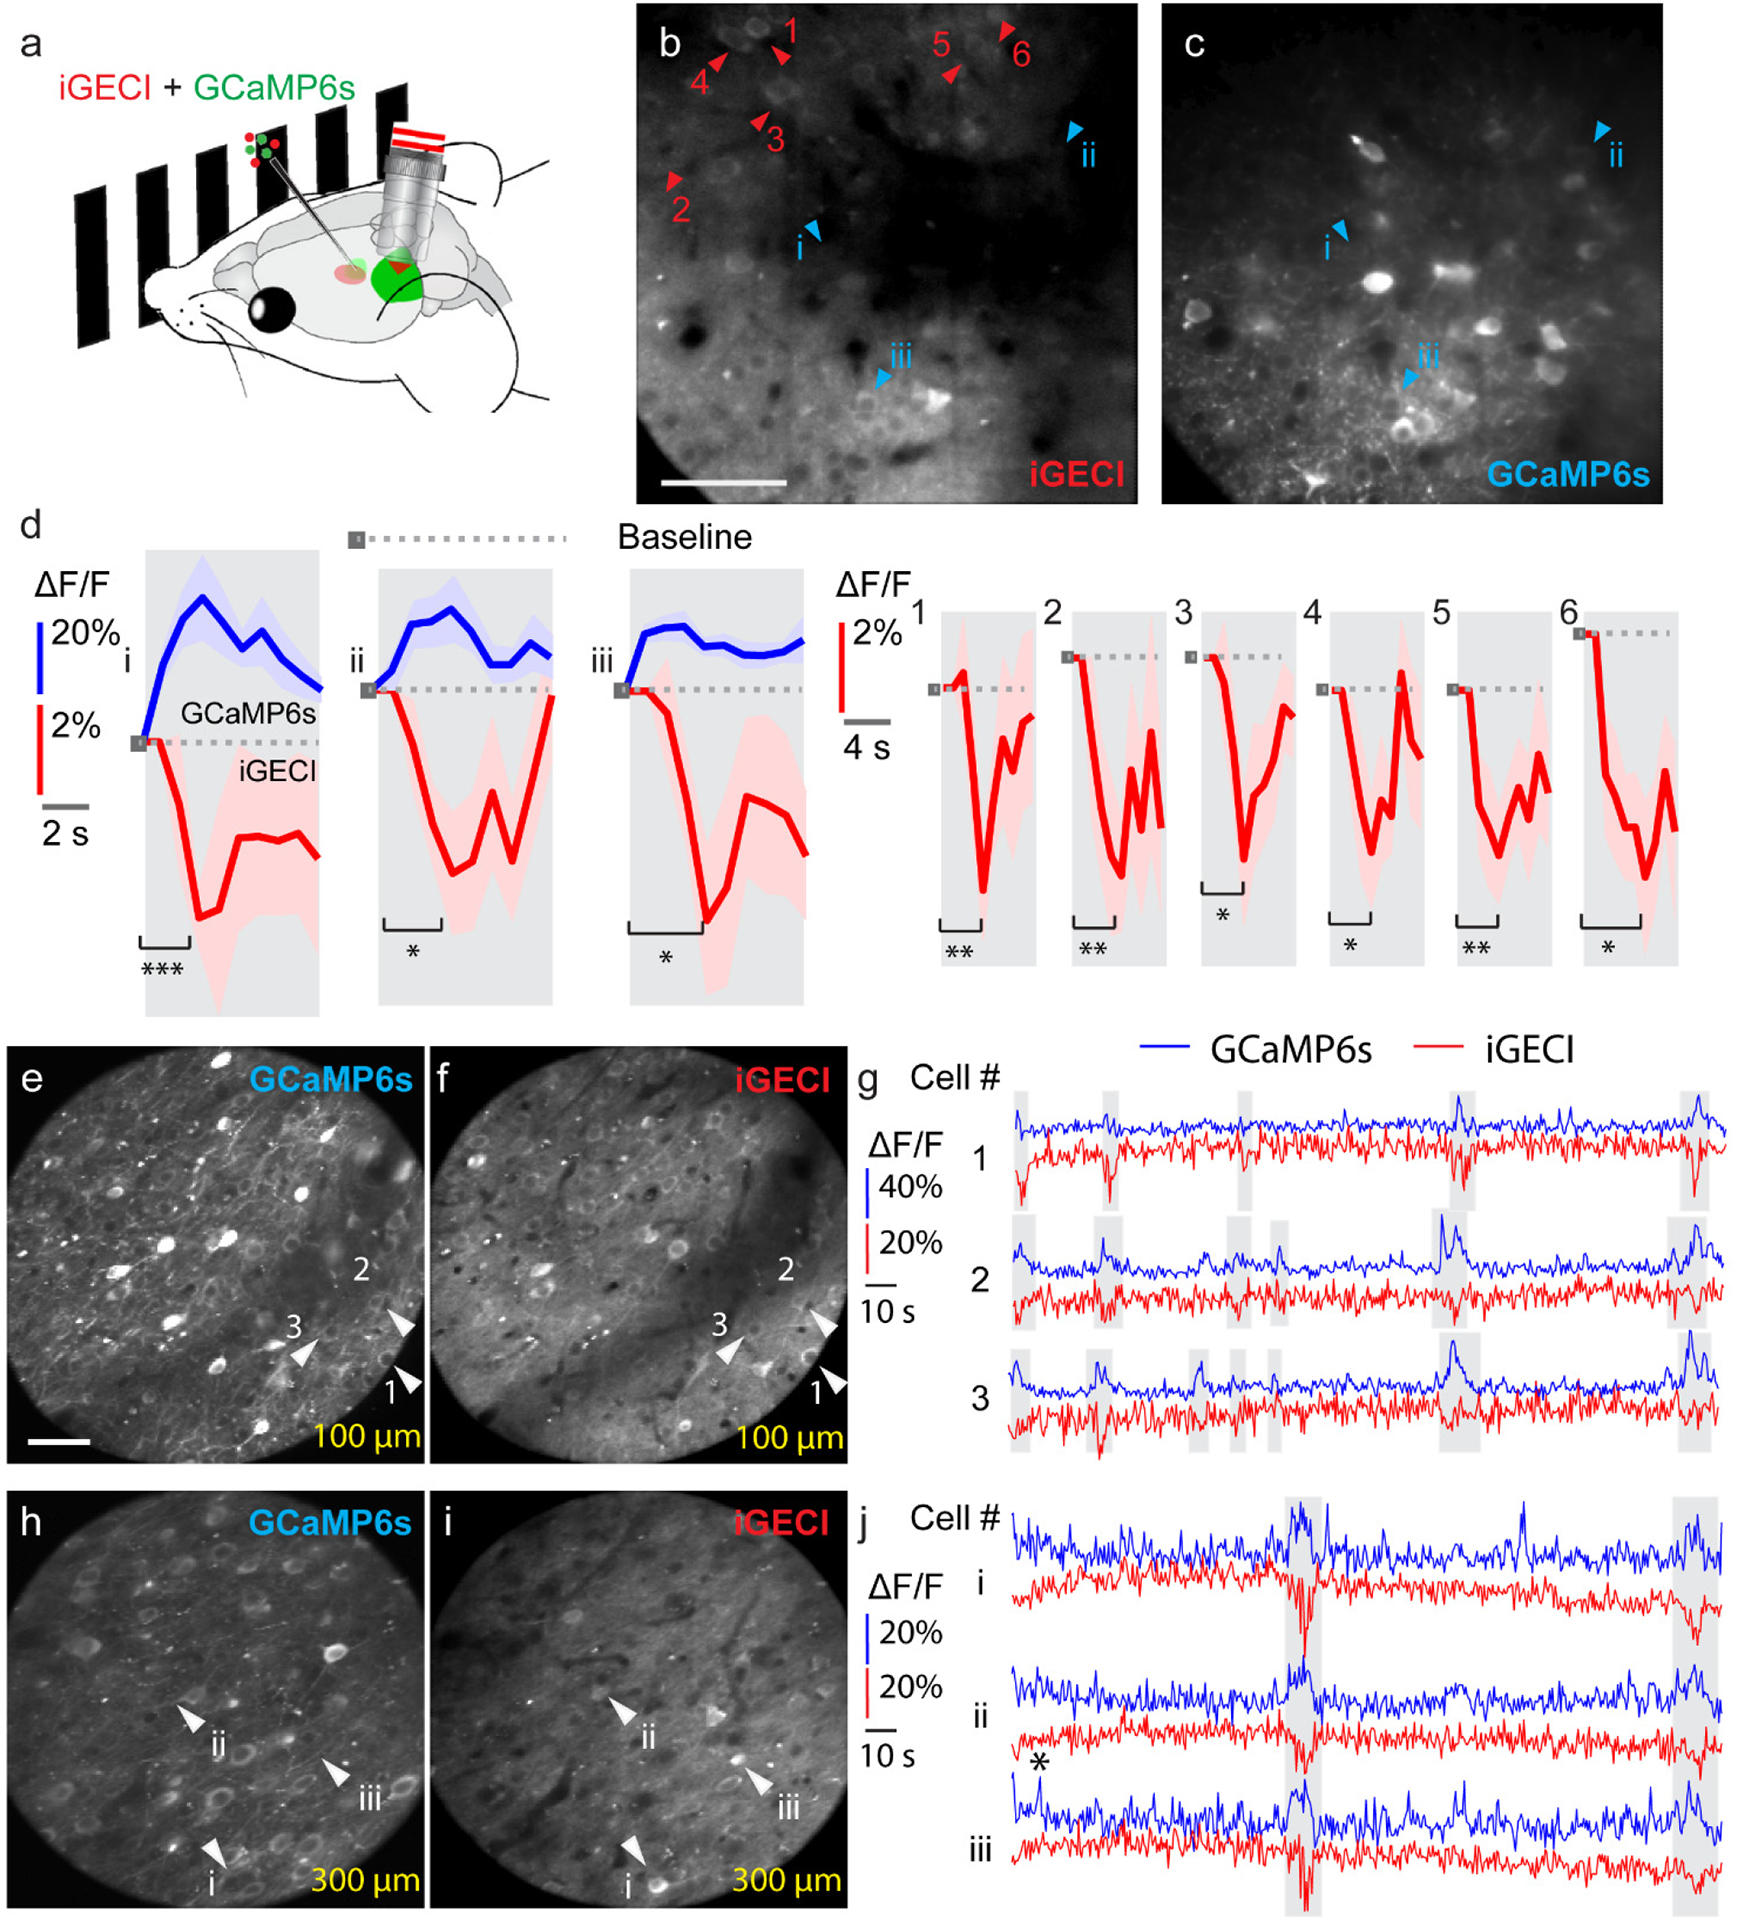
Figure 6.
iGECI reports visually evoked and spontaneous neuronal activity in vivo .
( a ) Schematics of the in vivo calcium imaging experiments with visual stimulation on head-fixed awake mice. ( b, c ) Two-photon fluorescence images (256 u00d7 256 pixels at 1 u03bcm pixel size) of t...
Figure images are served from the NIH/NLM PubMed Central Open Access Subset or Europe PMC; copyright remains with the publishers and authors.
💬 Discussion
0 commentsNo comments yet. Be the first to start a discussion!
Leave a Comment