Abstract
Genetically encoded fluorescent reporters of membrane potential promise to reveal aspects of neural function not detectable by other means. We present a palette of multicoloured brightly fluorescent genetically encoded voltage indicators with sensitivities from 8-13% ΔF/F per 100 mV, and half-maximal response times from 4-7 ms. A fluorescent protein is fused to an archaerhodopsin-derived voltage sensor. Voltage-induced shifts in the absorption spectrum of the rhodopsin lead to voltage-dependent nonradiative quenching of the appended fluorescent protein. Through a library screen, we identify linkers and fluorescent protein combinations that report neuronal action potentials in cultured rat hippocampal neurons with a single-trial signal-to-noise ratio from 7 to 9 in a 1 kHz imaging bandwidth at modest illumination intensity. The freedom to choose a voltage indicator from an array of colours facilitates multicolour voltage imaging, as well as combination with other optical reporters and optogenetic actuators.
🔬 Techniques
🔭 Microscopes
🧬 Organisms
💻 Software
✨ Fluorophores
🧪 Sample Preparation
🔬 Cell Lines
🏭 Microscope Brands
🧪 Reagent Suppliers
🔴 Lasers
📷 Detectors
🔎 Objectives
🎨 Filters
💻 Software Details
💾 Data Repositories
🏛️ Research Organizations (ROR)
Affiliated research institutions:
📋 Methods
Molecular biology Synthetic DNA oligonucleotides were purchased from Integrated DNA Technologies. PfuUltraII polymerase (Agilent Technologies) or Phusion Polymerase (New England Biolabs) were used for high fidelity PCR amplifications in the buffer supplied by the respective manufacturer. PCR products and products of restriction digests were purified either with PCR clean up kit (QIAGEN) or using preparative agarose gel electrophoresis followed by DNA isolation using the Zymoclean gel DNA recovery kit (Zymo Research). Restriction endonucleases were purchased from New England Biolabs and used according to the manufacturer's instructions. Ligations were performed using T4 DNA ligase (Invitrogen) or Gibson Assembly (New England Biolabs). Small-scale isolation of plasmid DNA was performed by plasmid miniprep kit (QIAGEN). The cDNA sequences for all fusion constructs were confirmed by sequencing (Genewiz). Site-directed mutagenesis was performed with QuikChange kit (Agilent Technologies).
Construction of linker libraries
A vector for expression in prokaryotic and eukaryotic systems was constructed based on mammalian expression vector pcDNA3.1 (+). To facilitate prokaryotic expression, a customized constitutive promoter was introduced (ttgctttgtgagcggataacaattataatagattca) based on the phage early T5 promoter for prokaryotic transcription 41 . An E. coli ribosome binding site (aggaggaa) for prokaryotic translation was also introduced via QuikChange reactions. The resultant vector, designated pcDuEx1.0, exhibits moderate expression of Arch-mOrange2 fusions in E. coli cells and very similar expression levels in HeLa cells compared to its predecessor. We used pcDuEx1.0 as the vector for screening of linker libraries. We focused on mOrange2 fusions for determining optimized linker length for FRET efficiency. We chose QuasAr1.2 (Arch D95N/D106H, the best available at the time of the screen) as the Arch body. For construction of QuasAr1.2-mOrange2 Δ0, we fused QuasAr1.2 to the N-terminus of mOrange2 fusion via a 5 residue linker (RPVVA) using overlap PCR. The DNA was PCR amplified with the flanking restriction sites BamHI and XbaI, followed by double digestion and ligation into pcDuEx1.0 linearized by digestion with the same two enzymes. From the template of QuasAr1.2-mOrange2 Δ0, we constructed linker libraries by systematic truncation of the connecting region between QuasAr1.2 and mOrange2 using Quikchange reactions ( Fig. 2 ). For each library, 2 randomized amino acid residues (nucleotide sequence NNKNNK, where N = A, G, C, T and K = G, T) were placed between the C-terminus of Arch and the N-terminus of mOrange2, to generate 400 amino acid combinations (1024 nucleotide combinations). The libraries were cloned into pcDuEx1.0 via standard procedure of restriction enzyme digestion and ligation. Hierarchical screen of linker libraries E. coli (DH10B ™, Invitrogen) colonies expressing the linker library exhibited varied intensities of mOrange2 fluorescence. For each library, the 24 variants with brightest mOrange2 fluorescence were picked and grown in overnight culture at 37 °C. The plasmid DNA of each variant was prepared from overnight culture using standard mini-prep procedure. For each variant, the plasma membrane trafficking was examined in HEK cells (CRL-1573™, ATCC) co-expressing ArcLight, which served as internal reference. The 5 variants with the best membrane trafficking were then expressed in HeLa cells for testing of voltage sensitivity. HeLa cells (CCL2 ™, ATCC) were grown to 40–60% confluence on home-made 35 mm glass bottom dishes or 24-well glass bottom plates, and transfected with 1 μg of plasmid DNA and 2 μL Turbofect (Thermo Scientific) according to the manufacturer's instructions. HeLa cells were transfected with plasmids encoding the QuasAr1.2-mOrange2 variant, ArcLight Q239 (Addgene: 36856) and Kir2.1 (Addgene: 32641) in equal weight ratio. Expression of Kir2.1 in HeLa cells maintained the resting potential close to −60 mV, appropriate for a neuronal voltage indicator 42 . After 3 h incubation, the media was exchanged to DMEM with 10% fetal bovine serum and the cells were incubated for an additional 24 h at 37 °C in a CO 2 incubator. Immediately prior to imaging, cells were washed twice with Hanks balanced salt solution (HBSS) and then 1 mL of 20 mM HEPES buffered HBSS was added. No retinal was added to the buffer--loading of retinal into the rhodopsin was presumed to occur from endogenous retinal. Cell imaging was performed with an inverted Eclipse Ti-E (Nikon) equipped with a Photometrics QuantEM 512SC camera and a 150 W mercury-xenon lamp (Hamamatsu). A home-made parallel platinum electrode pair with a separation distance of 0.5 cm was mounted in a custom plastic support and was placed in the imaging dish or well. The waveforms of voltage pulses were generated by a pulse generator PG 58A (Gould Advance Ltd.) and amplified by an Agilent 6824A 40V/25A DC Power Supply (Hewlett Packard). The typical waveform had square wave pulses lasting 20 ms with pulse field strength ranging from 50 – 60 V cm –1 . The mOrange2 fluorescence was imaged at 100 Hz frame rate in 4×4 binning mode for 10 s using the following filter set: 545/30 nm (excitation), 620/60 nm (emission), and 565 nm (dichroic). For imaging ArcLight, the filter set was: 480/40 nm (excitation), 535/40 nm (emission), and 505 nm (dichroic). The raw fluorescence traces of both mOrange2 and ArcLight were extracted from identical regions of interest in cells expressing both constructs, and exported into a Microsoft Excel spreadsheet using the microscope software NIS-Elements Advanced Research (Nikon). Background subtraction, photobleaching corrections, calculations of average ΔF/F, and calculation of signal-to-noise ratios (SNR) were performed automatically in Excel. The average ΔF/F and SNR of mOrange2 signals was compared to those of ArcLight signals from the same cells, and the ratios of ΔF/F of mOrange2 vs. ArcLight were reported. At least 20 cells co-expressing mOrange2 fusion and ArcLight were analyzed for each variant. The best variant with maximum mean ratio in each library was determined and sequenced. pH-dependent absorption spectrum of QuasAr2 E. coli cells transformed with a pBAD vector encoding QuasAr2 were grown in 12 mL liquid LB medium with 200 μg/mL ampicillin overnight. The next day, 12 mL of liquid LB medium containing 50 μM retinal, 200 μg/mL ampicillin and 0.2% L-arabinose was added into the culture to induce expression of QuasAr2, followed by additional incubation at 37 °C for 3.5 hours. The cell pellets were collected by centrifugation, washed with Tris buffered saline (TBS, 30 mM Tris, 150 mM NaCl, pH 7.4), and lysed with a tip sonicator for 10 min. The cytoplasmic fraction was discarded after centrifugation and the colored insoluble fraction was resuspended in a series of modified TBS buffers (30 mM Tris, 150 mM NaCl, adjusted to the pH value of the spectral measurement) containing 1% n-dodecyl-β-D-maltopyranoside (Affymetrix, Inc.). The suspension was then centrifuged (17,000 g for 15 min, 4 °C). Absorption spectra of QuasAr2 in the supernatant in different pH were recorded on a DU-800 UV-visible spectrophotometer (Beckman). Expression vectors for HEK cells and neurons We chose lentivirus vector FCK-Arch-EGFP (Addgene: 22217) as the backbone for all eFRET constructs. This vector features a CaMKII α promoter and a Woodchuck Hepatitis Virus Posttranscriptional Regulatory Element (WPRE) after the 3' end of the open reading frame. To enhance membrane trafficking of fusion proteins, we added a trafficking signal (TS) and ER export signal peptide sequence (FCYENEV), derived from the inward rectifier potassium channel Kir2.1, as previously described 28 . QuasAr2-FP fusion constructs were made by Gibson Assembly: the vector was linearized by double digestion with BamHI and BsrGI, and QuasAr2 and fluorescent protein cDNA segments were generated by PCR amplification. The linker configuration of all eFRET fusion proteins was constructed based on the optimized linker sequence found by the linker screening. In all eFRET fusion proteins, the N-terminal 2 amino acids of QuasAr2 were changed from DP to VS to facilitate expression, and the C-terminal 14 amino acids of QuasAr2 (APEPSAGADVSAAD) were replaced with a 2-amino acid linker, Leu-Arg (based on the optimized linker sequence found in linker library Δ24), to shorten the distance between QuasAr2 and fluorescent protein. The N-terminal amino acids in the fluorescent proteins were also truncated ( Supplementary Table 3 ). The nucleotide sequences of all constructs are in the Supplementary Note 1 .
Show full methods section
Molecular biology Synthetic DNA oligonucleotides were purchased from Integrated DNA Technologies. PfuUltraII polymerase (Agilent Technologies) or Phusion Polymerase (New England Biolabs) were used for high fidelity PCR amplifications in the buffer supplied by the respective manufacturer. PCR products and products of restriction digests were purified either with PCR clean up kit (QIAGEN) or using preparative agarose gel electrophoresis followed by DNA isolation using the Zymoclean gel DNA recovery kit (Zymo Research). Restriction endonucleases were purchased from New England Biolabs and used according to the manufacturer's instructions. Ligations were performed using T4 DNA ligase (Invitrogen) or Gibson Assembly (New England Biolabs). Small-scale isolation of plasmid DNA was performed by plasmid miniprep kit (QIAGEN). The cDNA sequences for all fusion constructs were confirmed by sequencing (Genewiz). Site-directed mutagenesis was performed with QuikChange kit (Agilent Technologies).
Construction of linker libraries
A vector for expression in prokaryotic and eukaryotic systems was constructed based on mammalian expression vector pcDNA3.1 (+). To facilitate prokaryotic expression, a customized constitutive promoter was introduced (ttgctttgtgagcggataacaattataatagattca) based on the phage early T5 promoter for prokaryotic transcription 41 . An E. coli ribosome binding site (aggaggaa) for prokaryotic translation was also introduced via QuikChange reactions. The resultant vector, designated pcDuEx1.0, exhibits moderate expression of Arch-mOrange2 fusions in E. coli cells and very similar expression levels in HeLa cells compared to its predecessor. We used pcDuEx1.0 as the vector for screening of linker libraries. We focused on mOrange2 fusions for determining optimized linker length for FRET efficiency. We chose QuasAr1.2 (Arch D95N/D106H, the best available at the time of the screen) as the Arch body. For construction of QuasAr1.2-mOrange2 Δ0, we fused QuasAr1.2 to the N-terminus of mOrange2 fusion via a 5 residue linker (RPVVA) using overlap PCR. The DNA was PCR amplified with the flanking restriction sites BamHI and XbaI, followed by double digestion and ligation into pcDuEx1.0 linearized by digestion with the same two enzymes. From the template of QuasAr1.2-mOrange2 Δ0, we constructed linker libraries by systematic truncation of the connecting region between QuasAr1.2 and mOrange2 using Quikchange reactions ( Fig. 2 ). For each library, 2 randomized amino acid residues (nucleotide sequence NNKNNK, where N = A, G, C, T and K = G, T) were placed between the C-terminus of Arch and the N-terminus of mOrange2, to generate 400 amino acid combinations (1024 nucleotide combinations). The libraries were cloned into pcDuEx1.0 via standard procedure of restriction enzyme digestion and ligation. Hierarchical screen of linker libraries E. coli (DH10B ™, Invitrogen) colonies expressing the linker library exhibited varied intensities of mOrange2 fluorescence. For each library, the 24 variants with brightest mOrange2 fluorescence were picked and grown in overnight culture at 37 °C. The plasmid DNA of each variant was prepared from overnight culture using standard mini-prep procedure. For each variant, the plasma membrane trafficking was examined in HEK cells (CRL-1573™, ATCC) co-expressing ArcLight, which served as internal reference. The 5 variants with the best membrane trafficking were then expressed in HeLa cells for testing of voltage sensitivity. HeLa cells (CCL2 ™, ATCC) were grown to 40–60% confluence on home-made 35 mm glass bottom dishes or 24-well glass bottom plates, and transfected with 1 μg of plasmid DNA and 2 μL Turbofect (Thermo Scientific) according to the manufacturer's instructions. HeLa cells were transfected with plasmids encoding the QuasAr1.2-mOrange2 variant, ArcLight Q239 (Addgene: 36856) and Kir2.1 (Addgene: 32641) in equal weight ratio. Expression of Kir2.1 in HeLa cells maintained the resting potential close to −60 mV, appropriate for a neuronal voltage indicator 42 . After 3 h incubation, the media was exchanged to DMEM with 10% fetal bovine serum and the cells were incubated for an additional 24 h at 37 °C in a CO 2 incubator. Immediately prior to imaging, cells were washed twice with Hanks balanced salt solution (HBSS) and then 1 mL of 20 mM HEPES buffered HBSS was added. No retinal was added to the buffer--loading of retinal into the rhodopsin was presumed to occur from endogenous retinal. Cell imaging was performed with an inverted Eclipse Ti-E (Nikon) equipped with a Photometrics QuantEM 512SC camera and a 150 W mercury-xenon lamp (Hamamatsu). A home-made parallel platinum electrode pair with a separation distance of 0.5 cm was mounted in a custom plastic support and was placed in the imaging dish or well. The waveforms of voltage pulses were generated by a pulse generator PG 58A (Gould Advance Ltd.) and amplified by an Agilent 6824A 40V/25A DC Power Supply (Hewlett Packard). The typical waveform had square wave pulses lasting 20 ms with pulse field strength ranging from 50 – 60 V cm –1 . The mOrange2 fluorescence was imaged at 100 Hz frame rate in 4×4 binning mode for 10 s using the following filter set: 545/30 nm (excitation), 620/60 nm (emission), and 565 nm (dichroic). For imaging ArcLight, the filter set was: 480/40 nm (excitation), 535/40 nm (emission), and 505 nm (dichroic). The raw fluorescence traces of both mOrange2 and ArcLight were extracted from identical regions of interest in cells expressing both constructs, and exported into a Microsoft Excel spreadsheet using the microscope software NIS-Elements Advanced Research (Nikon). Background subtraction, photobleaching corrections, calculations of average ΔF/F, and calculation of signal-to-noise ratios (SNR) were performed automatically in Excel. The average ΔF/F and SNR of mOrange2 signals was compared to those of ArcLight signals from the same cells, and the ratios of ΔF/F of mOrange2 vs. ArcLight were reported. At least 20 cells co-expressing mOrange2 fusion and ArcLight were analyzed for each variant. The best variant with maximum mean ratio in each library was determined and sequenced. pH-dependent absorption spectrum of QuasAr2 E. coli cells transformed with a pBAD vector encoding QuasAr2 were grown in 12 mL liquid LB medium with 200 μg/mL ampicillin overnight. The next day, 12 mL of liquid LB medium containing 50 μM retinal, 200 μg/mL ampicillin and 0.2% L-arabinose was added into the culture to induce expression of QuasAr2, followed by additional incubation at 37 °C for 3.5 hours. The cell pellets were collected by centrifugation, washed with Tris buffered saline (TBS, 30 mM Tris, 150 mM NaCl, pH 7.4), and lysed with a tip sonicator for 10 min. The cytoplasmic fraction was discarded after centrifugation and the colored insoluble fraction was resuspended in a series of modified TBS buffers (30 mM Tris, 150 mM NaCl, adjusted to the pH value of the spectral measurement) containing 1% n-dodecyl-β-D-maltopyranoside (Affymetrix, Inc.). The suspension was then centrifuged (17,000 g for 15 min, 4 °C). Absorption spectra of QuasAr2 in the supernatant in different pH were recorded on a DU-800 UV-visible spectrophotometer (Beckman). Expression vectors for HEK cells and neurons We chose lentivirus vector FCK-Arch-EGFP (Addgene: 22217) as the backbone for all eFRET constructs. This vector features a CaMKII α promoter and a Woodchuck Hepatitis Virus Posttranscriptional Regulatory Element (WPRE) after the 3' end of the open reading frame. To enhance membrane trafficking of fusion proteins, we added a trafficking signal (TS) and ER export signal peptide sequence (FCYENEV), derived from the inward rectifier potassium channel Kir2.1, as previously described 28 . QuasAr2-FP fusion constructs were made by Gibson Assembly: the vector was linearized by double digestion with BamHI and BsrGI, and QuasAr2 and fluorescent protein cDNA segments were generated by PCR amplification. The linker configuration of all eFRET fusion proteins was constructed based on the optimized linker sequence found by the linker screening. In all eFRET fusion proteins, the N-terminal 2 amino acids of QuasAr2 were changed from DP to VS to facilitate expression, and the C-terminal 14 amino acids of QuasAr2 (APEPSAGADVSAAD) were replaced with a 2-amino acid linker, Leu-Arg (based on the optimized linker sequence found in linker library Δ24), to shorten the distance between QuasAr2 and fluorescent protein. The N-terminal amino acids in the fluorescent proteins were also truncated ( Supplementary Table 3 ). The nucleotide sequences of all constructs are in the Supplementary Note 1 .
Two-photon lifetime measurements to determine FRET efficiency
We measured fluorescence lifetime on a homebuilt beam-scanning two-photon microscope with an 80 MHz, 100 fs tunable pulsed laser (SpectraPhysics Insight DeepSee). Pulse compression in the sample plane was performed through maximizing the fluorescence intensity of a bead-sample, using the motorized prism compressor built into the laser. The citrine measurements were performed at 1040 nm excitation wavelength with a time-averaged excitation power of 30 mW, or 0.4 nJ per pulse, focused down to a ~500 nm spot with a 1.2 NA water immersion objective (Olympus UplanSapo) for a time-averaged intensity of 15 MW cm −2 ; measurements were performed for linear speeds of the scanned spot varying between 0 and 30 cm s −1 without any measurable effect on fluorescence lifetime. Excitation light and fluorescence were separated using a FF775-Di01 dichroic mirror and FF01-790/SP-25 shortpass filter (Both Semrock); fluorescence was detected using a Hamamatsu R943-02 photomultiplier tube in photon counting mode, cooled to −20 °C. THe PMT signal was amplified through an SRS PR325 amplifier and discretized with a Hamamatsu Photon counting unit C9744, before being fed into a Picoharp 300 TCSPC module (Picoquant). The setup was controlled by Labview software written in-house.
Simultaneous electrophysiology and fluorescence in HEK cells
HEK293t/17 cells (ATCC CRL-11268)were cultured and transfected following standard protocols. Briefly, cells were grown at 37 °C, 5% CO 2 , in DMEM supplemented with 10% FBS and penicillin-streptomycin. Plasmids were transfected using TransIT-293 reagent (Mirus Bio LLC) following the manufacturer's instructions. 24 hours post-transfection, cells were re-plated onto glass-bottom dishes (MatTek) at a density of ~10,000 cells cm −2 . Cells were assayed 40–60 hours post-transfection. Despite the presence of saturating retinal in the culture medium, cells were supplemented with retinal prior to measurement to remove a possible source of variability. Cells were supplemented with retinal by pre-incubating with 5 μM retinal in growth medium (diluted from 40 mM stock solution in DMSO) in the incubator for 0.5 – 1 hour immediately prior to imaging. All imaging and electrophysiology were performed in Tyrode's buffer (containing 125 mM NaCl, 2.5 mM KCl, 3 mM CaCl 2 , 1 mM MgCl 2 , 10 mM HEPES, 30 mM glucose, at pH 7.3, and adjusted to 305–310 mOsm with sucrose). A gap junction blocker, 2-aminoethoxydiphenyl borate (50 μM, Sigma), was added to eliminate electrical coupling between cells. Filamented glass micropipettes (WPI) were pulled to a tip resistance of 5–10 MΩ, and filled with internal solution containing 125 mM potassium gluconate, 8 mM NaCl, 0.6 mM MgCl 2 , 0.1 mM CaCl 2 , 1 mM EGTA, 10 mM HEPES, 4 mM Mg-ATP, 0.4 mM Na-GTP (pH 7.3); adjusted to 295 mOsm with sucrose. Pipettes were positioned with a Sutter MP285 manipulator. Whole-cell, voltage and current clamp recordings were acquired using a patch clamp amplifier (A-M Systems, Model 2400), filtered at 5 kHz with the internal filter and digitized with a National Instruments PCIE-6323 acquisition board at 10 kHz. Simultaneous whole-cell patch clamp recordings and fluorescence recordings were acquired on a home-built, inverted epifluorescence microscope, described below in the section “Imaging Apparatus”.
Neuronal culture and electrophysiology
All procedures involving animals were in accordance with the National Institutes of Health Guide for the care and use of laboratory animals and were approved by the Institutional Animal Care and Use Committee (IACUC) at the institution at which they were carried out. Hippocampal neurons from P0 rat pups were dissected and cultured in neurobasal-based medium (NBActiv4, Brainbits llc.) at a density of 40,000 cm −2 on glass-bottom dishes (MatTek) pre-coated with poly-d-lysine (Sigma P7205) and matrigel (BD biosciences 356234). At 3 days in vitro (DIV), cytarabine was added to the neuronal culture medium at a final concentration of 2 μM to inhibit glial growth 43 . Neurons were transfected on DIV 7 with the eFRET plasmid using Lipofectamine 2000 transfection reagent (Life Technologies). Procedures followed manufacturer's instructions but reduced the amount of reagent by 50–80% to avoid toxicity. Measurements were performed on primary cultures at DIV 10 – 20. Experiments were conducted in Tyrode's solution containing 125 mM NaCl, 2.5 mM KCl, 3 mM CaCl 2 , 1 mM MgCl 2 , 10 mM HEPES, 30 mM glucose (pH 7.3) and adjusted to 305–310 mOsm with sucrose. Immediately prior to imaging, neurons were incubated with 5 μM all- trans retinal in the culture medium for 30 minutes and then washed with Tyrode's solution. Experiments were performed at 23 °C under ambient atmosphere. Imaging apparatus Experiments were conducted on a home-built inverted fluorescence microscope equipped with 488nm, 532nm, 561nm, 594nm, and 640nm laser lines and a scientific CMOS camera (Hamamatsu ORCA-Flash 4.0). The power and manufacturer of laser lines are summarized in Supplementary Table 4 . Illumination from lasers were combined using dichroic mirrors, sent through an acousto-optic tunable filter (AOTF; Gooch and Housego 48058-2.5-.55-5W) for intensity modulation, and then expanded and focused onto the back-focal plane of a 60x water immersion objective, numerical aperture 1.20 (Olympus UIS2 UPlanSApo 60x/1.20 W). Imaging of fluorescent proteins was performed at illumination intensities of 2 – 4 W cm –2 . Imaging of QuasAr2 direct fluorescence was performed at an illumination intensity of 200–400 W cm −2 . Supplementary Table 5 summarizes the laser lines, dichroic mirrors and emission filters used for fluorescence imaging. For fast data acquisition, a small field of view around the cell of interest was chosen at the center of the camera to achieve a frame rate of 1,000 frames per second.
Data analysis
Data was analyzed with homemade software written in MATLAB. Fluorescence intensities from raw movies were extracted using a maximum likelihood pixel weighting algorithm described in Ref. 14 . Briefly, the fluorescence at each pixel was correlated with the mean fluorescence. Pixels that showed stronger correlation to the mean were preferentially weighted. This algorithm automatically found the pixels carrying the most information, and de-emphasized background pixels. Alternatively, a region of interest (ROI) comprising the cell body was defined by the user, and fluorescence intensity was calculated from the unweighted mean of pixel values within the ROI. With the improved trafficking of the QuasAr2 mutants resulting from the TS and ER2 motifs, the ROI approach gave similar results as the maximum likelihood pixel weighting algorithm. For eFRET speed analysis, the time constants for the step response were calculated by fitting a double exponential to the rising and decaying portions of the fluorescence traces. All error ranges represent standard error of the mean.
Supplementary Material 1
📊 Figures
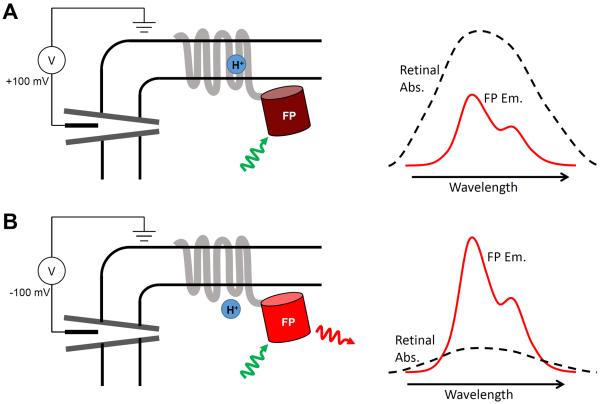
Figure 1
Proposed mechanism of voltage-dependent fluorescence in eFRET GEVIs
Voltage controls the protonation, and thereby the absorption spectrum, of the Schiff base joining the retinal to the protein scaffold. A) At a depolarizing (positive) voltage, the microbial rhodopsin ...
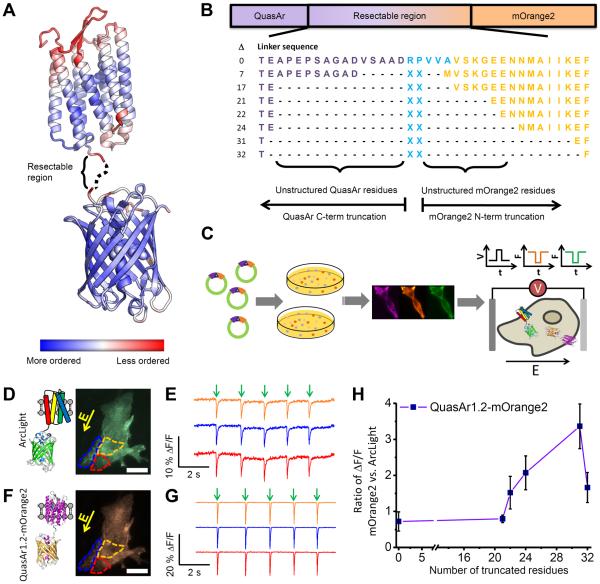
Figure 2
Directed evolution of an eFRET GEVI
A) A model of QuasAr-mOrange2 constructs, represented by the crystal structures of Arch-2 (PDB ID 2EI4) 26 and mOrange (PDB ID 2H5O) 27 . The color scale represents the degree of order in the crystal ...
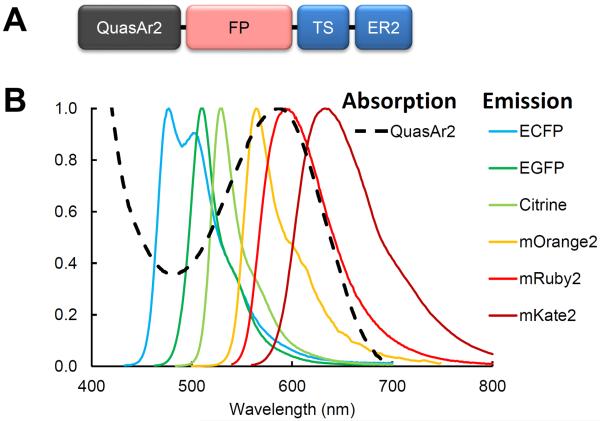
Figure 3
Spectral overlap of fluorescent proteins with QuasAr2 absorption
A) eFRET GEVI domain structure. B) Overlay of the emission spectra of the fluorescent protein donors with the absorption spectrum of the QuasAr2 electrochromic quencher.
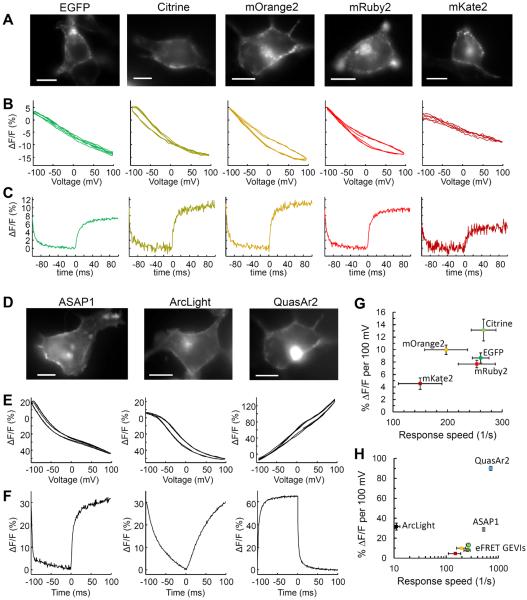
Figure 4
Voltage sensing with GEVIs in HEK293 cells
Voltage response of eFRET GEVI reporters are shown in (Au2013C), and voltage responses of comparison GEVIs are shown in (Du2013F). A) and D) Fluorescence images of HEK cells expressing GEVI reporters....
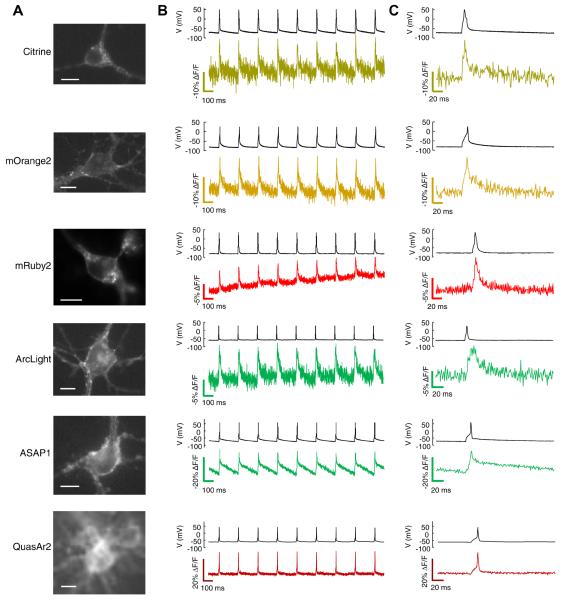
Figure 5
Single-trial recording of neuronal APs with GEVIs
Each GEVI construct was expressed in primary rat hippocampal neurons under a CamKIIu03b1 promoter. Action potentials were induced by current injections through a patch pipette. A) Images of neurons ex...
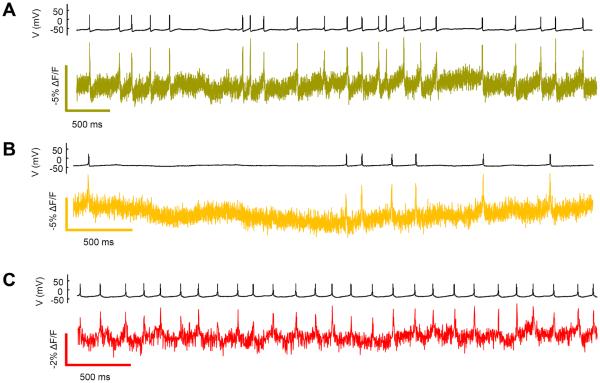
Figure 6
Optical recording of spontaneous neuronal firing with eFRET GEVIs
In neurons synaptically coupled to a spontaneously active circuit, the (A) Citrine, (B) mOrange, and (C) mRuby2 eFRET GEVIs clearly revealed single APs. Patch clamp voltage recordings are shown above ...
Figure images are served from the NIH/NLM PubMed Central Open Access Subset or Europe PMC; copyright remains with the publishers and authors.
💬 Discussion
0 commentsNo comments yet. Be the first to start a discussion!
Leave a Comment