Abstract
AbstractSample fixation by vitrification is critical for the optimal structural preservation of biomolecules and subsequent high-resolution imaging by cryo-correlative light and electron microscopy (cryoCLEM). There is a large resolution gap between cryo fluorescence microscopy (cryoFLM), ~400-nm, and the sub-nanometre resolution achievable with cryo-electron microscopy (cryoEM), which hinders interpretation of cryoCLEM data. Here, we present a general approach to increase the resolution of cryoFLM using cryo-super-resolution (cryoSR) microscopy that is compatible with successive cryoEM investigation in the same region. We determined imaging parameters to avoid devitrification of the cryosamples without the necessity for cryoprotectants. Next, we examined the applicability of various fluorescent proteins (FPs) for single-molecule localisation cryoSR microscopy and found that all investigated FPs display reversible photoswitchable behaviour, and demonstrated cryoSR on lipid nanotubes labelled with rsEGFP2 and rsFastLime. Finally, we performed SR-cryoCLEM on mammalian cells expressing microtubule-associated protein-2 fused to rsEGFP2 and performed 3D cryo-electron tomography on the localised areas. The method we describe exclusively uses commercially available equipment to achieve a localisation precision of 30-nm. Furthermore, all investigated FPs displayed behaviour compatible with cryoSR microscopy, making this technique broadly available without requiring specialised equipment and will improve the applicability of this emerging technique for cellular and structural biology.
🔬 Techniques
🔭 Microscopes
💻 Software
✨ Fluorophores
🧪 Sample Preparation
🔬 Cell Lines
🏭 Microscope Brands
🧪 Reagent Suppliers
📷 Detectors
💻 Software Details
💾 Data Repositories
🏛️ Research Organizations (ROR)
Affiliated research institutions:
📋 Methods
Expression and purification of fluorescent proteins Fluorescent proteins
Dronpa, rsFastLine, rsEGFP2 and Padron were expressed as described 14 , 15 . Genes for EGFP 45 , PA-GFP 46 and mIrisFP 48 were ordered from Integrated DNA Technologies (Leuven, BE) and cloned into pET45b(+) in frame with an N-terminal His6 tag. Expression in BL21(DE3) cells was followed by purification using Ni-NTA-affinity chromatography. All proteins were buffer-exchanged into 50 mM Tris-HCl (pH 7.5), 150 mM NaCl by repeated concentration and dilution using 30 kDa-cutoff spin concentrators (Amicon, Merck millipore). SMLM microscope set-up We adapted a standard upright widefield fluorescent microscope (Leica DM RXA) for SMLM acquisition. A 405 nm laser (LuxX + 405–120, Omicron) and a 488 nm laser (LuxX + 488–100, Omicron) were used for activation and excitation, respectively, which were coupled in using a polarising-maintaining optical fibre, all from Omicron-Laserage Laserprodukte GmbH, Germany. Standard Leica fluorescent cubes were used (FITC filter or N2.1 filter), with the excitation filters removed from the filter blocks. Fluorescence was collected using either a long-working distance lens (HCX PL Fluotar L 100x/0.75, Leica) in combination with a cryostage (CMS-196, Linkam Scientific, UK), or an oil-immersion lens for experiments at 294 K (PL Fluotar 100x/1.3, Leica). Fluorescent images were recorded by a sCMOS camera (pco.edge 4.2, DVision, Oostakker, Belgium). Fluorescence emission spectra were recorded by a home-made set-up that was mounted on an extra camera port via a beam-splitter (100-50-0%, Leica). The emitted light was coupled in a multimode optical fibre (M15L01, Thorlabs Inc, USA) by an aspheric glass lens (C340 TMD-A, Thorlabs Inc, USA) and connected to a fibre-optic spectrometer (AvaSpec-2048L, Avantes, the Netherlands). Software written in-house was utilised to read-out the camera, and to synchronise the lasers and camera acquisition. Monitoring ice devitrification For devitrification experiments, freshly glow discharged C-Flat grids (2/1-2C, Electron Microscopy Science, USA) with deionised water were plunge-frozen using a Leica EM-GP, with blotting time 1 sec. Grids were loaded in the cryoFLM set-up, and illuminated with 488 nm laser light as described, for various intensities and durations (Fig. 1 ). On a single grid up to 10 different conditions could be examined, leaving at least one grid square between locations to avoid influence from previously illuminated areas. It should be noted however, we did not detect any effect on neighbouring grid squares, even after a grid square was illuminated for several minutes using maximum illumination intensity (83.0 W/cm 2 ). Furthermore, we note that the intensity threshold is expected to be dependent on experimental setup (e.g. support material and mesh size). Grids were then transferred to a Gatan 626 cryo holder (Gatan, Pleasanton, USA) for inspection with cryoEM. The distinction between devitrified and vitreous samples is immediately apparent in the cryoEM, as is shown in Fig. 1 . Spectroscopy of FPs at 77 K and 294 K For spectroscopy experiments at 294 K, glass slides and cover slips were cleaned with water and detergent, rinsed with acetone and dried. Slides were coated with poly-L-lysine (0.1 w/v% in water, Sigma), and 1 μl of 180 μM fluorescent protein in buffer (50 mM Tris-HCl (pH 7.5), 150 mM NaCl) was added on top of the poly-L-lysine layer and covered with a cleaned coverslip. For cryogenic spectroscopy experiments, glow-discharged C-Flat grids (2/1-2 C, Electron Microscopy Science, USA) containing 180 μM of fluorescent protein were plunge-frozen using an EM grid plunger (Leica EM-GP), with blotting time 1 sec. Samples were imaged on a standard room temperature-stage or a Linkam cryostage (CMS-196, Linkam Scientific, UK), using 405 nm laser light (LuxX − 405 – 120, Omicron-Laserage Laserprodukte GmbH, Germany), and laser dichroic ZT405rdc (Chroma Technology GmbH, Olching Germany) without any additional excitation or emission fluorescent filters. Activation and deactivation of FPs To assess the ability of FPs to be activated at cryogenic conditions, samples were prepared similarly to spectroscopy experiments, with a reduced concentration of 20 μM. For deactivation prior to vitrification, samples were illuminated using a lamp (Excelitas, EXFO X-cite series 120), filtered with a standard GFP excitation filter (Omega Optics, cat. no. 480DF20, bandwith 470–490 nm), for 1 min. Samples were vitrified within 1 minute after deactivation, and either stored in liquid nitrogen or loaded directly in the Linkam cryostage. Then, samples were activated by a 2.5 sec pulse of 405 nm laser light, with intensity 28.5 W/cm 2 . Deactivation was recorded under continuous illumination of 488 nm light (28.5 W/cm 2 ) for 20 sec, with a camera exposure time of 50 ms and a 20 ms read-out time after each recorded image. For each FP at least 5 cycles were recorded. To extract the deactivation rate of the FPs from the first cycle of the recorded activation traces, images were masked to exclude regions from the grid bar and out-of-focus areas. Then, the average intensity of each frame was used, and fitted with either a bi-exponential function 53 or a mono-exponential function for the traces of EGFP and Padron at 294 K.
Show full methods section
Expression and purification of fluorescent proteins Fluorescent proteins
Dronpa, rsFastLine, rsEGFP2 and Padron were expressed as described 14 , 15 . Genes for EGFP 45 , PA-GFP 46 and mIrisFP 48 were ordered from Integrated DNA Technologies (Leuven, BE) and cloned into pET45b(+) in frame with an N-terminal His6 tag. Expression in BL21(DE3) cells was followed by purification using Ni-NTA-affinity chromatography. All proteins were buffer-exchanged into 50 mM Tris-HCl (pH 7.5), 150 mM NaCl by repeated concentration and dilution using 30 kDa-cutoff spin concentrators (Amicon, Merck millipore). SMLM microscope set-up We adapted a standard upright widefield fluorescent microscope (Leica DM RXA) for SMLM acquisition. A 405 nm laser (LuxX + 405–120, Omicron) and a 488 nm laser (LuxX + 488–100, Omicron) were used for activation and excitation, respectively, which were coupled in using a polarising-maintaining optical fibre, all from Omicron-Laserage Laserprodukte GmbH, Germany. Standard Leica fluorescent cubes were used (FITC filter or N2.1 filter), with the excitation filters removed from the filter blocks. Fluorescence was collected using either a long-working distance lens (HCX PL Fluotar L 100x/0.75, Leica) in combination with a cryostage (CMS-196, Linkam Scientific, UK), or an oil-immersion lens for experiments at 294 K (PL Fluotar 100x/1.3, Leica). Fluorescent images were recorded by a sCMOS camera (pco.edge 4.2, DVision, Oostakker, Belgium). Fluorescence emission spectra were recorded by a home-made set-up that was mounted on an extra camera port via a beam-splitter (100-50-0%, Leica). The emitted light was coupled in a multimode optical fibre (M15L01, Thorlabs Inc, USA) by an aspheric glass lens (C340 TMD-A, Thorlabs Inc, USA) and connected to a fibre-optic spectrometer (AvaSpec-2048L, Avantes, the Netherlands). Software written in-house was utilised to read-out the camera, and to synchronise the lasers and camera acquisition. Monitoring ice devitrification For devitrification experiments, freshly glow discharged C-Flat grids (2/1-2C, Electron Microscopy Science, USA) with deionised water were plunge-frozen using a Leica EM-GP, with blotting time 1 sec. Grids were loaded in the cryoFLM set-up, and illuminated with 488 nm laser light as described, for various intensities and durations (Fig. 1 ). On a single grid up to 10 different conditions could be examined, leaving at least one grid square between locations to avoid influence from previously illuminated areas. It should be noted however, we did not detect any effect on neighbouring grid squares, even after a grid square was illuminated for several minutes using maximum illumination intensity (83.0 W/cm 2 ). Furthermore, we note that the intensity threshold is expected to be dependent on experimental setup (e.g. support material and mesh size). Grids were then transferred to a Gatan 626 cryo holder (Gatan, Pleasanton, USA) for inspection with cryoEM. The distinction between devitrified and vitreous samples is immediately apparent in the cryoEM, as is shown in Fig. 1 . Spectroscopy of FPs at 77 K and 294 K For spectroscopy experiments at 294 K, glass slides and cover slips were cleaned with water and detergent, rinsed with acetone and dried. Slides were coated with poly-L-lysine (0.1 w/v% in water, Sigma), and 1 μl of 180 μM fluorescent protein in buffer (50 mM Tris-HCl (pH 7.5), 150 mM NaCl) was added on top of the poly-L-lysine layer and covered with a cleaned coverslip. For cryogenic spectroscopy experiments, glow-discharged C-Flat grids (2/1-2 C, Electron Microscopy Science, USA) containing 180 μM of fluorescent protein were plunge-frozen using an EM grid plunger (Leica EM-GP), with blotting time 1 sec. Samples were imaged on a standard room temperature-stage or a Linkam cryostage (CMS-196, Linkam Scientific, UK), using 405 nm laser light (LuxX − 405 – 120, Omicron-Laserage Laserprodukte GmbH, Germany), and laser dichroic ZT405rdc (Chroma Technology GmbH, Olching Germany) without any additional excitation or emission fluorescent filters. Activation and deactivation of FPs To assess the ability of FPs to be activated at cryogenic conditions, samples were prepared similarly to spectroscopy experiments, with a reduced concentration of 20 μM. For deactivation prior to vitrification, samples were illuminated using a lamp (Excelitas, EXFO X-cite series 120), filtered with a standard GFP excitation filter (Omega Optics, cat. no. 480DF20, bandwith 470–490 nm), for 1 min. Samples were vitrified within 1 minute after deactivation, and either stored in liquid nitrogen or loaded directly in the Linkam cryostage. Then, samples were activated by a 2.5 sec pulse of 405 nm laser light, with intensity 28.5 W/cm 2 . Deactivation was recorded under continuous illumination of 488 nm light (28.5 W/cm 2 ) for 20 sec, with a camera exposure time of 50 ms and a 20 ms read-out time after each recorded image. For each FP at least 5 cycles were recorded. To extract the deactivation rate of the FPs from the first cycle of the recorded activation traces, images were masked to exclude regions from the grid bar and out-of-focus areas. Then, the average intensity of each frame was used, and fitted with either a bi-exponential function 53 or a mono-exponential function for the traces of EGFP and Padron at 294 K.
Preparation of lipid nanotubes labelled with FPs
Lipid nanotubes comprised of Galactose-ceramide:Ni-NTA DGS lipids (99:1 mol%) were formed in 50 mM Tris-HCl (pH 7.5), 150 mM NaCl buffer as previously reported 54 and labelled with His-tagged FPs by incubating the FP and lipid nanotubes at 4 °C for 1 hour. Labelled lipid nanotubes were applied to the carbon support of freshly glow-discharged C-Flat grids (2/1-2C, Electron Microscopy Science, USA). Grids were then washed three times, to wash away unbound FPs, by blotting from the backside of the grid and quickly rehydrating with fresh buffer. In the last washing step 100 nm tetraspeck beads (ThermoFisher Scientific) were added. The grids were then illuminated with blue light to deactivate the FPs on the grids as described prior to blotting from the reverse side of the grid and plunge-freezing. Grids were stored in liquid nitrogen.
Preparation of Mammalian Cells Transfected with rsEGFP2-MAP2
Gold quantifoil grids (R 1/4, 200 mesh; Electron Microscopy Science, USA) were glow-discharged and laid in 1 ml cell culture dishes, with the carbon side upwards. 30,000 U2OS cells were seeded in Gibco Dulbecco modified eagle medium (DMEM; ThermoFisher, USA), and incubated at 37 °C in a 5% CO 2 atmosphere. A plasmid encoding rsEGFP2-MAP2 was generated by exchanging the α-tubulin sequence of pEGFPTub (Clontech) with the MAP2 sequence, amplified from pDONR223-MAP2 55 , before the EGFP sequence was exchanged with rsEGFP2 15 . After 24 hours, cells were transfected with the rsEGFP2-MAP2 plasmid using polyethylenimine (Polysciences, Inc., USA) in Gibco opti-Eagle’s minimum essential medium (ThermoFisher, USA). After 24 hours, the medium was exchanged with fresh DMEM, and cells were fixed by vitrification 24 hours afterwards. Firstly, the cells were washed three times with PBS. Grids were then carefully picked up and 2 µl of 200 nm tetraspeck beads (diluted 1:15 in PBS) added before being placed under the deactivation lamp (as described above) for ca. 1 min. Finally, the cells were plunge-frozen using the Leica EM GP, operated at 37 °C and 95% humidity. Blotting was performed twice for 4 s each from the backside of the grid.
Cryo-fluorescence microscopy and cryoSMLM
Grids were transferred to the cryostage (CMS-196, Linkam Scientific, UK) and suitable regions on the grid were found by searching whilst illuminating with 488 nm light. When a region was found, its position on the grid was noted for later correlation. For samples that were not pre-deactivated at room temperature, first a deactivation step was performed, by illuminating the sample with 488 nm light for up to 15 min. Next, SR imaging was initiated by first illuminating the sample with an activation pulse (405 nm, 28.5 W/cm 2 ), see also Supplementary Fig. S3 . Each activation pulse was followed by 2.8 sec of imaging, corresponding to 40 acquisition frames each of 50 ms exposure time with a 20 ms read-out time, under constant exposure to 488 nm light (28.5 W/cm 2 ). For the work with cells, laser intensity was reduced to 20.8 W/cm 2 to account for the thicker carbon layer necessary for cell adherence to grids, and to speed up imaging, 10 acquisition frames per imaging cycle were acquired. For each position, the activation pulse started at 200 ms length, and was increased incrementally to 2 sec, to counter the switching fatigue of the fluorophores. During imaging, regular refocussing was necessary, since axial drift cannot be corrected post acquisition. After cryoFLM acquisition, grids were stored under liquid nitrogen until cryoEM imaging. Reconstructing SR images Fluorescent image stacks from SR data collection were processed to compensate for drift and background (Supplementary Fig. S3 ). First, images were cropped and aligned to correct for lateral drift, using a home-written registration method based on locating and registration of fluorescent beads, or alternatively on the sample itself (see also Supplementary Fig. S4 and the Supplementary Note). Then, for each activation cycle, the last frame prior to the activation pulse was subtracted from all frames of that cycle. To avoid clipping the background-corrected images, which can introduce artefacts during the single-molecule localisation, a constant value was added to the frames prior to subtracting. Lastly, frames acquired during refocussing were discarded from the data, since they produced erroneous detections (see Supplementary Fig. S8 ). The resulting stack was then analysed using the software ThunderSTORM 56 . Single molecule events were filtered such that events with high sigma values were ignored for the reconstruction, and with these final locations a SR heatmap was generated, using a SR pixelsize from one sixteenth to one ninth of the original acquired frames. Finally, an overview image of the grid was prepared to facilitate identification of imaged regions in the EM. Localisation precision was calculated by ThunderSTORM, as described in Ovesný et al . 56 and Thompson et al . 57 : documentclass[12pt]{minimal} usepackage{amsmath} usepackage{wasysym} usepackage{amsfonts} usepackage{amssymb} usepackage{amsbsy} usepackage{mathrsfs} usepackage{upgreek} setlength{oddsidemargin}{-69pt} begin{document}$$langle {({rm{Delta }}x)}^{2}rangle =frac{2{sigma }^{2}+{a}^{2}/12}{N}+frac{8pi {sigma }^{4}{b}^{2}}{{a}^{2}{N}^{2}},$$end{document} 〈 ( Δ x ) 2 〉 = 2 σ 2 + a 2 / 12 N + 8 π σ 4 b 2 a 2 N 2 , where documentclass[12pt]{minimal} usepackage{amsmath} usepackage{wasysym} usepackage{amsfonts} usepackage{amssymb} usepackage{amsbsy} usepackage{mathrsfs} usepackage{upgreek} setlength{oddsidemargin}{-69pt} begin{document}$$langle {({rm{Delta }}x)}^{2}rangle $$end{document} 〈 ( Δ x ) 2 〉 is the localisation precision in the lateral direction, σ the standard deviation of the point spread function of the fitted gaussian function, a is the pixel size of the camera, N the number of photons for the localised fluorophore, and b is the background level.
Cryo electron microscopy
Grids were transferred to a Gatan 626 cryo holder (Gatan, Pleasanton, USA) and inserted into a Tecnai T12 transmission electron microscope (FEI Company, USA) operating at 120 kV. Images were recorded on a OneView CMOS detector (Gatan Inc., Pleasanton, USA) using low-dose conditions. EM images used for Fig. 5 were collected on a Tecnai F20 transmission electron microscope (FEI Company, USA), operating at 200 kV. Images were recorded on a US 4000 (Gatan Inc, Pleasanton). A tilt series were acquired using the software package Xplore3D (FEI Company, Eindhoven, NL), using a discontinuous tilt scheme from −54 ° to +60 °, using 3 ° increments, under low dose conditions. The tomogram was reconstructed using IMOD and 6 iterations of the simultaneous iterative reconstruction technique.
Correlation
Precise image correlation was performed using the dedicated software tool ec-CLEM 50 , where fiducial beads are indicated in each imaging modality, after which a precise correlation is calculated by the software. Image interpolation was performed using a nearest neighbour scheme.
Supplementary information SUPPLEMENTARY INFO
Electronic supplementary material Supplementary information accompanies this paper at 10.1038/s41598-018-37728-8.
📊 Figures
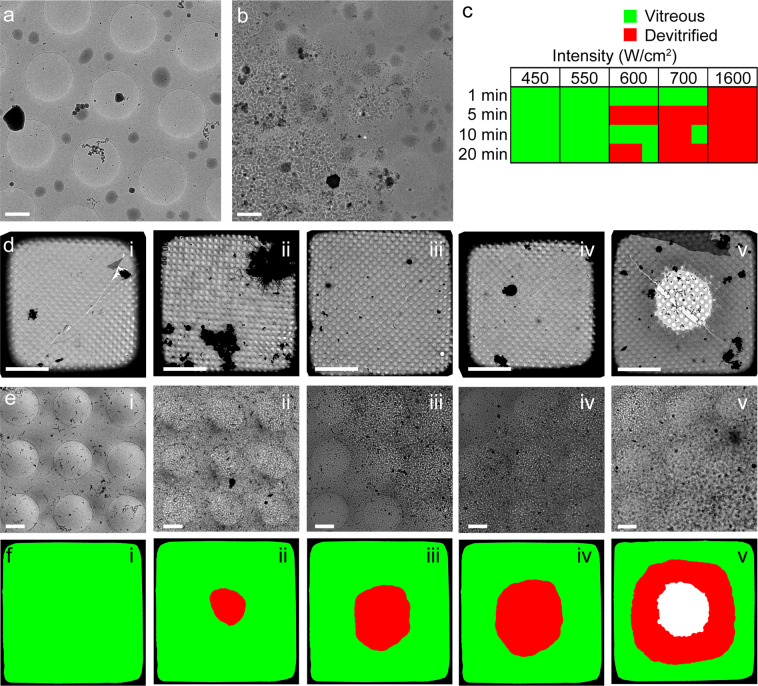
Figure 1
Damage of vitreous water caused by 488u2009nm laser illumination. The specimen shown is a thin holey-carbon film with regularly spaced circular openings supporting a thin film of vitrified water. ( a ...
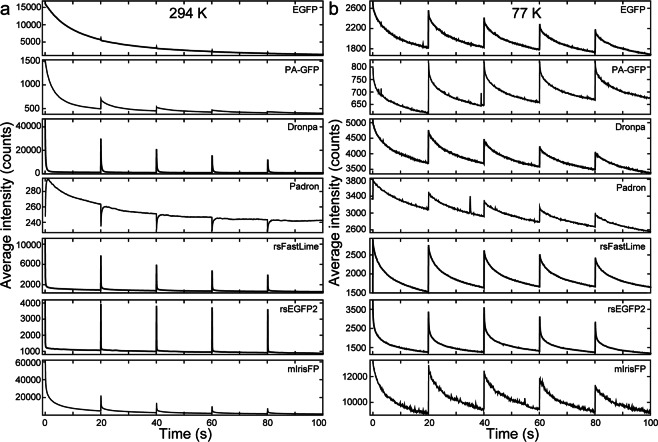
Figure 2
Photoactivation of fluorescent proteins at 294u2009K and 77u2009K. ( a ) Photoactivation of fluorescent proteins at 294u2009K. Fluorescent probes were activated with a 2.5u2009sec. 405u2009nm laser pu...
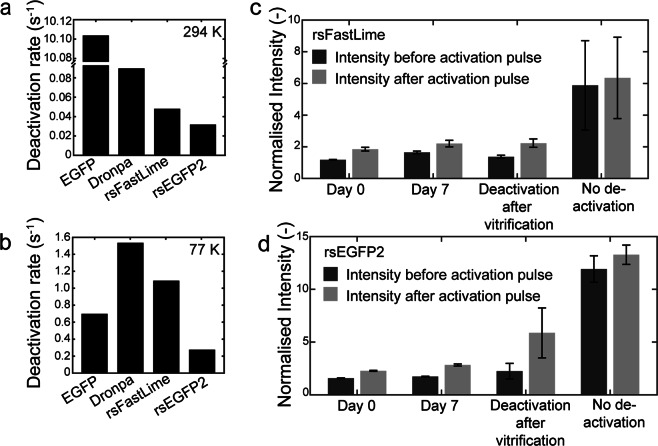
Figure 3
Deactivation of fluorescent proteins at 294u2009K and 77u2009K. The first deactivation curve of traces shown in Fig. 2 were fitted with a (bi-)exponential function, of which the fast rate is plotted i...
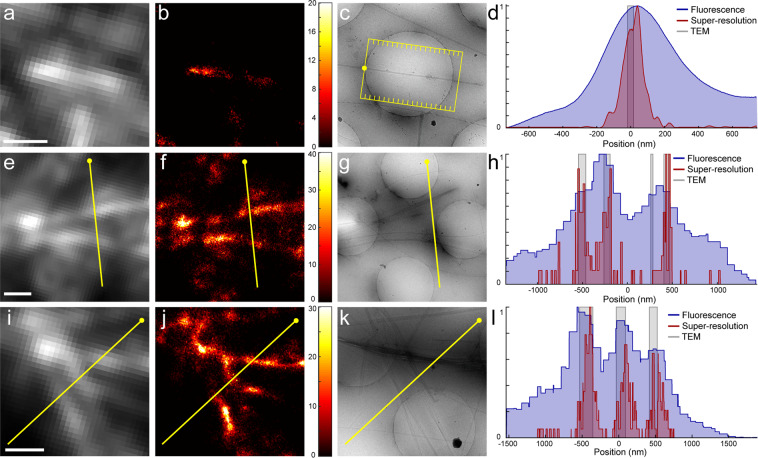
Figure 4
CryoCLEM using rsEGFP2-labelled lipid nanotubes. ( a ) Diffraction-limited cryoFLM image of a single lipid nanotube labelled with rsEGFP2. ( b ) SR image of the same region. The colourmap represents t...
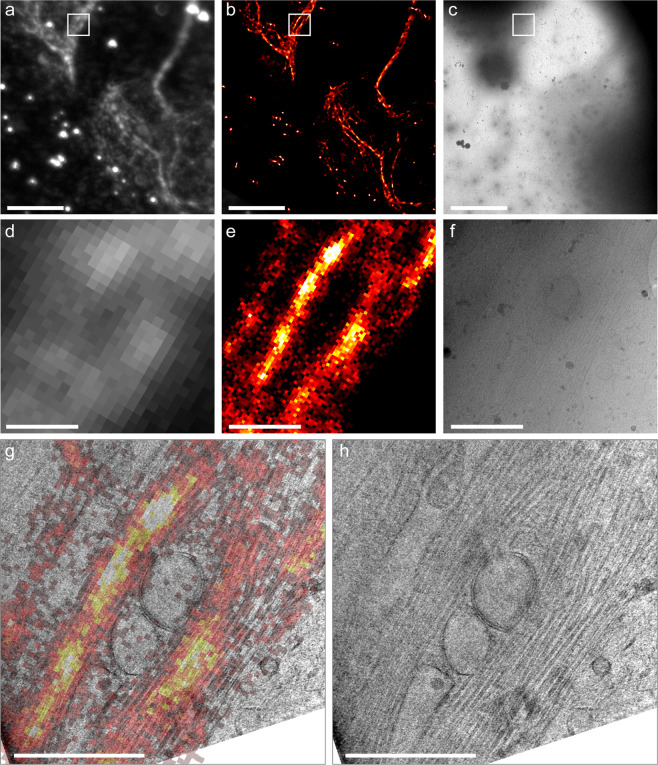
Figure 5
CryoCLEM on U2OS cells, transfected with rsEGFP2-MAP2. ( a ) Diffraction-limited cryoFLM image, ( b ) SR image and ( c ) CryoEM image of the same region, showing two positively transfected cells. ( d ...
Figure images are served from the NIH/NLM PubMed Central Open Access Subset or Europe PMC; copyright remains with the publishers and authors.
💬 Discussion
0 commentsNo comments yet. Be the first to start a discussion!
Leave a Comment