Abstract
Abstract The actin-related protein (Arp)2/3 complex nucleates branched actin filament networks pivotal for cell migration, endocytosis and pathogen infection. Its activation is tightly regulated and involves complex structural rearrangements and actin filament binding, which are yet to be understood. Here, we report a 9.0 Å resolution structure of the actin filament Arp2/3 complex branch junction in cells using cryo-electron tomography and subtomogram averaging. This allows us to generate an accurate model of the active Arp2/3 complex in the branch junction and its interaction with actin filaments. Notably, our model reveals a previously undescribed set of interactions of the Arp2/3 complex with the mother filament, significantly different to the previous branch junction model. Our structure also indicates a central role for the ArpC3 subunit in stabilizing the active conformation.
🔬 Techniques
🧬 Organisms
✨ Fluorophores
🧪 Sample Preparation
🔬 Cell Lines
🏭 Microscope Brands
🧪 Reagent Suppliers
📷 Detectors
💻 Software Details
💾 Data Repositories
🏷️ Research Resource Identifiers (RRIDs)
Verified research resources used in this paper:
🏛️ Research Organizations (ROR)
Affiliated research institutions:
📋 Methods
Cell culture Wild-type Mus musculus NIH-3T3
(RRID:CVCL_0594) fibroblast cells (kindly provided by Michael Sixt, IST Austria) were cultured in Dulbecco’s modified Eagle’s medium (DMEM GlutaMAX, ThermoFischer Scientific, #31966047), supplemented with 10% (v/v) fetal bovine serum (ThermoFischer Scientific, #10270106) and 1% (v/v) penicillin–streptomycin (ThermoFischer Scientific, #15070063). Cells were incubated at 37 °C and 5% CO 2 . Prior to Rac1Q61L transfection (plasmid kindly provided by Vic Small 24 ) using Lipofectamine LTX with Plus Reagent (ThermoFischer Scientific, #15338030), NIH-3T3 cells were seeded at 75% confluency in a six-well plate and incubated at 37 °C and 5% CO 2 for 4 h. The primary transfection mix consisting of 2 μg of plasmid DNA encoding for Rac1Q61L, 200 μl of DMEM, and 2 μl of Plus Reagent was incubated at RT for 10 min. A total of 2 μl of LTX reagent was added and the mix was incubated at for another 30 min. The transfection mix was added dropwise to the cells. Cells were incubated at 37 °C and 5% CO 2 for 16 h prior to trypsinization, and seeding onto 200 mesh gold holey carbon grids (R2/2-2 C; Quantifoil Micro Tools), which were placed in 3D printed grid holders 50 . Prior to seeding, grids were glow discharged in an ELMO glow discharge unit (Cordouan Technologies) for 2 min and subsequently coated with 50 µg/ml fibronectin (Sigma-Aldrich, #11051407001) in PBS for 1 h at RT. Cells were allowed to settle on grids for 4 h at 37 °C and 5% CO 2 before the culture medium was exchanged with three washing steps with DMEM. Starvation was conducted at 37 °C and 5% CO 2 for 3 h before the cells were extracted and fixed according to a published protocol 24 . In detail, for extraction and fixation, grids were retrieved from grid holders and placed in a 50 μl drop of cytoskeleton buffer (10 mM MES, 150 mM NaCl, 5 mM EGTA, 5 mM glucose, and 5 mM MgCl 2 , pH6.2) with 0.75% Triton X-100 (Sigma-Aldrich, #T8787), 0.25% glutaraldehyde (Electron Microscopy Services, # E16220 ), and 0.1 µg/ml phalloidin (Sigma-Aldrich, #P2141) and incubated for 1 min at RT. Grids were postfixed in a 50 μl drop of cytoskeleton buffer containing 2% glutaraldehyde and 1 µg/ml phalloidin for 15 min at RT, before being subjected to vitrification.
Show full methods section
Cell culture Wild-type Mus musculus NIH-3T3
(RRID:CVCL_0594) fibroblast cells (kindly provided by Michael Sixt, IST Austria) were cultured in Dulbecco’s modified Eagle’s medium (DMEM GlutaMAX, ThermoFischer Scientific, #31966047), supplemented with 10% (v/v) fetal bovine serum (ThermoFischer Scientific, #10270106) and 1% (v/v) penicillin–streptomycin (ThermoFischer Scientific, #15070063). Cells were incubated at 37 °C and 5% CO 2 . Prior to Rac1Q61L transfection (plasmid kindly provided by Vic Small 24 ) using Lipofectamine LTX with Plus Reagent (ThermoFischer Scientific, #15338030), NIH-3T3 cells were seeded at 75% confluency in a six-well plate and incubated at 37 °C and 5% CO 2 for 4 h. The primary transfection mix consisting of 2 μg of plasmid DNA encoding for Rac1Q61L, 200 μl of DMEM, and 2 μl of Plus Reagent was incubated at RT for 10 min. A total of 2 μl of LTX reagent was added and the mix was incubated at for another 30 min. The transfection mix was added dropwise to the cells. Cells were incubated at 37 °C and 5% CO 2 for 16 h prior to trypsinization, and seeding onto 200 mesh gold holey carbon grids (R2/2-2 C; Quantifoil Micro Tools), which were placed in 3D printed grid holders 50 . Prior to seeding, grids were glow discharged in an ELMO glow discharge unit (Cordouan Technologies) for 2 min and subsequently coated with 50 µg/ml fibronectin (Sigma-Aldrich, #11051407001) in PBS for 1 h at RT. Cells were allowed to settle on grids for 4 h at 37 °C and 5% CO 2 before the culture medium was exchanged with three washing steps with DMEM. Starvation was conducted at 37 °C and 5% CO 2 for 3 h before the cells were extracted and fixed according to a published protocol 24 . In detail, for extraction and fixation, grids were retrieved from grid holders and placed in a 50 μl drop of cytoskeleton buffer (10 mM MES, 150 mM NaCl, 5 mM EGTA, 5 mM glucose, and 5 mM MgCl 2 , pH6.2) with 0.75% Triton X-100 (Sigma-Aldrich, #T8787), 0.25% glutaraldehyde (Electron Microscopy Services, # E16220 ), and 0.1 µg/ml phalloidin (Sigma-Aldrich, #P2141) and incubated for 1 min at RT. Grids were postfixed in a 50 μl drop of cytoskeleton buffer containing 2% glutaraldehyde and 1 µg/ml phalloidin for 15 min at RT, before being subjected to vitrification.
Cryo-electron microscopy
Samples were vitrified using a Leica GP2 plunger (Leica Microsystems) set to 4 °C and 80% humidity. After transfer into the blotting chamber, excess fixation solution was manually blotted off and 3 μl of a solution of 10 nm colloidal gold coated with BSA in PBS was added onto the grids. The grids were then vitrified in liquid ethane (−185 °C) after backside blotting (3 s), using the blotting sensor of the Leica GP2. Samples were stored under liquid nitrogen conditions until imaging. Cryo-electron tomograms were acquired on a Thermo Scientific Titan Krios G3i TEM equipped with a BioQuantum post-column energy filter and a K3 camera (Gatan), using the SerialEM package 51 . Low- and medium-magnification montages were acquired for search purposes, and for defining areas of interest for subsequent high-resolution tomography data acquisition, respectively. Gain references were collected prior to data acquisition. Microscope and filter tuning were performed using SerialEM and DigitalMicrograph (Gatan) software, respectively. The slit width of the filter was set to 20 eV. Tilt series were acquired with a dose-symmetric tilt scheme 52 ranging from −60° to 60° with a 2° increment and a nominal defocus ranging from −1.75 to −5.5 µm. The nominal magnification was 42,000×, resulting in a pixel size of 2.137 Å. Individual tilt images were acquired as 11,520 × 8184 pixel super-resolution movies of seven frames. The calculated cumulative dose was 170 e/Ų. Data were acquired over three acquisition sessions contributing 38, 12, and 81 tilt series, respectively, for a total of 131 tilt series, keeping above described acquisition parameters constant.
Image processing
Super-resolution movies were aligned on-the-fly during data acquisition, using the SerialEMCCD frame alignment plugin. Tilt series were automatically saved as 2×-binned (2.137 Å/px) mrc stacks. These stacks were used for image processing during template matching and principal component analysis (PCA)-based classification. CTFFIND4 (ref. 53 ) was used to perform CTF estimation on each tilt individually. Images were low-pass filtered according to their cumulative electron dose. The appropriate filters were calculated using an exposure-dependent amplitude attenuation function and published critical exposure constants 54 . Prior to further processing, poor quality tilt images caused for example by grid bars blocking the beam at high tilt angles were removed. For preprocessing of tilt series (tilt stack sorting, removal of bad tilts, and exposure filtering), the tomoman software package was used (available via doi:10.5281/ZENODO.4110737). Tilt-series alignment of the exposure-filtered tilt images was done using the IMOD software package 55 . Initial processing steps including template matching, PCA-based classification, and STA were performed, using the Dynamo package 56 up to the generation of the reference for STA in RELION 57 (Supplementary Fig. 2 ). To generate a starting reference for template matching 1549 branch junctions were manually picked from 37 8×-binned tomograms (17.096 Å/px), using the 3Dmod functionality of the IMOD software package. No angles were assigned to the manual picked positions. Cubic subvolumes with an approximate side length of 700 Å were extracted from 2×-binned tomograms and aligned against a structure of the branch junction derived previously from negative stain tomograms 24 . Alignment was done over five rounds, using the internal binning in Dynamo to resample subvolumes to 8.548 Å/px. The resulting average was then band-pass filtered (100–40 Å) and used for template matching branch junctions in the entire dataset consisting of 131 tomograms. For cross-correlation calculation during template matching a mask consisting of two cylinders (both with a 140 Å radius) covering the branch, mother filament and the daughter filament were applied. Full 360° angular scanning during template matching was performed around all three axes with a sampling step of 10°. False-positive cross-correlation peaks (i.e., from areas containing gray value outliers) were removed. Subsequently, the 300 positions with the highest cross-correlation value per tomogram were considered for further processing. For PCA classification in Dynamo, the corresponding 39,300 subvolumes were extracted from 8×-binned tomograms, split into three groups of equal size and processed in parallel to allow for faster computation. Pairwise cross-correlation calculations were performed for all particles within each group before PCA was conducted. Ten eigenvolumes were calculated and a subset of them was chosen to be employed for separating the particles into ten classes. Class averages containing only actin filaments were discarded, and class averages exhibiting equally strong densities for the whole branch junction, the mother and daughter filament were included for further processing. To this end, the remaining particles from the three classification groups were merged again, resulting in a total number of 17,302 subvolumes. The subvolumes of the complete dataset were subjected to one round of bin 8 alignment (Supplementary Fig. 2 ), and averaging in Dynamo to provide a reference for classification and STA in RELION 58 . The following processing steps were performed in Warp 1.0.7 (ref. 59 ), M 1.0.9 (ref. 22 ), and RELION 3.08 (ref. 57 , 60 ). In Warp super-resolution frames were binned (resulting pixel size was 2.137 Å) for frame alignment and defocus estimation of individual tilts. For tilt-series alignment, the same tilts and alignment parameters as determined in IMOD were employed. Defocus parameters were then again determined for whole tilt series. Coordinates of the particles determined from the Dynamo PCA calculation were employed for the extraction of 17,146 subvolumes into cubic subvolumes of 240 voxels at a pixel spacing of 2.137 Å and the corresponding 3D CTF/wedge models, which also consider radiation damage by accumulated electron dose. One round of RELION 3D classification was performed, resulting in 14,296 subvolumes. This dataset was then subjected to RELION 3D auto-refine using the average determined in Dynamo (low-pass filtered to 40 Å), resulting in a resolution of 11.9 Å at the 0.143 criterion. Particles were automatically distributed into even and odd subsets during the RELION workflow. Subsequently, multiparticle refinement was performed in M. Tilt series were refined using image warp with a 9 × 6 grid and volume warp with a 4 × 6 × 2 × 10 grid. Particle poses and angles were refined for one temporal sampling point. These settings were kept for all following refinements in M. Subvolumes were re-extracted from the refined tilt series and aligned with RELION 3D auto-refine, using the result of the previous iteration filtered to 40 Å as reference. This cycling between Warp, RELION, and M was performed for a total of three rounds ending on the final iteration in M. RELION post-processing was applied to the resulting half-maps yielding a final structure at 9.0 Å resolution at the 0.143 FSC criterion (Supplementary Fig. 2 ). For B -factor sharpening, an empirically determined B -factor of −50 allowed to optimally visualize structural details in the EM density, without causing artificial discontinuous densities or sharp edges within the structure. Masks employed for resolution estimation encompassed the Arp2/3 complex and all actin subunits contacting it. Since the actin filaments extended to the box edge, we first masked in Dynamo around the region of interest (i.e., the branch junction and surrounding actin subunits). Then RELION was used to generate a mask around this region of interest, low-pass filtering the mask to 15 Å, extending it by five voxels and applying a soft edge of ten voxels (Supplementary Fig. 2 ).
Model fitting and data analysis
The crystal structure of the Arp2/3 complex with ATP bound to Arp2 and Arp3 (pdb 1TYQ) 12 , and the model derived from the single-particle cryo-EM structure of aged, nucleotide-bound, and phalloidin-stabilized F-actin (pdb 6T20) 28 were used to generate a model of the actin filament Arp2/3 complex branch junction. All subunits of the Arp2/3 complex and individual actin subunits from pdb 6T20 (11 in total, 8 within the densities of the mother filament and 3 within the densities of the daughter filament) were placed individually using the rigid-body fitting option in UCSF Chimera 61 . Due to the increased flexibility, as suggested by the lower resolution in our map, for the N-terminal region of ArpC5, rigid-body fitting only considered residues 69–151 of this subunit. In most crystal structures of the Arp2/3 complex, subdomains 1 and 2 of Arp2 are not resolved, except for a structure of GMF-bound Arp2/3 complex 9 . In order to generate a complete model of Arp2 for fitting into our EM density map, we generated a composite Arp2 model consisting of subdomains 1 and 2 from pdb 4JD2 (GMF-bound Arp2/3 complex), and subdomains 3 and 4 from pdb 1TYQ (not having a GMF interaction in the original crystal structure). The exact composition of the resulting model, which was then rigid-body fitted is reported in Supplementary Table 2 . For ArpC1, the “protrusion” helix formed by the residues 297–305 and the surrounding linker region is not present in the 1TYQ model. The helix itself and residues 306–309 were imported from pdb 1K8K 11 , and placed in an empty density at the surface of the actin subunit M4. Merging of the two models and adding residues connecting them, was performed in Coot 62 . The source of the primary structure elements of the resulting model is given in (Supplementary Table 2 ). Smaller gaps in the models of other individual subunits were bridged by adding the missing residues in Coot and N- or C-terminal regions were trimmed if no fitting density could be found. Supplementary Table 2 refers to the implemented changes. Phalloidin models were removed and the 4-methyl-histidines in the actin structure (pdb 6T20) at position 73 were replaced by histidines. The complete assembly containing all Arp2/3 subunits, actin subunits, and remaining ligands was merged into a single pdb file. Coot was then used to move residues within clashing areas and to release entanglements between chains. The resulting model was associated to the sharpened map in ChimeraX 63 and hydrogens were added using the addh command. The ISOLDE plugin 29 was employed to restrict the positions of ligands (ATP and Mg 2+ /Ca 2+ ions from the original models), ArpC5 and the actin subunits M1, M8, and D3. It was further used to manually move parts of the Arp2 domain 2 (residues 37–56), Arp3 C-terminus (residues 405 onward), and to perform a MD simulation for the whole model to allow for an initial flexible fitting into the corresponding densities. In a next step, ChimeraX was employed to exchange truncated residues present in the original models with their full-length counter parts (Supplementary Table 2 ). Using ISOLDE, smaller areas were simulated locally to manually alleviate clashes, improve fitting of sub chains, and correct for highly improbable geometries. For this, secondary structure restraints were applied whenever necessary to keep α-helices from deteriorating, and positional restraints were applied to keep the actin structures from occupying densities associated with phalloidin. After regional changes were implemented, the whole model was activated again via ISOLDE and cooled down to 0 K. After all ligands had been removed, the quality of the model was validated using MOLPROBITY 64 , as it is integrated in the Phenix Comprehensive validation (Cryo-EM) tool 65 (Supplementary Table 3 ). Visualization and model analysis were performed with UCSF ChimeraX. For the comparisons of inactive and active conformation shown in Fig. 2 , maps were generated via the molmap command in ChimeraX at described resolutions from pdb 1TYQ and our branch junction model, respectively (1TYQ was modified to contain all residues present in our model). In order to accurately calculate the branch junction angle, vectors representing the mother filament and the daughter filament were derived from fitting a line between the C-alpha atoms of residues Met269 of M1 and M8 (vector M1to8) for the mother filament, and residues Met269 for D1 and D3 (vectorD1to3) of the daughter filament, respectively. Met269 was chosen due to its proximity to the central axis of the actin filament. The branch angle was then calculated via (1). 1 documentclass[12pt]{minimal} usepackage{amsmath} usepackage{wasysym} usepackage{amsfonts} usepackage{amssymb} usepackage{amsbsy} usepackage{mathrsfs} usepackage{upgreek} setlength{oddsidemargin}{-69pt} begin{document}$${it{{Theta} }} = arccos frac{{{mathbf{vectorM1to8}} cdot {mathbf{vectorD1to3}}}}{{left| {{mathbf{vectorM1to8}}} right|left| {{mathbf{vectorD1to3}}} right|}}$$end{document} Θ = arccos vectorM1to8 ⋅ vectorD1to3 vectorM1to8 vectorD1to3 RMSD calculations were performed considering only the C-alpha atoms of the models. Models were aligned and compared in Chimera using the matchmaker and the RMSD command, respectively. PDB2PQR 66 and APBS 67 were employed to calculate electrostatic potential maps, which were used to color surfaces in ChimeraX. The surface area calculation between the Arp2/3 complex and the mother filament in our model and the model derived by MD simulation 16 (both with hydrogens included) was performed employing the “measure buriedarea” command in ChimeraX, using a 1.5 Å probe and otherwise standard settings. Reporting summary Further information on research design is available in the Nature Research Reporting Summary linked to this article.
Supplementary information Supplementary Information Peer Review File Supplementary Movie 1 Supplementary Movie 2 Supplementary Movie 3 Supplementary Movie 4 Supplementary Movie 5 Description of additional supplementary files Reporting Summary
📊 Figures
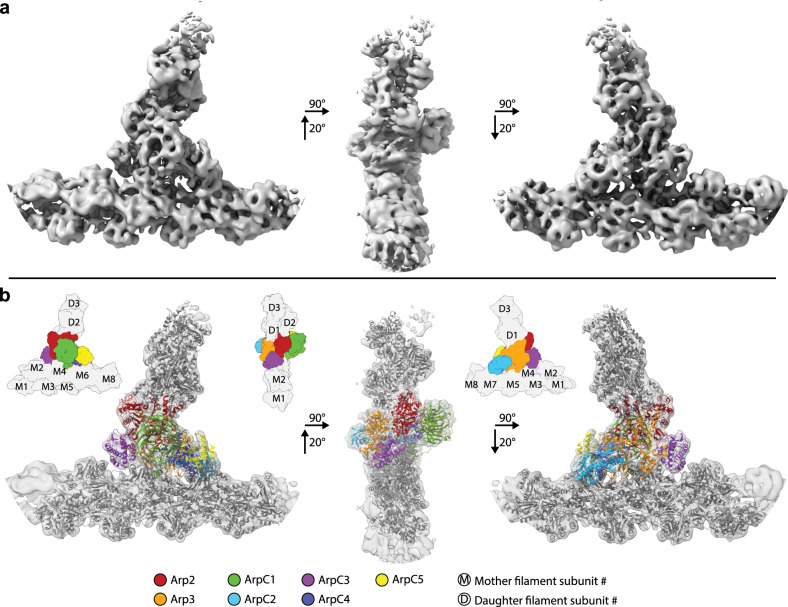
Fig. 1
Subnanometer structure of the actin filament Arp2/3 complex branch junction in cells.
a Isosurface representation of the actin filament Arp2/3 complex branch junction in cells at 9u2009u00c5 resolution. The structure is shown from three orientations. A guide for orientation is given in...
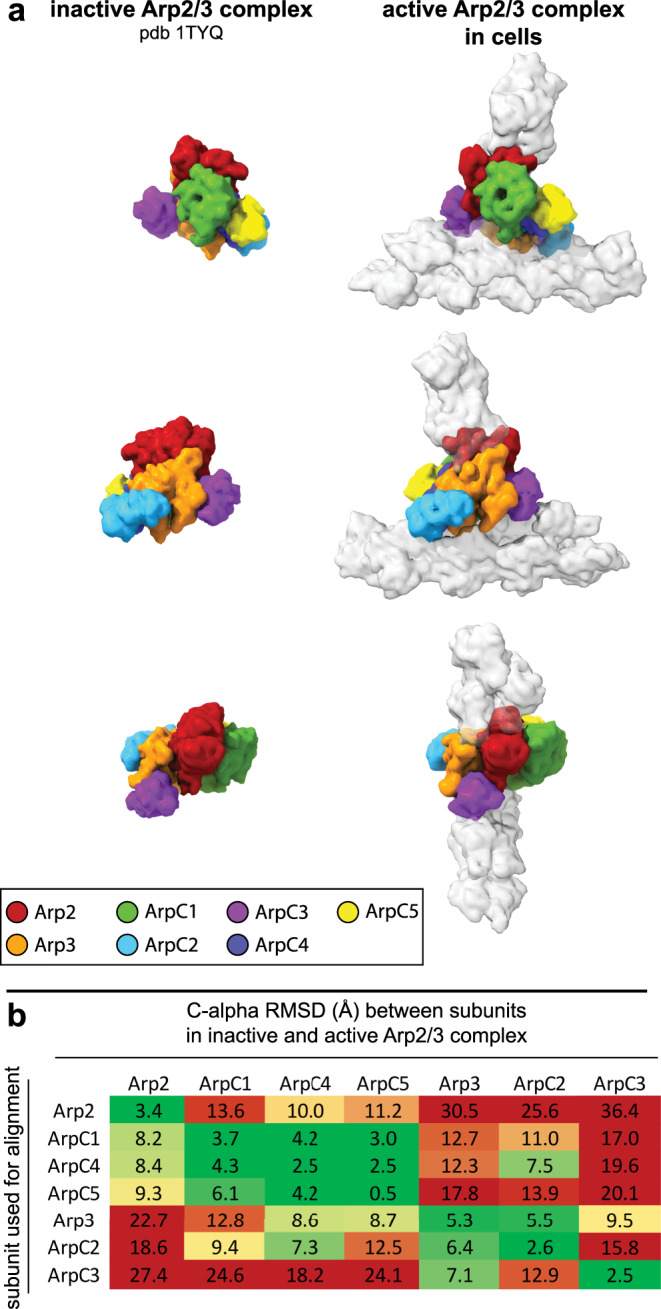
Fig. 2
Comparison of Arp2/3 complex in its inactive conformation and in the branch junction in cells.
a Molecular models of the Arp2/3 complex in the inactive (derived from pdb 1TYQ) and the active conformation shown as density maps filtered to 9.5u2009u00c5 resolution. The models are shown from three...
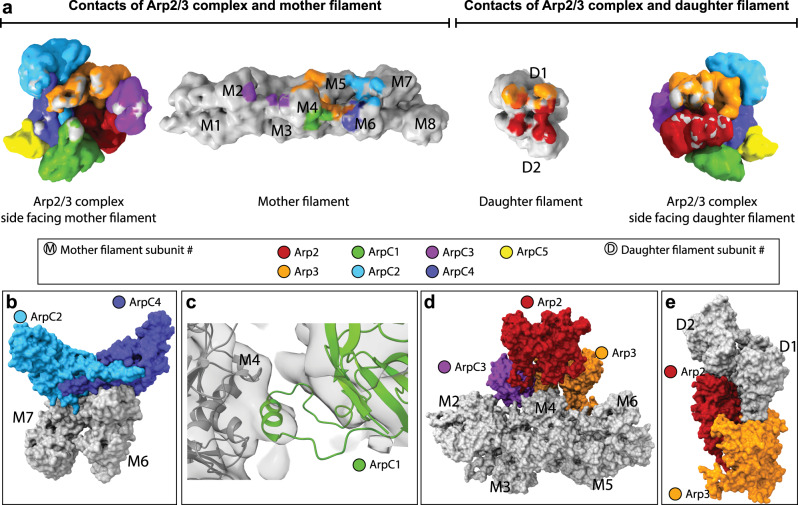
Fig. 3
Actinu2013Arp2/3 complex interaction surfaces within the branch junction.
a Interaction surfaces between the Arp2/3 complex, and the actin mother and daughter filament. The surfaces for the Arp2/3 complex, mother and daughter filament are shown as density maps at 9.5u2009u0...
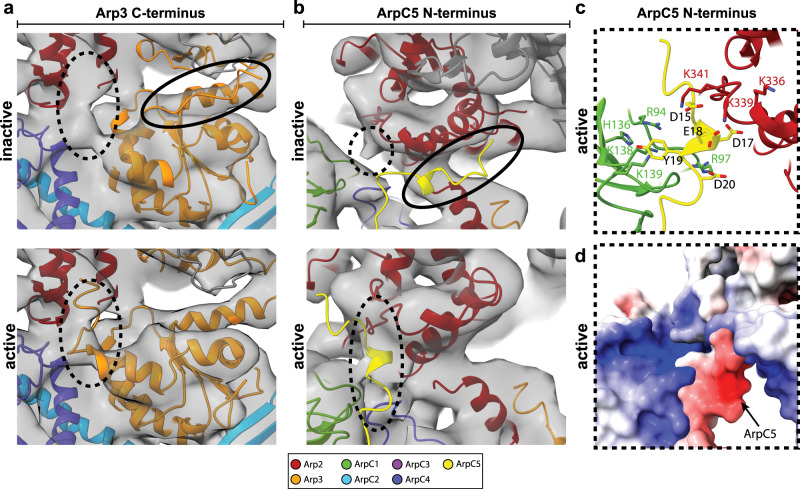
Fig. 4
Structural changes in Arp3 and ArpC5 upon branch junction formation.
a Comparison of the conformation of the Arp3 C-terminal tail in the inactive and active conformation. No density is observed for the C-terminal tail of Arp3 in its inactive conformation (top). Instead...
Figure images are served from the NIH/NLM PubMed Central Open Access Subset or Europe PMC; copyright remains with the publishers and authors.
💬 Discussion
0 commentsNo comments yet. Be the first to start a discussion!
Leave a Comment