Abstract
AIMS/HYPOTHESIS: Islet antigen 2 (IA-2) and IA-2β are dense core vesicle (DCV) transmembrane proteins and major autoantigens in type 1 diabetes. The present experiments were initiated to test the hypothesis that the knockout of the genes encoding these proteins impairs the secretion of insulin by reducing the number of DCV. METHODS: Insulin secretion, content and DCV number were evaluated in islets from single knockout (Ia-2 [also known as Ptprn] KO, Ia-2β [also known as Ptprn2] KO) and double knockout (DKO) mice by a variety of techniques including electron and two-photon microscopy, membrane capacitance, Ca(2+) currents, DCV half-life, lysosome number and size and autophagy. RESULTS: Islets from single and DKO mice all showed a significant decrease in insulin content, insulin secretion and the number and half-life of DCV (p < 0.05 to 0.001). Exocytosis as evaluated by two-photon microscopy, membrane capacitance and Ca(2+) currents supports these findings. Electron microscopy of islets from KO mice revealed a marked increase (p < 0.05 to 0.001) in the number and size of lysosomes and enzymatic studies showed an increase in cathepsin D activity (p < 0.01). LC3 protein, an indicator of autophagy, also was increased in islets of KO compared with wild-type mice (p < 0.05 to 0.01) suggesting that autophagy might be involved in the deletion of DCV. CONCLUSIONS/INTERPRETATION: We conclude that the decrease in insulin content and secretion, resulting from the deletion of Ia-2 and/or Ia-2β, is due to a decrease in the number of DCV.
🔬 Techniques
🔭 Microscopes
🧬 Organisms
💻 Software
✨ Fluorophores
🧪 Sample Preparation
🏭 Microscope Brands
🧪 Reagent Suppliers
🔴 Lasers
📷 Detectors
💻 Software Details
🏛️ Research Organizations (ROR)
Affiliated research institutions:
📋 Methods
Insulin secretion, content and DCV number were evaluated in islets from single knockout (IA-2 KO, IA-2β KO) and double knockout (DKO) mice by a variety of techniques including electron and two-photon microscopy, membrane capacitance, Ca 2+ currents, DCV half-life, lysosome number and size and autophagy.
Methods Mice
KO mice were prepared as described previously [ 11 – 13 ]. Because female IA-2 −/− /IA-2β −/− (DKO) mice are infertile [ 14 ], male DKO mice were bred to female IA-2 −/− /IA-2β +/− mice to generate DKO mice. Animals used in this study were produced in our institute animal core facility. All protocols were approved by NIDCR animal care and use committee.
Islet isolation
Islets from age (3–4 months old) and gender-matched mice were isolated as described previously [ 17 , 18 ]. Briefly, mice were anesthetized by intraperitoneal injection with ketamine (50 mg/kg). Collagenase solution (Sigma, Saint Louis, MO) was injected into the bile duct to inflate the pancreas. After digestion, islets were manually selected and washed in Krebs-Ringer HEPES buffer, and cultured overnight in RPMI-1640 medium (Invitrogen, Carlsbad, CA) before further experiments.
Electron microscopy
Isolated islets were fixed, sectioned [ 18 , 19 ] and analyzed at a primary beam voltage of 120 kV using a CM120 transmission electron microscope (FEI, Hillsboro, OR) and a Gatan cooled 1k × 1k CCD camera (Gatan, Pleasanton, CA). Images were recorded with Digital Micrograph (Gatan) and montaged to evaluate the overall organization of single cells. Each image was quantified by three individuals. Total DCV and lysosomal numbers and the number of DCVs below the plasma membrane were determined using NIH ImageJ.
Show full methods section
Insulin secretion, content and DCV number were evaluated in islets from single knockout (IA-2 KO, IA-2β KO) and double knockout (DKO) mice by a variety of techniques including electron and two-photon microscopy, membrane capacitance, Ca 2+ currents, DCV half-life, lysosome number and size and autophagy.
Methods Mice
KO mice were prepared as described previously [ 11 – 13 ]. Because female IA-2 −/− /IA-2β −/− (DKO) mice are infertile [ 14 ], male DKO mice were bred to female IA-2 −/− /IA-2β +/− mice to generate DKO mice. Animals used in this study were produced in our institute animal core facility. All protocols were approved by NIDCR animal care and use committee.
Islet isolation
Islets from age (3–4 months old) and gender-matched mice were isolated as described previously [ 17 , 18 ]. Briefly, mice were anesthetized by intraperitoneal injection with ketamine (50 mg/kg). Collagenase solution (Sigma, Saint Louis, MO) was injected into the bile duct to inflate the pancreas. After digestion, islets were manually selected and washed in Krebs-Ringer HEPES buffer, and cultured overnight in RPMI-1640 medium (Invitrogen, Carlsbad, CA) before further experiments.
Electron microscopy
Isolated islets were fixed, sectioned [ 18 , 19 ] and analyzed at a primary beam voltage of 120 kV using a CM120 transmission electron microscope (FEI, Hillsboro, OR) and a Gatan cooled 1k × 1k CCD camera (Gatan, Pleasanton, CA). Images were recorded with Digital Micrograph (Gatan) and montaged to evaluate the overall organization of single cells. Each image was quantified by three individuals. Total DCV and lysosomal numbers and the number of DCVs below the plasma membrane were determined using NIH ImageJ.
Two-photon excitation imaging of exocytosis
Exocytosis of DCVs was visualized in living islets with a solution containing the fluid-phase tracer sulforhodamine B (0.7 mmol/l) and two-photon excitation imaging [ 20 , 21 ]. Exocytosis in response to 20 mmol/l glucose was measured within an arbitrary area (800 μm 2 ) of the islets. Imaging was acquired at 1 Hz using an inverted, laser-scanning microscope (FV1000 and I × 81, Olympus, Tokyo) equipped with a water-immersion objective (UPlanApo60xW/IR; N.A. 1.2, Olympus) and a femtosecond laser (MaiTai, Spectra Physics, Mountain View, CA). Sites of exocytosis were detected manually. Electrophysiological studies Details of measurements of intracellular free Ca 2+ concentration [ 22 , 23 ], voltage-gated Ca 2+ current [ 22 , 23 ], and membrane capacitance of β cells [ 24 ] are provided in the Supplemental Methods . Insulin content and secretion Groups of 25 islets on a 62-μm monofilament nylon mesh inside a 13-mm Swinnex chambers (Millipore, Bedford, MA) were perifused at 0.5 ml/min with KRB buffer containing 2.8 or 16.7 mmol/l glucose. Aliquots of perfusate (0.5-ml) were collected at different times over one hour and stored at −80 °C for measurements (Insulin RIA kit, Linco, St. Charles, Missouri). Insulin content in acidic alcohol-extracted islets was determined by RIA. Proinsulin content was determined by ELISA with anti-mouse proinsulin antibody CCI-17 (HyTest, Turku, Finland). Total protein level was measured by the MicroBCA Protein Assay (Pierce, Rockford, IL). Cathepsin D Two hundred freshly isolated islets were washed in Hank’s solution and dissolved by sonication in 200 μl acetate-EDTA buffer (1.1 mmol/l EDTA, 5 mmol/l acetate, pH 5.0). Aliquots were used to determine lysosomal enzyme activity using a Cathepsin D Assay Kit (Sigma). Autophagy Islets were cultured overnight before infection with adenovirus-GFP or LC-3::GFP (gift from Dr. Cindy Miranti). Control cells were infected with GFP alone (Ad-GFP). Islet cells were infected for 24 h before washing and cultured for an additional 24 h. Immunofluorescence with LC-3 antibody (Clone 4E12, MBL, Woburn, MA) was detected by confocal microscopy (Leica TCS SP2 microscope, Wetzlar, Germany). To quantitate the extent of autophagy, number of LC3::GFP punctate in each cell was counted using MetaMorph software (Molecular Devices).
📊 Figures
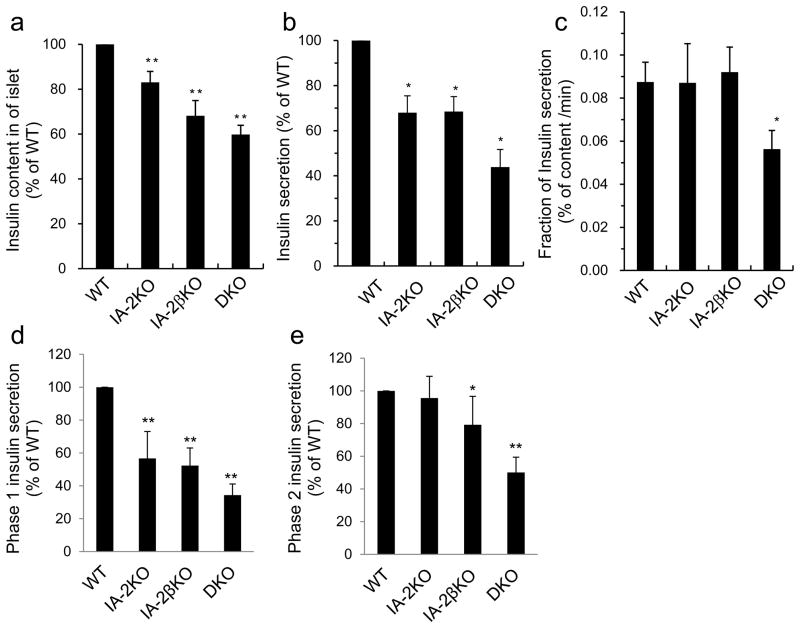
Fig. 1
Insulin content and glucose-stimulated insulin secretion in KO mice. (a) Insulin content in islets of KO mice as compared to WT mice. (b) Glucose-stimulated insulin secretion determined 60 minutes aft...
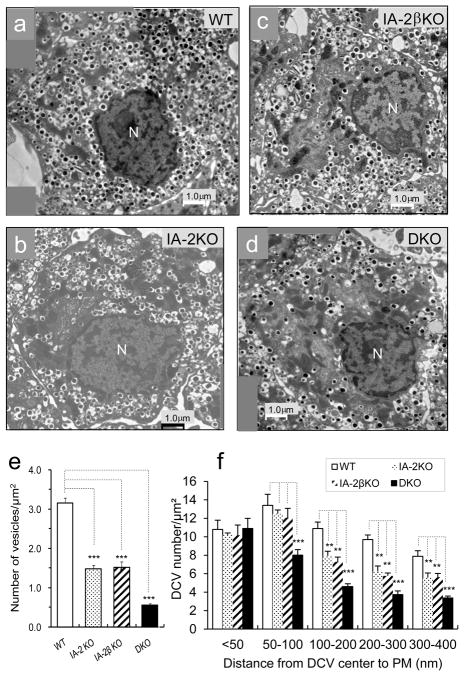
Fig. 2
Number of DCV in WT and KO mice. Representative electron micrographs showing DCV in u03b2 cells of (a) WT, (b) IA-2KO, (c) IA-2u03b2KO and (d) DKO mice. (e) Analysis of DCV from 26 u03b2 cells from ea...
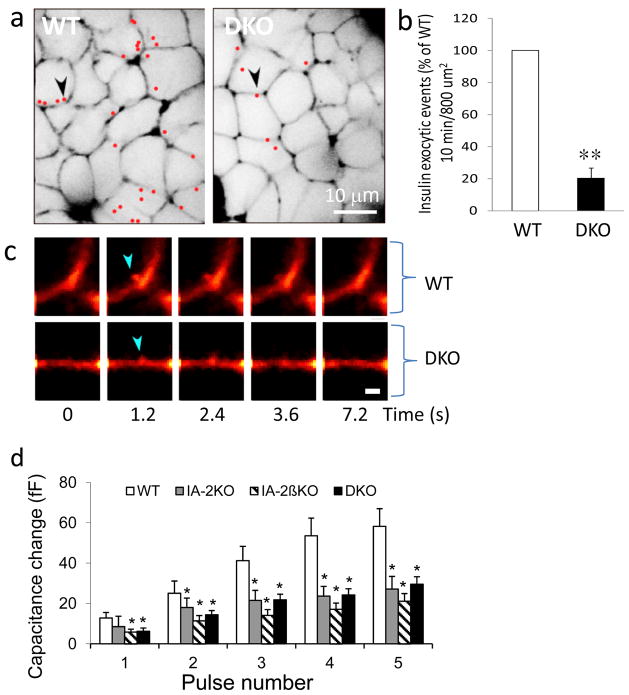
Fig. 3
Glucose-stimulated DCV exocytosis in islets evaluated by two photon microscopy. (a) Spatial distribution of exocytotic sites in the islet cells: Left, WT, right, DKO. Scale bar, 10 microm. (b) Quantit...
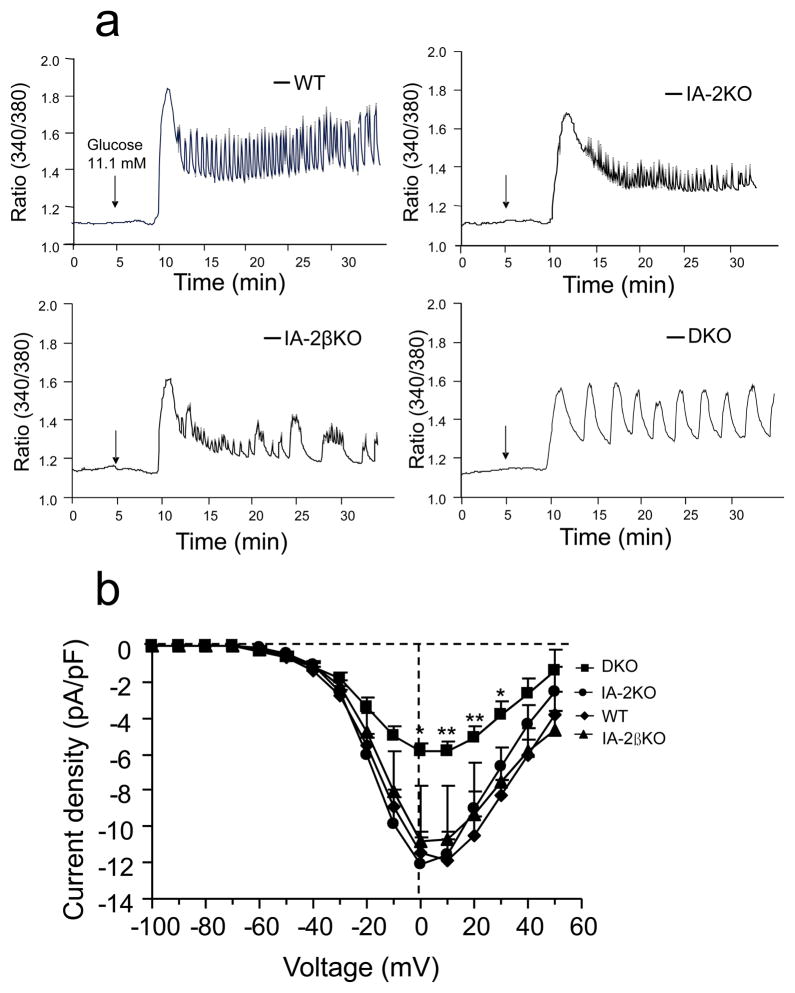
Fig. 4
Changes in glucose-dependent islet [Ca 2+ ] i oscillations and voltage-dependent Ca 2+ currents in WT and KO. (a) The first peak in [Ca 2+ ] i seen upon raising glucose from 2.8 to 11.1 mmol/l was hig...
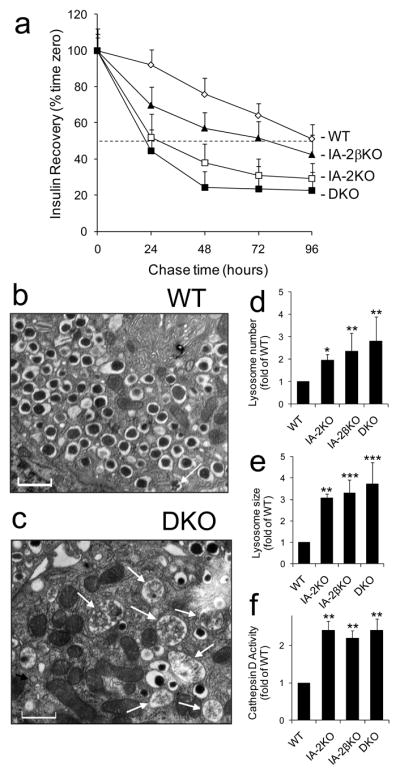
Fig. 5
Half-life of DCV. (a) Islets were pulsed with [ 35 S]-methionine and [ 35 S]-cysteine and chased for 96 hours. Labeled insulin was pulled down with anti-insulin antibody and the half-life of insulin i...

Fig. 6
Representative elecron micrographs of u03b2 cells showing (a) fusion and (b) uptake of DCV by lysosomes and (c) by multigranular bodies in IA-2KO, IA-2u03b2KO and DKO mice, respectively. Cultured isle...
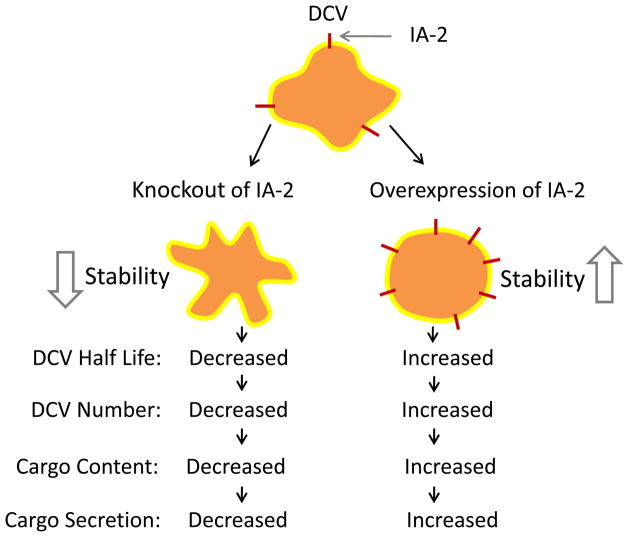
Fig. 7
Effect of IA-2 on the stability of DCV. In mice, the KO of IA-2 destabilizes and decreases the half-life of DCV. In turn, the number of DCV, the amount of insulin in u03b2 cells and its secretion, is ...
Figure images are served from the NIH/NLM PubMed Central Open Access Subset or Europe PMC; copyright remains with the publishers and authors.
💬 Discussion
0 commentsNo comments yet. Be the first to start a discussion!
Leave a Comment