Abstract
AbstractCentrioles are vital cellular structures that form centrosomes and cilia. The formation and function of cilia depends on a set of centriole’s distal appendages. In this study, we use correlative super resolution and electron microscopy to precisely determine where distal appendage proteins localize in relation to the centriole microtubules and appendage electron densities. Here we characterize a novel distal appendage protein ANKRD26 and detail, in high resolution, the initial steps of distal appendage assembly. We further show that distal appendages undergo a dramatic ultra-structural reorganization before mitosis, during which they temporarily lose outer components, while inner components maintain a nine-fold organization. Finally, using electron tomography we reveal that mammalian distal appendages associate with two centriole microtubule triplets via an elaborate filamentous base and that they appear as almost radial finger-like protrusions. Our findings challenge the traditional portrayal of mammalian distal appendage as a pinwheel-like structure that is maintained throughout mitosis.
🔬 Techniques
💻 Software
✨ Fluorophores
🧪 Sample Preparation
🔬 Cell Lines
🏭 Microscope Brands
🧪 Reagent Suppliers
📷 Detectors
🔎 Objectives
💻 Software Details
🏛️ Research Organizations (ROR)
Affiliated research institutions:
📋 Methods
Cell cultures and drug treatment
Retinal pigment epithelial RPE-1 39 and HeLa 40 , constitutively expressed Centrin1-GFP (C1-GFP). Mouse inner-medullary collecting duct cells mIMCD3 were a gift from Dr. C Westlake (NCI/CCR-Frederick). The cultures were grown in DMEM (Invitrogen) supplemented with 10% fetal bovine serum (FBS) and 1% Penicillin Streptomycin (PS), at 37 °C, in a humified environment with 5% CO 2 . RPE-1 were starved in medium containing no serum for 24 h to induce ciliation. For immunofluorescence and imaging, cells were plated on round 25 mm, 1.5 high precision cover glasses (Warner Instruments). Cells were treated with 200 nM BI2536 inhibitor (BI; Selleckchem) to inhibit Plk1 activity and with 250 nm MLN8237 (MLN; Selleckchem) to inhibit Aurora A. mTEC cultures Cultures were established as previously described 41 , 42 . Briefly, C57BL/6 mice were sacrificed at 2–4 months of age, trachea were excised, opened longitudinally to expose the lumen, and placed in 1.5 mg/mL Pronase E in DMEM/F12 medium (Life Technologies) at 4 °C overnight. Tracheal epithelial cells were dislodged by gentle agitation and collected in DMEM/F12 with 10% FBS. After centrifugation, cells were treated with 0.5 mg/mL DNase I for 5 min on ice and centrifuged at 4 °C for 10 min at 400 g. Cells were resuspended in DMEM/F12 with 10% FBS and plated in a tissue culture dish for 5 h at 37 °C with 5% CO 2 to adhere contaminating fibroblasts. Non-adhered cells were then collected, concentrated by centrifugation, resuspended in an appropriate volume of mTEC-Plus medium (described in ref. 42 ), and seeded onto Transwell-Clear permeable filter supports (Corning). Air-liquid interface (ALI) was established 2 days after cells reached confluence by feeding mTEC-Serum-Free medium 42 only in the lower chamber. Cells were cultured at 37 °C with 5% CO 2 , and media replaced every 2 days, and fixed on the indicated days. All chemicals were obtained from Sigma Aldrich unless otherwise indicated. Media were supplemented with 100 U/mL penicillin, 100 mg/mL streptomycin, and 0.25 mg/mL Fungizone (all obtained from Life Technologies). Creation of ANKRD26 −/− cells CRISPR/Cas9 was used to target ANKRD26 in Tet-On Myc-Plk4 hTERT RPE1 cells 43 . An sgRNA targeting ANKRD26 (5′-ACTAAGCCGTCCATTATACT-3′) was cloned into a lentiGuide-puro vector (52963; Addgene). HEK293FT cells were transfected with the plasmid along with lentiviral packaging plasmids psPAX2 and pMD2.G (12260 and 12259; Addgene). Virus was harvested 48 h after transfection and filtered through a 0.45 µm syringe filter (Denville). Cells were transduced with 1 mL of filtered virus supplemented with 10 µg/mL of polybrene (MilliporeSigma). Cells were selected with 3 µg/mL puromycin (MilliporeSigma) and then limiting dilution was used to obtain monoclonal lines. ANKRD26 knock out was validated in monoclonal lines via western blot (GeneTex; GTX128255).
Show full methods section
Cell cultures and drug treatment
Retinal pigment epithelial RPE-1 39 and HeLa 40 , constitutively expressed Centrin1-GFP (C1-GFP). Mouse inner-medullary collecting duct cells mIMCD3 were a gift from Dr. C Westlake (NCI/CCR-Frederick). The cultures were grown in DMEM (Invitrogen) supplemented with 10% fetal bovine serum (FBS) and 1% Penicillin Streptomycin (PS), at 37 °C, in a humified environment with 5% CO 2 . RPE-1 were starved in medium containing no serum for 24 h to induce ciliation. For immunofluorescence and imaging, cells were plated on round 25 mm, 1.5 high precision cover glasses (Warner Instruments). Cells were treated with 200 nM BI2536 inhibitor (BI; Selleckchem) to inhibit Plk1 activity and with 250 nm MLN8237 (MLN; Selleckchem) to inhibit Aurora A. mTEC cultures Cultures were established as previously described 41 , 42 . Briefly, C57BL/6 mice were sacrificed at 2–4 months of age, trachea were excised, opened longitudinally to expose the lumen, and placed in 1.5 mg/mL Pronase E in DMEM/F12 medium (Life Technologies) at 4 °C overnight. Tracheal epithelial cells were dislodged by gentle agitation and collected in DMEM/F12 with 10% FBS. After centrifugation, cells were treated with 0.5 mg/mL DNase I for 5 min on ice and centrifuged at 4 °C for 10 min at 400 g. Cells were resuspended in DMEM/F12 with 10% FBS and plated in a tissue culture dish for 5 h at 37 °C with 5% CO 2 to adhere contaminating fibroblasts. Non-adhered cells were then collected, concentrated by centrifugation, resuspended in an appropriate volume of mTEC-Plus medium (described in ref. 42 ), and seeded onto Transwell-Clear permeable filter supports (Corning). Air-liquid interface (ALI) was established 2 days after cells reached confluence by feeding mTEC-Serum-Free medium 42 only in the lower chamber. Cells were cultured at 37 °C with 5% CO 2 , and media replaced every 2 days, and fixed on the indicated days. All chemicals were obtained from Sigma Aldrich unless otherwise indicated. Media were supplemented with 100 U/mL penicillin, 100 mg/mL streptomycin, and 0.25 mg/mL Fungizone (all obtained from Life Technologies). Creation of ANKRD26 −/− cells CRISPR/Cas9 was used to target ANKRD26 in Tet-On Myc-Plk4 hTERT RPE1 cells 43 . An sgRNA targeting ANKRD26 (5′-ACTAAGCCGTCCATTATACT-3′) was cloned into a lentiGuide-puro vector (52963; Addgene). HEK293FT cells were transfected with the plasmid along with lentiviral packaging plasmids psPAX2 and pMD2.G (12260 and 12259; Addgene). Virus was harvested 48 h after transfection and filtered through a 0.45 µm syringe filter (Denville). Cells were transduced with 1 mL of filtered virus supplemented with 10 µg/mL of polybrene (MilliporeSigma). Cells were selected with 3 µg/mL puromycin (MilliporeSigma) and then limiting dilution was used to obtain monoclonal lines. ANKRD26 knock out was validated in monoclonal lines via western blot (GeneTex; GTX128255).
Immunofluorescence
Cells were fixed in 1.5% formaldehyde and post fixed in 100% methanol at −20 °C for 1–4 min, washed in 1×PBS, blocked in IF buffer (1% BSA, 0.05% Tween-20, in 1×PBS) for 15 min, and incubated with primary antibody diluted in IF buffer at 37 °C for 1 h or 4 °C overnight. After washing, cells were incubated with secondary antibody, diluted IF buffer, and incubated at 37 °C for 1 h. To visualize DNA, cells were stained with a 1:2000 dilution of Hoechst (Invitrogen 33342) in PBS. The following primary antibodies were used: Cep164 rabbit (Proteintech; 22227-1-AP, recognizing aa: 1–112) at 1:1000, FBF1 rabbit (Sigma; HPA036561, recognizing aa: 39–115) at 1:100, SCLT-1 rabbit (Sigma; HPA036561, recognizing aa:144–222) at 1:50, CCDC41/Cep83 rabbit (Sigma; HPA038161, recognizing aa: 578–677) at 1:200, ODF-2 rabbit (Proteintech; 12058-1-AP, recognizing aa: 39–181) at 1:500, TTKB2 (Sigma; HPA018113) at 1:500, ANKRD26 (GeneTex; GTX128255) at 1:1000, acetylated tubulin mouse (Sigma; T7451) at 1:10000. CF568, CF647, or AF488 conjugated secondary antibodies (Biotium; CF647 anti-mouse 20042, CF647 anti-rabbit 20045, CF568 anti-rabbit 20099, anti-mouse 20109, Invitrogen; AF488 anti-mouse A11019, AF488 anti-rabbit A11034) were used at 1:800 dilution to label primary antibodies. In addition, Cep164 was directly conjugated with CF647 using a commercial antibody labeling kit (Biotium; 92259) and used at 1:250 dilution.
Wide-field fluorescence microscopy
Wide-field images were acquired using a Nikon Eclipse Ti inverted microscope, equipped with a 64 µm pixel CoolSNAP HQ 2 camera (Photometrics) and Intensilight C-HGFIE illuminator, using 100× NA 1.42 Plan Apo objective with 1.5× magnifying tube lens. Two hundred nanometers-thick Z-sections spanning entire cell or entire centrosome, as needed, were acquired. ImageJ/Fiji (National Institute of Health, Bethesda, MD), and NIS-Elements software package was used to make maximal intensity projections and to assemble image panels.
AutoQuant X3 software
(MediaCybernetics) was used for deconvolution.
Fluorescence intensity measurement
Florescence intensity of centrosome-associated proteins was performed using ImageJ/Fiji. The cells in various cell cycle and mitosis stages were identified by DNA morphology and the centriole number. The position of the centrosomes/cilia was identified based on C1-GFP signals or by staining with acetylated tubulin. Integrated density of centrosome-associated proteins was measured within a defined area of a constant size encircling the centrosome from the summed intensity projections of Z stacks. Intensity of the background in a near proximity of each centrosome was subtracted from the signal intensity. At least 20 centrosomes were measured for each condition/cell cycle stage. Structured illumination microscopy (SIM) SIM was performed on N-SIM, Nikon Inc., equipped with 405, 488, 561, and 640 nm excitation lasers, Apo TIRF 100x NA 1.49 Plan Apo oil objective, and back-illuminated 16 µm pixel EMCCD camera (Andor, DU897). Hundred nanometers-thick Z Sections were acquired in 3D SIM mode generating 15 images per plane (5 phases, 3 angles) as a raw image, which was reconstructed to generate a super-resolution image. XYZ shift in multicolor images was corrected using 100 nm tetra-spectral fluorescent spheres (TetraSpeck beads, Invitrogen) included in the mounting medium. For surface rendering, 3D visualization of the centrosomes, and various measurements, we used NIS-elements software package and ImageJ/Fiji. Wide-field images of centrioles presented in inserts were scaled 3× with bicubic interpolation. Stochastic optical reconstruction microscopy (STORM) Cells plated on coverslips were fixed and labeled with primary antibodies.
CF647-conjugated FAB2 antibodies
(Biotium) were used at 1:800 dilutions to label primary antibodies. Before STORM imaging, samples were layered with 100 nm tetra-spectral fluorescent spheres (Invitrogen), which served as fiducial markers. Coverslips were mounted in Attofluor Cell chambers (Thermofisher) and immersed in imaging buffer (25 mM β-mercaptoethylamine, 0.5 mg/mL glucose oxidase, 67 μg/mL catalase, 10% dextrose, in 100 mM Tris at pH 8.0). 3D STORM imaging was performed on a Nikon N-STORM4.0 system using Eclipse Ti inverted microscope, Apo TIRF 100X SA NA 1.49 Plan Apo oil objective, 405, 561,488, and 647 nm excitation laser launch and a back-illuminated EMCCD camera (Andor, DU897). The 647 nm laser line (150 mW out of the fiber and ~90 mW before the objective lens) was used to promote fluorophore blinking. The 405 nm laser was used to reactivate fluorophores throughout the imaging process. The 561 nm laser was used to record the signals of fiducial markers. Fifteen thousand to 30,000-time points were acquired at a 50 Hz frame rate each 16–20 ms. NIS Elements (Nikon) was used to analyze and present the data. Each STORM analysis was repeated multiple times, and multiple images were acquired for each experiment. Prior to STORM imaging, the position of the Centrin1-GFP-labeled centrioles and of the CF647-labeled target protein was recorded in wide-field mode. 3D STORM data is presented as a projection of the entire 3D volume. The original Z color coding scheme was used to assess and to illustrate the tilt of the centrioles with respect to the coverslip. The color coding from red (close to the coverslip) to blue (further from the coverslip) presents the calibrated Z range (Supplementary Figure 8 ). When needed, STORM images were overlaid with the outline of appendages to illustrate centriole orientation. Wide-field images of centrioles analyzed by STORM were scaled 3× with bicubic interpolation for presentation. The diameters and the sizes of STORM signals were measured as illustrated in Supplementary Figure 8 . Resolution in 3D STORM experiments To determine the resolution of 3D STORM analysis, we used immunolabeled cytosolic microtubules (Supplementary Figure 9 ). Cytoplasmic microtubules are polymers of alpha and beta tubulin and have relatively constant size of ~23 nm when analyzed by EM. For 3D STORM analysis, cells were fixed cells in 1.5% glutaraldehyde in PBS for 4 min, permealized cells with 0.05% of Triton-x100 in PBS for 1 min, and labeled by primary antibody against alpha tubulin and the secondary CF647 F(ab’)2 secondary antibodies (Biotium). The average outer diameter of 3D STORM signals measured at multiple sites of the sample was 52.8 ± 5.3 nm. This value consistent with the average diameter of the MTS (23 nm), augmented for the size of the primary and secondary FAB complexes (~15 nm on each side), and is nearly identical to that of Olivier 44 using improved STORM buffers and of Bates 45 . From this data we determine that the resolution in our experiments is at least ~22 nm when using primary and secondary FAB antibody labeling, and
📊 Figures
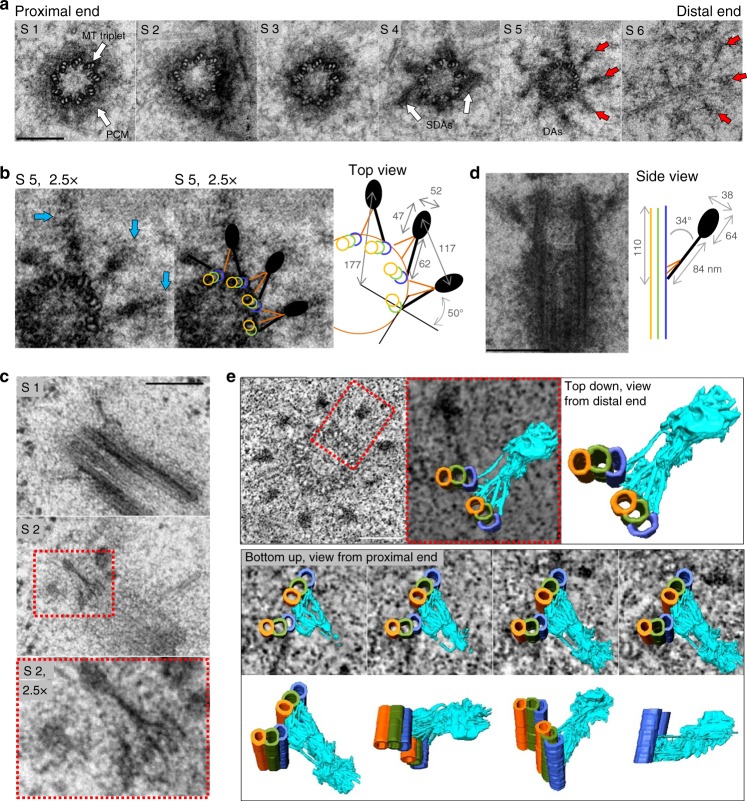
Fig. 1
Electron microscopy characterization of distal appendages. a Six 80u2009nm serial sections (S1u20136) through a mature centriole, from a HeLa cell, after chemical fixation. On the proximal end, nine m...
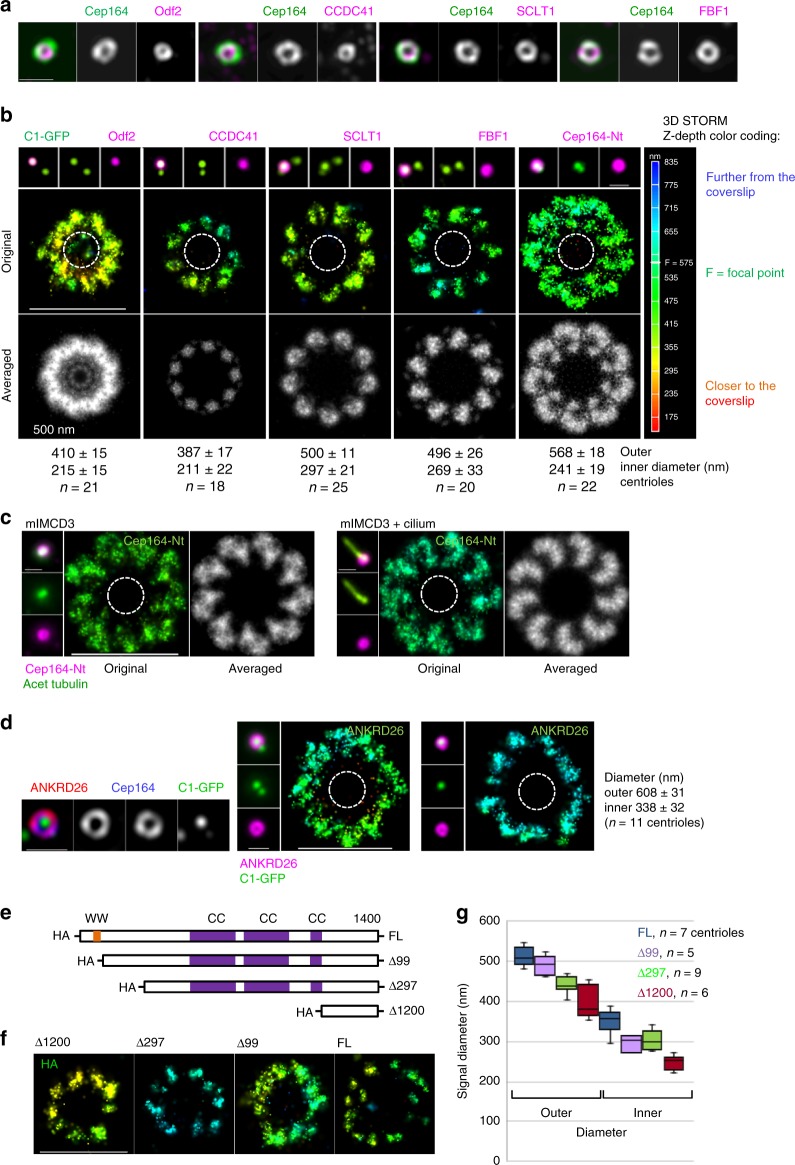
Fig. 2
3D STORM reveals the DAPu2019s unique nine-fold distribution pattern. a Two color SIM images illustrating that the DAPs, as well as the SDA protein Odf2 are organized in toroids of various diameters. ...
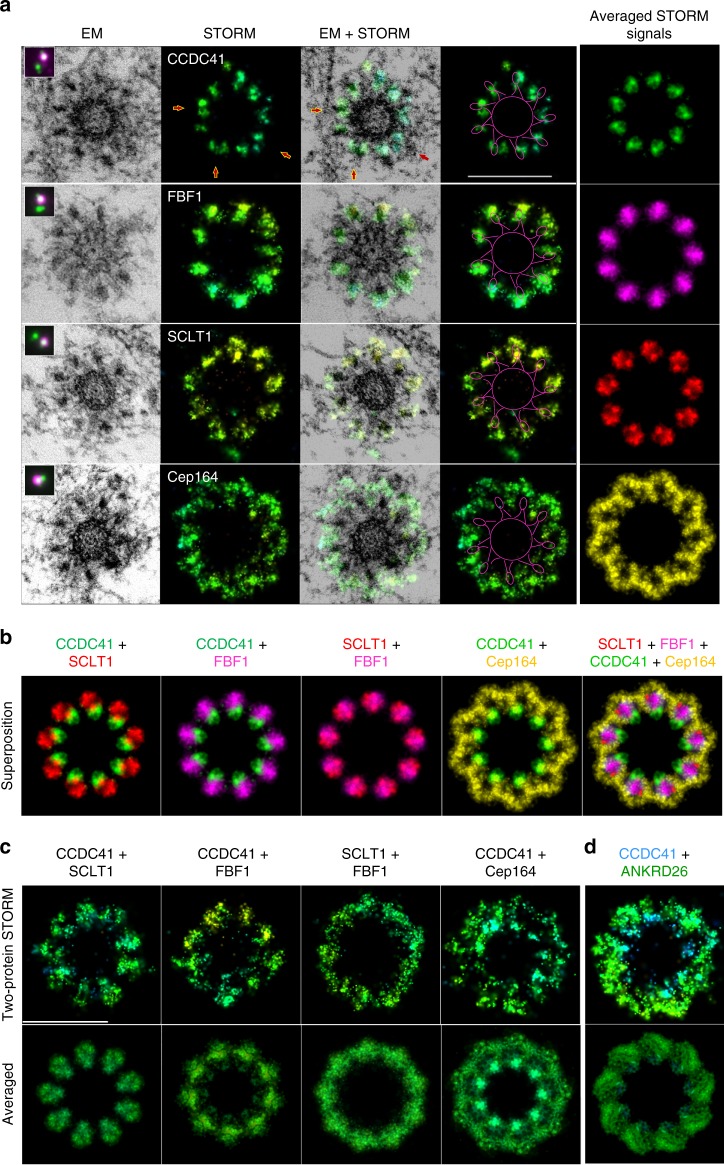
Fig. 3
Correlative STORM/EM analysis positions DAP signals with respect to EM densities. a RPE-1 C1-GFP cells were immunolabeled for the indicated DAPs and imaged first in a wide-field mode (magenta in inser...
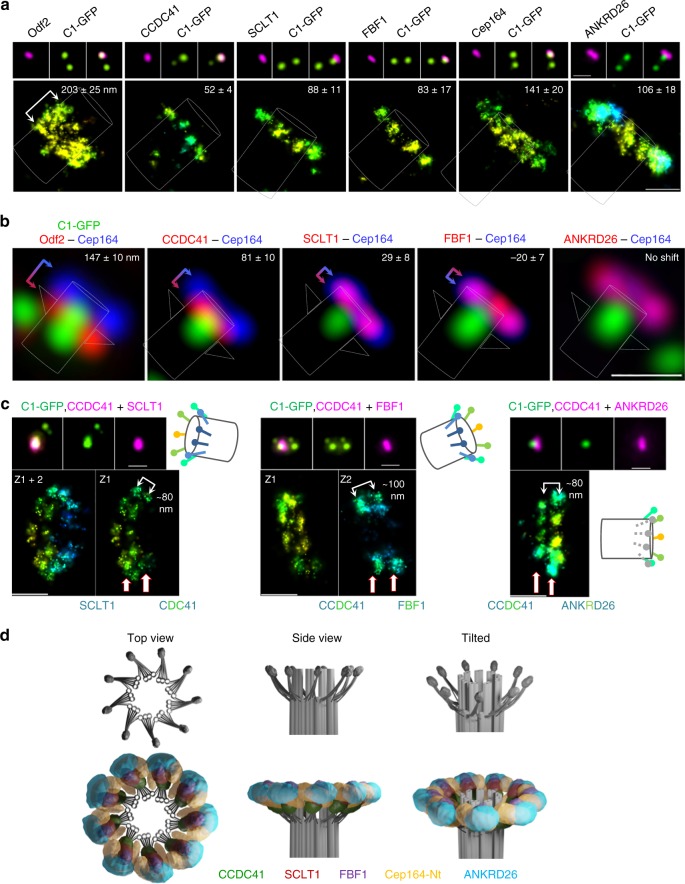
Fig. 4
Longitudinal distribution of distal appendage proteins. a A comparative wide-field and 3D STORM analysis of the SDA component Odf2 and various DAPs on longitudinally-oriented older mother centrioles i...
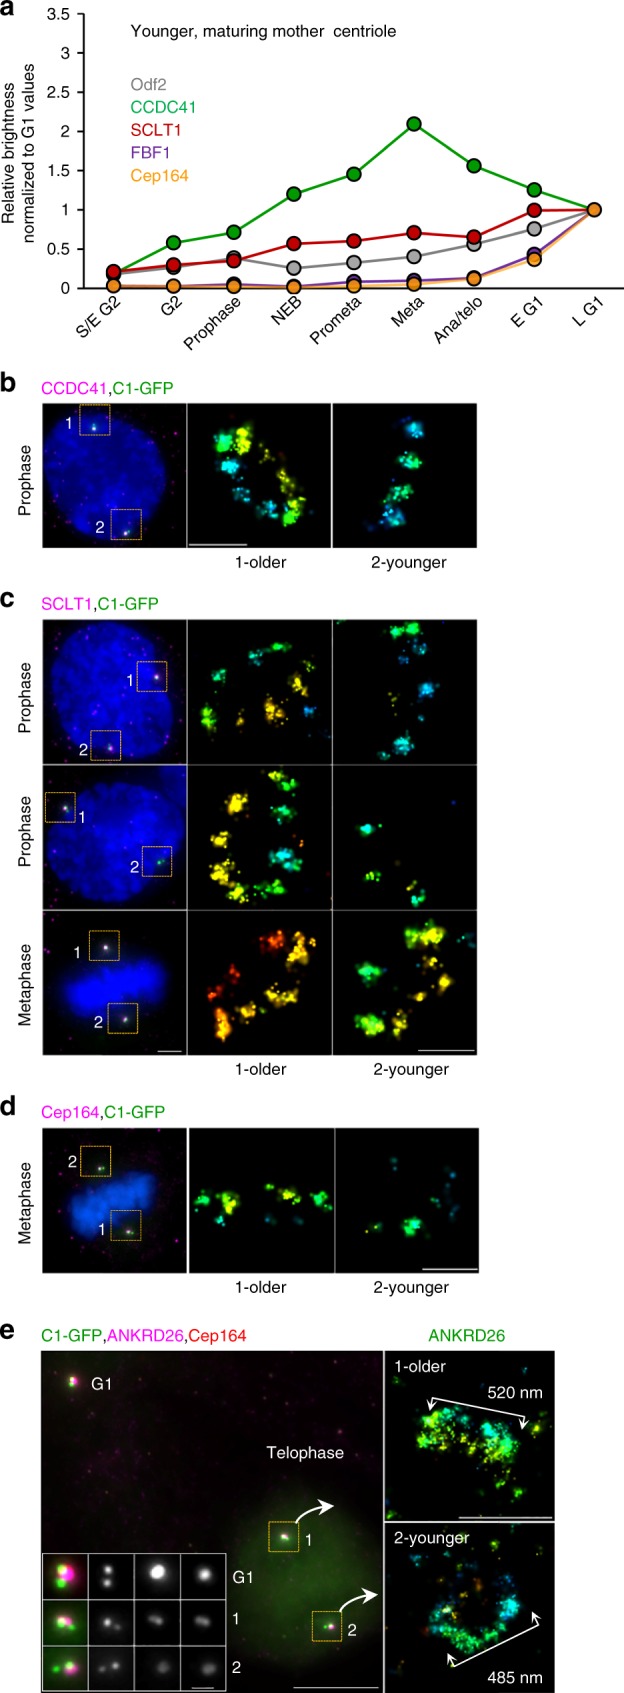
Fig. 5
Distal appendage assembly on younger mother centrioles. a Average levels of the DAPs and Odf2 associated with younger mother centrioles in RPE-1 during the cell cycle. n = 217 cells for Cep164, 135u00...
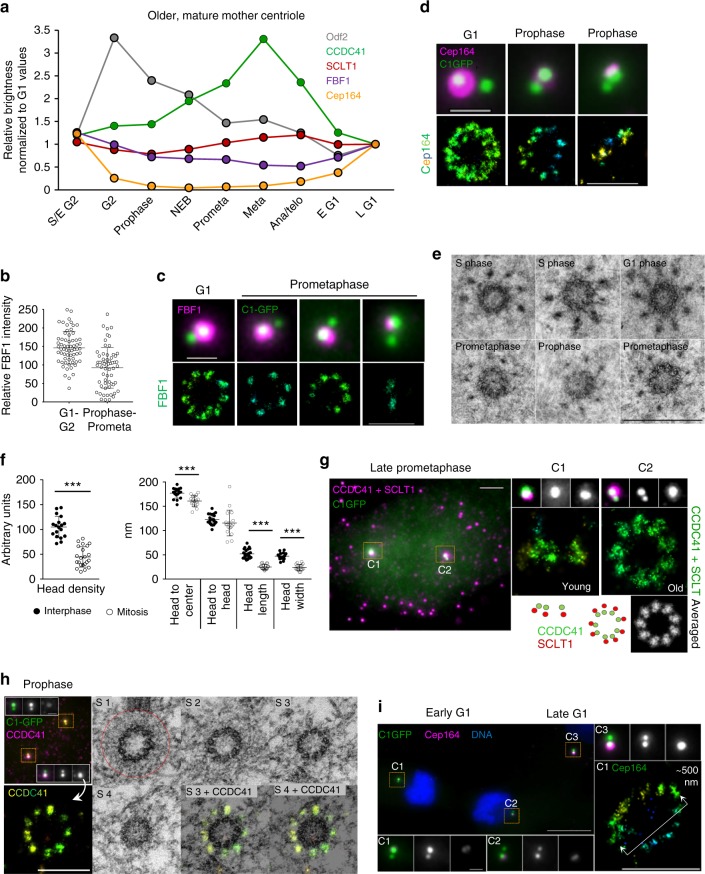
Fig. 6
Distal appendages of mature centrioles remodel before mitosis. a Average levels of the DAPs and Odf2 associated with older mother centrioles in cycling RPE-1u00a0during the cellu00a0cycle. n = 217 cel...
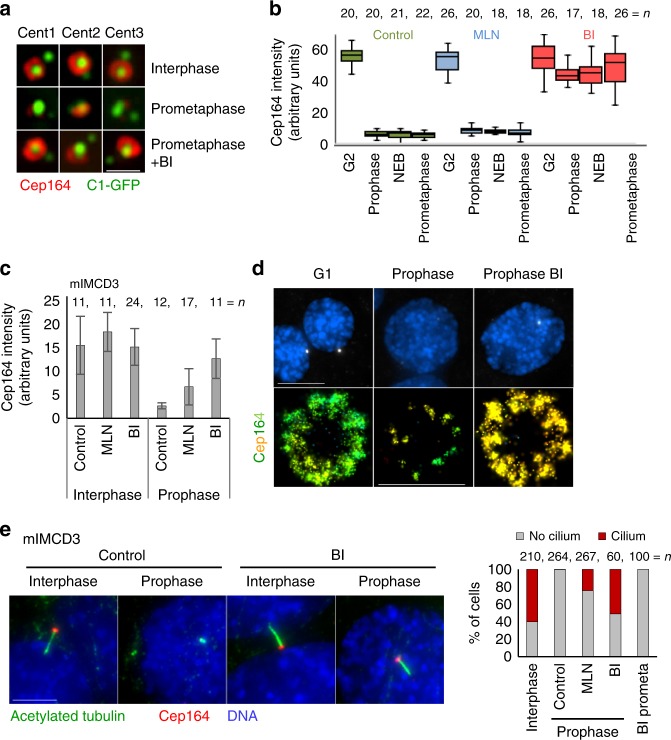
Fig. 7
Plk1 and Aurora A modulate pre-mitotic DAP dynamics. a Examples of older mother centrioles from HeLau00a0cells under different experimental conditions. Inhibition of Plk1 for 4u2009h (BI) prevents the...
Figure images are served from the NIH/NLM PubMed Central Open Access Subset or Europe PMC; copyright remains with the publishers and authors.
💬 Discussion
0 commentsNo comments yet. Be the first to start a discussion!
Leave a Comment