Abstract
Mitochondrial membranes define distinct structural and functional compartments. Cristae of the inner mitochondrial membrane (IMM) function as independent bioenergetic units that undergo rapid and transient remodelling, but the significance of this compartmentalized organization is unknown1. Using super-resolution microscopy, here we show that cytosolic IMM vesicles, devoid of outer mitochondrial membrane or mitochondrial matrix, are formed during resting state. These vesicles derived from the IMM (VDIMs) are formed by IMM herniation through pores formed by voltage-dependent anion channel 1 in the outer mitochondrial membrane. Live-cell imaging showed that lysosomes in proximity to mitochondria engulfed the herniating IMM and, aided by the endosomal sorting complex required for transport machinery, led to the formation of VDIMs in a microautophagy-like process, sparing the remainder of the organelle. VDIM formation was enhanced in mitochondria undergoing oxidative stress, suggesting their potential role in maintenance of mitochondrial function. Furthermore, the formation of VDIMs required calcium release by the reactive oxygen species-activated, lysosomal calcium channel, transient receptor potential mucolipin 1, showing an interorganelle communication pathway for maintenance of mitochondrial homeostasis. Thus, IMM compartmentalization could allow for the selective removal of damaged IMM sections via VDIMs, which should protect mitochondria from localized injury. Our findings show a new pathway of intramitochondrial quality control.
🔬 Techniques
🔭 Microscopes
💻 Software
✨ Fluorophores
🧪 Sample Preparation
🔬 Cell Lines
🏭 Microscope Brands
🧪 Reagent Suppliers
📷 Detectors
🔎 Objectives
💻 Software Details
🏛️ Research Organizations (ROR)
Affiliated research institutions:
📋 Methods
Reagents 10-N-nonyl acridine orange (NAO) (Invitrogen, #A1372) was used at 100nM for 2h. MitoCLox (Lumiprobe, #3549) was used at 200nM for 1h. Bafilomycin A1 (Cayman Chemicals, #11038) was used at 50nM for 24h. N-acetyl-cysteine (NAC) (Sigma, #A7250) was used at 5mM for 24h. MitoTempo (Sigma, #SM10737) was used at 50 μM for 24h. Oligomycin (Santa Cruz, #sc201551) was used at 10μM for 24h. Rotenone (Abcam, #ab143145) was used at 10 μM for 24h. VBIT-12 (Cayman Chemicals, #31445) was used at 10μM for 24h. ML-SA1 (Sigma, #SML0627) was used at 20μM for 24h. BAPTA-AM (ThermoFisher, #B1205) was used at 10μM for 24h. MitoTrackerCMXRos (ThermoFisher, #M7512) and MitoTracker DeepRed (ThermoFisher, # M22426 ) were used at 100nM for 15min. Dextran cascade blue (ThermoFisher, #D1796) and Dextran488 (ThermorFisher, # D22910 ). All primers used were from integrated DNA technologies (Iowa, USA). Plasmids and transfection mito-BFP was a gift from Gia Voeltz (Addgene plasmid #49151), pDEST47-MCU-GFP was a gift from Vamsi Mootha (Addgene plasmid #31732), LAMP1-GFP was a gift from Ron Vale (Addgene plasmid #16290), TRPML1-YFP was a gift from Craig Montell (Addgene plasmid # 18826), CHMP2A_GFP_N_term was a gift from Daniel Gerlich (Addgene plasmid #31805), pLNCX2-mCherry-CHMP4B was a gift from Sanford Simon (Addgene plasmid #116923). pEGFP-parkin was a gift from Edward Fon (Addgene plasmid #45875), mCherry-Drp1 was a gift from Gia Voeltz (Addgene plasmid # 49152), mCherry-Parkin was a gift from Richard Youle (Addgene plasmid #23956), TFAM-mScarlet was a gift from Stephen Tait (Addgene plasmid #129573). PolG2-tGFP was from OriGene (#RG203462). Tsg101-GFP, described in 51 was provided by Dr. Sergio Grinstein (The Hospital for Sick Children, Toronto, Canada). GFP-Arl8b, GFP-Arl8b-DN 52 , p62-mCherry 53 were provided by Dr. John Brummell (Hospital for Sick Children, Toronto, Canada) and have been previously described. mApple-TOM20, mCherry-LC3, SOD2-GFP and GFP-Ubq were generously provided by Dr. Peter Kim (The Hospital for Sick Children, Toronto) and been previously described 54 – 57 . MCU-GFP-mCherry was made for this study. mCherry insert was amplified from mCherry-Drp1 and sub-cloned into pDEST47-MCU-GFP using In-Fusion protocol from TaKaRa Bio (#638954). Insert F- 5’- GACGAGCTGTACAAGATGGTGAGCAAGGGCGAGG-3’ Insert R- 5’- TTAAACTTATCATTAACTTGTACAGCTCGTCCATGCC-3’ Vector F- 5’- TAATGATAAGTTTAAACGGGGGAGG-3’ Vector R- 5’ CTTGTACAGCTCGTCCATGCC-3’ In all cases cells were analyzed after overnight transfection with indicated plasmids using FuGENE-HD transfection reagent (Promega, #E2311). Cell culture AGS, HeLa, ModeK and Cos-1 were from American Type Culture Collection (ATCC). NCI-H292 cells, originally from ATCC were generously provided by Dr. Mauricio Terebiznik (University of Toronto at Scarborough, Toronto, Canada). Drp1 -/- and wild-type littermate control MEFs have been previously defined 58 . Parkin -/- and wild-type littermate control MEFs have been previously described 59 . Atg5 -/- and control MEFs were provided by Dr. Noboru Mizushima (University of Tokyo). Atg14 -/- , Atg16L1 -/- and corresponding wild-type littermate controls were generously provided by Dr. Tamotsu Yoshimori (Osaka University, Japan) and were previously described 60 . MEFs, HeLa and Cos-1 cells were cultured in Dulbecco’s Modified Eagles Medium (DMEM), 2mM L-glutamine, non-essential amino acids supplemented with 10% fetal-bovine serum (FBS) at 37 ° C with 5% CO 2. NCI-H292 cells were cultured in RPMI-1640 medium, 2mM L-glutamine supplemented with 10% FBS.AGS cells were cultured in Ham’s F-12 culture medium, 2mM L-glutamine supplemented with 10% FBS. HeLa cells stably expressing Mito-dsRED and EGFP-Parkin were generously provided by Dr. John Brummell (Hospital for Sick Children, Toronto, Canada) and have been previously described 61 . Previously described 62 143b ρ0 and control cells, were provided by Dr. Neal Sondheimer (Hospital for Sick Children, Toronto) and were cultured in DMEM supplemented with 10%FBS, pyruvate and 50μg/ml uridine. Generation of TRPML1 -/- MEFs Trpml1 heterozygous mice were obtained from Susan Slaugenhaupt (Massachusetts General Hospital, Harvard Medical School) and bred to obtain Trpml1 -/- and wild-type littermates. MEFs were generated as described previously 63 . Briefly, embryos were harvested ∼14 days after the appearance of a copulation plug. Tissue was cut into 1-2mm pieces and digested in 0.25% trypsin-EDTA at 37 ° C for 10min, pipetted up and down several times and incubated at 37 ° C for an additional 5min. Tissue suspension was added to MEF culture medium (DMEM+10% FBS/2mM L-glutamine/1X penicillin-streptomycin), larger tissue fragments allowed to settle and supernatant consisting of single cells was transferred to T75 flask. Once confluent, cells were serial-passaged every 5 days for several weeks. Immortalized MEFs were obtained at passage 20. TRPML1 gene knockout from MEFs was confirmed by PCR using the following primers: WT Forward: 5’- TGA GGA GAG CCA AGC TCA TT-3’ WT Reverse- 5’- TCA TCT TCC TGC CTC CAT CT-3’ NeoR- 5’- TGG CTG GAC GTA AAC TCC TC-3’ siRNA knockdowns Non-targeting siRNA (ON TARGETplus SMARTpool D-001810-10-05), siRNA targeting Tsg101 (L-049922-01-0005), siRNA targeting Vdac1 (L047345-00-0005), siRNA targeting mic60/IMMT (L-046765-01-0005), siRNA targeting Miro1(L-063998-01-0005) and siRNA targeting Snx9 (L-057505-01-0005) were from Dharmacon (Horizon Discovery, Waterbeach, UK). After overnight plating, 25nM of each siRNA was added for 48h. Media was removed and an additional 25nM of each siRNA was added for 24h. Cells were lysed for western blot analysis or fixed in 4% paraformaldehyde for imaging as described below. Knockdowns were performed using Dharmafect transfection reagent (T-2001-01, Dharmacon, Horizon Discovery). Depletion of mitochondria Mitochondria were depleted following the previously described protocol 10 . Briefly, HeLa cells stably expressing mito-dsRed and eGFP-Parkin 61 were treated with 12.5μM CCCP every 12hr for 72h. Expression of mitochondrial proteins was assessed by immunoblotting and immunofluorescence SDS-PAGE and Immunoblotting At indicated times, cells were lysed in RIPA buffer containing protease inhibitors for 20min on ice. Lysates were denatured with Lammeli sample buffer containing 2-mercaptoethanol, boiled for 10 min and proteins were resolved by SDS-PAGE and transferred to nitrocellulose membranes (BioRad). Membranes were blocked with 5% non-fat milk in TBS-T (Tris-buffered saline with 0.1% Tween-20) for 1h at RT. Membranes were incubated with primary antibody at appropriate dilution in blocking solution overnight at 4 ° C. Membranes were washed 3 times for 10 min each with TBS-T and incubated with secondary antibodies in blocking solution for 1h at room temperature (RT). Following washes (3 times for 10 min each with TBS-T), membranes were treated with ECL (Santa Cruz). Western blot visualization and densitometry analyses were performed using a Li-Cor Odyssey Fc imaging system and Image Studio. The following antibodies were used for western blot analysis in this study: β-actin (1:5000, #A5411, Sigma-Aldrich), tsg101 (1:1000, #ab83, Abcam), Vdac1 (1:1000, #ab154856, Abcam), mic60 (anti-misfiling) (1:1000, #10179-1-Proteintech), anti-Opa1 (1:1000, #27733-1-AP, Proteintech) HRP-conjugated goat-anti rabbit (1:5000, #111-035-144, Cedar lane), HRP-conjugated goat-anti mouse (1:5000, #115-035-003, Cedar lane). Unless stated otherwise, all immunoblots shown are representative of at least 3 biological replicates.
Show full methods section
Reagents 10-N-nonyl acridine orange (NAO) (Invitrogen, #A1372) was used at 100nM for 2h. MitoCLox (Lumiprobe, #3549) was used at 200nM for 1h. Bafilomycin A1 (Cayman Chemicals, #11038) was used at 50nM for 24h. N-acetyl-cysteine (NAC) (Sigma, #A7250) was used at 5mM for 24h. MitoTempo (Sigma, #SM10737) was used at 50 μM for 24h. Oligomycin (Santa Cruz, #sc201551) was used at 10μM for 24h. Rotenone (Abcam, #ab143145) was used at 10 μM for 24h. VBIT-12 (Cayman Chemicals, #31445) was used at 10μM for 24h. ML-SA1 (Sigma, #SML0627) was used at 20μM for 24h. BAPTA-AM (ThermoFisher, #B1205) was used at 10μM for 24h. MitoTrackerCMXRos (ThermoFisher, #M7512) and MitoTracker DeepRed (ThermoFisher, # M22426 ) were used at 100nM for 15min. Dextran cascade blue (ThermoFisher, #D1796) and Dextran488 (ThermorFisher, # D22910 ). All primers used were from integrated DNA technologies (Iowa, USA). Plasmids and transfection mito-BFP was a gift from Gia Voeltz (Addgene plasmid #49151), pDEST47-MCU-GFP was a gift from Vamsi Mootha (Addgene plasmid #31732), LAMP1-GFP was a gift from Ron Vale (Addgene plasmid #16290), TRPML1-YFP was a gift from Craig Montell (Addgene plasmid # 18826), CHMP2A_GFP_N_term was a gift from Daniel Gerlich (Addgene plasmid #31805), pLNCX2-mCherry-CHMP4B was a gift from Sanford Simon (Addgene plasmid #116923). pEGFP-parkin was a gift from Edward Fon (Addgene plasmid #45875), mCherry-Drp1 was a gift from Gia Voeltz (Addgene plasmid # 49152), mCherry-Parkin was a gift from Richard Youle (Addgene plasmid #23956), TFAM-mScarlet was a gift from Stephen Tait (Addgene plasmid #129573). PolG2-tGFP was from OriGene (#RG203462). Tsg101-GFP, described in 51 was provided by Dr. Sergio Grinstein (The Hospital for Sick Children, Toronto, Canada). GFP-Arl8b, GFP-Arl8b-DN 52 , p62-mCherry 53 were provided by Dr. John Brummell (Hospital for Sick Children, Toronto, Canada) and have been previously described. mApple-TOM20, mCherry-LC3, SOD2-GFP and GFP-Ubq were generously provided by Dr. Peter Kim (The Hospital for Sick Children, Toronto) and been previously described 54 – 57 . MCU-GFP-mCherry was made for this study. mCherry insert was amplified from mCherry-Drp1 and sub-cloned into pDEST47-MCU-GFP using In-Fusion protocol from TaKaRa Bio (#638954). Insert F- 5’- GACGAGCTGTACAAGATGGTGAGCAAGGGCGAGG-3’ Insert R- 5’- TTAAACTTATCATTAACTTGTACAGCTCGTCCATGCC-3’ Vector F- 5’- TAATGATAAGTTTAAACGGGGGAGG-3’ Vector R- 5’ CTTGTACAGCTCGTCCATGCC-3’ In all cases cells were analyzed after overnight transfection with indicated plasmids using FuGENE-HD transfection reagent (Promega, #E2311). Cell culture AGS, HeLa, ModeK and Cos-1 were from American Type Culture Collection (ATCC). NCI-H292 cells, originally from ATCC were generously provided by Dr. Mauricio Terebiznik (University of Toronto at Scarborough, Toronto, Canada). Drp1 -/- and wild-type littermate control MEFs have been previously defined 58 . Parkin -/- and wild-type littermate control MEFs have been previously described 59 . Atg5 -/- and control MEFs were provided by Dr. Noboru Mizushima (University of Tokyo). Atg14 -/- , Atg16L1 -/- and corresponding wild-type littermate controls were generously provided by Dr. Tamotsu Yoshimori (Osaka University, Japan) and were previously described 60 . MEFs, HeLa and Cos-1 cells were cultured in Dulbecco’s Modified Eagles Medium (DMEM), 2mM L-glutamine, non-essential amino acids supplemented with 10% fetal-bovine serum (FBS) at 37 ° C with 5% CO 2. NCI-H292 cells were cultured in RPMI-1640 medium, 2mM L-glutamine supplemented with 10% FBS.AGS cells were cultured in Ham’s F-12 culture medium, 2mM L-glutamine supplemented with 10% FBS. HeLa cells stably expressing Mito-dsRED and EGFP-Parkin were generously provided by Dr. John Brummell (Hospital for Sick Children, Toronto, Canada) and have been previously described 61 . Previously described 62 143b ρ0 and control cells, were provided by Dr. Neal Sondheimer (Hospital for Sick Children, Toronto) and were cultured in DMEM supplemented with 10%FBS, pyruvate and 50μg/ml uridine. Generation of TRPML1 -/- MEFs Trpml1 heterozygous mice were obtained from Susan Slaugenhaupt (Massachusetts General Hospital, Harvard Medical School) and bred to obtain Trpml1 -/- and wild-type littermates. MEFs were generated as described previously 63 . Briefly, embryos were harvested ∼14 days after the appearance of a copulation plug. Tissue was cut into 1-2mm pieces and digested in 0.25% trypsin-EDTA at 37 ° C for 10min, pipetted up and down several times and incubated at 37 ° C for an additional 5min. Tissue suspension was added to MEF culture medium (DMEM+10% FBS/2mM L-glutamine/1X penicillin-streptomycin), larger tissue fragments allowed to settle and supernatant consisting of single cells was transferred to T75 flask. Once confluent, cells were serial-passaged every 5 days for several weeks. Immortalized MEFs were obtained at passage 20. TRPML1 gene knockout from MEFs was confirmed by PCR using the following primers: WT Forward: 5’- TGA GGA GAG CCA AGC TCA TT-3’ WT Reverse- 5’- TCA TCT TCC TGC CTC CAT CT-3’ NeoR- 5’- TGG CTG GAC GTA AAC TCC TC-3’ siRNA knockdowns Non-targeting siRNA (ON TARGETplus SMARTpool D-001810-10-05), siRNA targeting Tsg101 (L-049922-01-0005), siRNA targeting Vdac1 (L047345-00-0005), siRNA targeting mic60/IMMT (L-046765-01-0005), siRNA targeting Miro1(L-063998-01-0005) and siRNA targeting Snx9 (L-057505-01-0005) were from Dharmacon (Horizon Discovery, Waterbeach, UK). After overnight plating, 25nM of each siRNA was added for 48h. Media was removed and an additional 25nM of each siRNA was added for 24h. Cells were lysed for western blot analysis or fixed in 4% paraformaldehyde for imaging as described below. Knockdowns were performed using Dharmafect transfection reagent (T-2001-01, Dharmacon, Horizon Discovery). Depletion of mitochondria Mitochondria were depleted following the previously described protocol 10 . Briefly, HeLa cells stably expressing mito-dsRed and eGFP-Parkin 61 were treated with 12.5μM CCCP every 12hr for 72h. Expression of mitochondrial proteins was assessed by immunoblotting and immunofluorescence SDS-PAGE and Immunoblotting At indicated times, cells were lysed in RIPA buffer containing protease inhibitors for 20min on ice. Lysates were denatured with Lammeli sample buffer containing 2-mercaptoethanol, boiled for 10 min and proteins were resolved by SDS-PAGE and transferred to nitrocellulose membranes (BioRad). Membranes were blocked with 5% non-fat milk in TBS-T (Tris-buffered saline with 0.1% Tween-20) for 1h at RT. Membranes were incubated with primary antibody at appropriate dilution in blocking solution overnight at 4 ° C. Membranes were washed 3 times for 10 min each with TBS-T and incubated with secondary antibodies in blocking solution for 1h at room temperature (RT). Following washes (3 times for 10 min each with TBS-T), membranes were treated with ECL (Santa Cruz). Western blot visualization and densitometry analyses were performed using a Li-Cor Odyssey Fc imaging system and Image Studio. The following antibodies were used for western blot analysis in this study: β-actin (1:5000, #A5411, Sigma-Aldrich), tsg101 (1:1000, #ab83, Abcam), Vdac1 (1:1000, #ab154856, Abcam), mic60 (anti-misfiling) (1:1000, #10179-1-Proteintech), anti-Opa1 (1:1000, #27733-1-AP, Proteintech) HRP-conjugated goat-anti rabbit (1:5000, #111-035-144, Cedar lane), HRP-conjugated goat-anti mouse (1:5000, #115-035-003, Cedar lane). Unless stated otherwise, all immunoblots shown are representative of at least 3 biological replicates.
Immunofluorescence
Cells cultured on glass coverslips were fixed overnight in 4% paraformaldehyde (Electron Microscopy Sciences) in 1X PBS at 4 ° C. Following 3 washes in 1X PBS cells were permeabilized with ice-cold methanol for 5min, washed and blocked in 5% BSA in PBS for 1h at RT. Cells were incubated with primary antibodies diluted in blocking solution for 1h at RT. Following 3 washes with PBS, secondary antibody incubations (1:1000) were performed for 1h at RT in blocking solution, followed by nuclear staining with DAPI (5 μg/ml). Coverslips were mounted using Dako Fluorescence Mounting Media (Agilent Technologies). The following primary antibodies were used for immunofluorescence analysis: anti-TOM20 (Proteintech, #11802-1-AP, 1:500), anti-cytochrome C (Abcam, #ab110325, 1:500), anti-PDH (Abcam, #ab110333, 1:500), anti-Atp5L (Proteintech, #16483, 1:500), anti-Atp5α (Abcam, #ab14748, 1:500), anti-VDAC1 (Abcam, #ab154856, 1:500), anti-COXIV (Proteintech, #11242-1-AP, 1:500), anti-UCQCRC2 (Proteintech, #14742-1-AP, 1:500), anti-8OHdG (Santa Cruz, #393871, 1:100), anti-CD63 (Abcam, #ab8219, 1:100), anti-LBPA (Echelon Biosciences, #z-PLBPA, 1:500), anti-ALG2 (Proteintech, #12303-1-AP, 1:100). The following secondary antibodies were used for immunofluorescence analysis at 1:1000 dilution: Goat-anti-rabbit Alexa 647 (Invitrogen, # A21244), donkey-anti-rabbit Alexa 405 (Invitrogen, # A48258 ), goat-anti-rabbit Alexa 488 (Invitrogen, # A11011), goat-anti-mouse Alexa 488 (Invitrogen, # 11029), goat-anti-mouse Alexa 647 (Invitrogen, #A21235), goat-anti-rat Alexa 647 (Invitrogen, #A21247). For Airyscan imaging, cells fixed with 4% paraformaldehyde (4 ° C, overnight) were quenched with 50mM ammonium chloride for 10min and washed with 1xPBS+5% FBS. Cells were permeabilized for 5min with ice cold methanol and blocked in 1xPBS+10% FBS for 1h at RT. Cells were incubated with indicated primary antibodies diluted in blocking solution for 1h at RT, washed with 1xPBS+5% FBS, followed by incubation with secondary antibodies (1:2000), washed and mounted onto slides.
Microscopy
Unless stated otherwise, all fluorescent micrographs shown are high-resolution Airyscan images and time-lapse imaging was performed using Zeiss LSM880 Airyscan confocal using 63x/1.4 PlanApo objective. Spinning disc confocal images were acquired using 63x/1.4 NA objective using a Quorum spinning disc confocal microscope, consisting of an inverted fluorescence microscope (DMI6000B; Leica), an EM-CCD camera (Hamamatsu Photonics) and spinning disc confocal scan head. The equipment was controlled by Volocity acquisition software (Perkin Elmer). Z-stacks obtained were 300nm apart. For live-cell imaging, cells were plated on glass coverslips and transfected with mito-BFP overnight. To label lysosomes, cells were incubated with dextran488 (25μg/ml) or dextran cascade blue (25μg/ml) overnight, washed and chased for an additional 3-5h in full media before imaging. 15min prior to live cell imaging cells were incubated with 100nM MitoTracker CMXRos in full media at 37 ° C. Media was removed and cells washed with dye-free media before moving to a pre-warmed microscope stage. High-resolution Airyscan images were acquired using a 63x Oil DIC M27 objective every 5 sec. Prior to analysis, raw image files were automatically processed into deconvoluted Airyscan images using the Zen software (Zeiss). For analysis of lipid peroxidation, cells transfected with mito-BFP were incubated with MitoCLox followed by incubation with mitotracker DeepRed prior to imaging. Where indicated, cells were treated with 500μM H 2 O 2 for 30min as positive control. Images were acquired using a Quorum spinning disc confocal microscope with excitation at 491 and 561 nm. Confocal imaging for CLEM experiments was performed using a Leica SP8 confocal microscope where z-stack slices were set at 200nm.
Correlative light and electron microscopy Plasmid DNA
(LAMP1-GFP and mito-BFP) was electroporated into cells using the Neon system (Invitrogen). Cells were resuspended at 5×10 6 cells in 100µl buffer R. 10 µl of cell/1 µg plasmid DNA mix was aspirated into a Neon pipette and electroporated in electroporation buffer ‘E’ at 1350 V for 30 ms with 1 pulse. Cells were then plated in glass bottom 35 mm MatTek dishes for confocal imaging and electron microscopy studies. For CLEM analysis of Tsg101 depleted cells, cells were treated with Tsg101 siRNA for 72h prior to electroporation of plasmid DNA. Before fixation, cells were incubated with 100nM MitoTracker Deep Red for 20min at 37 o C. Samples were then fixed by adding a mixture of 8% PFA in 200 mM HEPES buffer to culture medium (v/v) and incubated at RT for 15 min, then replaced with 4% PFA in 100mM HEPES for 30 min before imaging by confocal microscopy. Cells were imaged on a Leica SP8 confocal microscope using a 63X objective (oil, 1.4NA) and z-stacks were acquired 150nm/slice (1024x1024 resolution). A substack containing the event of interest was acquired at 2048x2048 resolution for subsequent CLEM analysis. Following fluorescence imaging, samples were transferred to 1% glutaraldehyde in 100 mM HEPES buffer.
Resin embedding
Fluorescently imaged samples were processed for CLEM in a Biowave Pro (Pelco, USA) with use of microwave energy and vacuum. Cells were twice washed in HEPES (Sigma-Aldrich H0887) at 250 W for 40 s, post-fixed using a mixture of 2% osmium tetroxide (Taab O011) 1.5% potassium ferricyanide (Taab, P018) (v/v) at equal ratio for 14 min at 100W power (with/without vacuum 20 ”Hg at 2-min intervals). Samples were washed with distilled water twice on the bench and twice again in the Biowave 250 W for 40 s. Samples were stained with 1 % aqueous uranyl acetate (Agar scientific AGR1260A) in distilled water (w/v) for 14 min at 100 W power (with/without vacuum 20 ”Hg at 2 min intervals) then washed using the same settings as before. Samples were dehydrated using a step-wise acetone series of 50, 75, 90 and 100 %, then washed 4x in absolute acetone at 250 W for 40 s per step. Samples were infiltrated with a dilution series of 25, 50, 75, 100 % Durcupan ACM® (Sigma-Aldrich 44610) (v/v) resin to propylene oxide. Each step was for 3 min at 250 W power (with/without vacuum 20 ”Hg at 30 s intervals). Samples were then cured for a minimum of 48 h at 60 o C.
Sample trimming and transmission electron micrograph acquisition
Referring to grid coordinates, the sample block was trimmed, coarsely by a razor blade then finely trimmed using a 35 o ultrasonic, oscillating diamond knife (DiATOME, Switzerland) set at a cutting speed of 0.6 mm/s, a frequency set by automatic mode and a voltage of 6.0 V, on a ultramicrotome EM UC7 (Leica Microsystems, Germany) to remove all excess resin surrounding the ROI. Images were acquired using a 120 kv Tecnai G2 Spirit BioTwin (FEI company) with OneView Camera (Gatan). CLEM image alignment Fluorescent .LIF files were converted to tiff file format and liner adjustments made to brightness and contrast using FIJI (version 2.0.0-rc-69/1.52p). Images were aligned to EM micrographs with Icy 2.0.3.0 software (Institut Pasteur, France), using the ec-CLEM Version 1.0.1.5 plugin. No less than 10 independent fiducials were chosen per alignment for 2D image registration. When the fiducial registration error was greater than the predicted registration error, a non-rigid transformation (a nonlinear transformation based on spline interpolation, after an initial rigid transformation) was applied as previously described 64 .
Image analysis Quantification of VDIMs
Unless stated otherwise, all quantifications were performed on maximum intensity projections of images acquired using a Spinning disc confocal microscope, using Image J (Fiji). OMM was labeled using anti-TOM20 antibodies and mitochondrial IMM labeled using mitotracker. ROIs were selected around cells and duplicated and a mask of each channel was generated. To do this, a manual threshold was applied to each channel and ‘erode’ command was applied to the mitotracker channel and ‘dilate’ command was applied to the TOM20 channel to expand the mask by 1 pixel. The TOM20 mask was subtracted from the mitotracker mask and the result was used to measure the number and size of VDIMs using “Analyze particles” plugin. Quantifications of recruitment of the different markers to VDIMs were performed manually using maximum intensity projections of Airyscan super-resolution images. Time-lapse images For fluorescence intensity measurements from time-lapse images, processed Airyscan images were analyzed using ImageJ (Fiji) software. ROIs were selected around entire mitochondria from where the VDIM pinched off at each time frame, and mitotracker intensity was measured. For analysis of VDIMs, dextran-labeled lysosomes were used to select the region of interest and the mean fluorescence intensity for indicated channels within the ROI was measured over time. 3D-reconstruction Surface reconstruction of fluorescence images acquired using Airyscan images as described above were processed using Imaris Bitplane 9.5 software using “surface” feature and default parameters (Oxford Instruments) Statistical analysis Data shown are mean+/- SEM from independent biological replicates. As indicated, comparison between 2 groups was performed using unpaired 2-tailed Student’s t -test, and comparison between multiple groups was performed using one-way ANOVA with Tukey’s multiple comparison test using Prism software (GraphPad Software). P values calculated are indicated. 95% confidence interval was used to determine statistical significance and P
📊 Figures
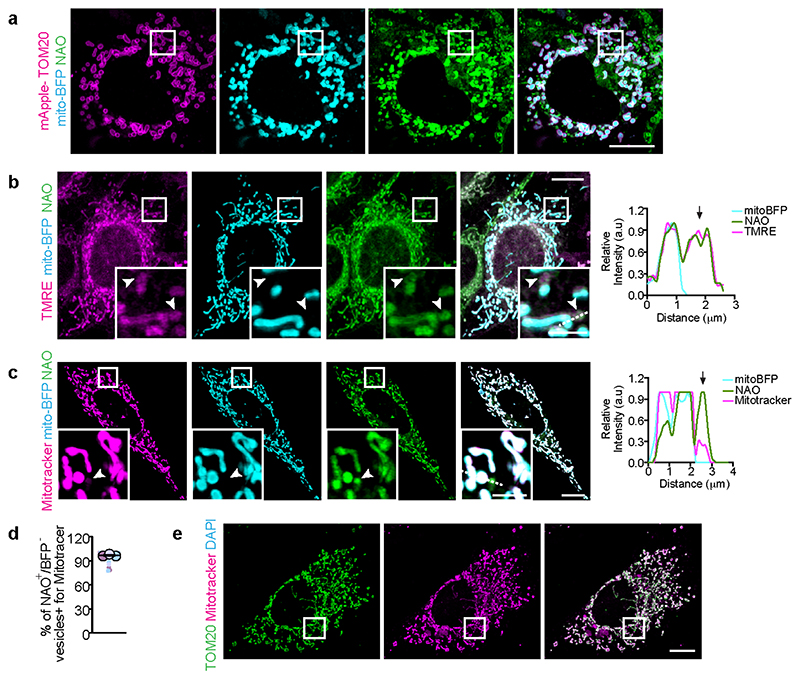
ED Fig. 1
Cytosolic IMM-derived vesicles lack matrix and OMM
a , TOM20 and NAO localization. Inner mitochondrial membranes were labeled with NAO (green) in cells expressing mito-BFP (cyan) and mApple-TOM20 (magenta). Higher magnifications of indicated regions a...
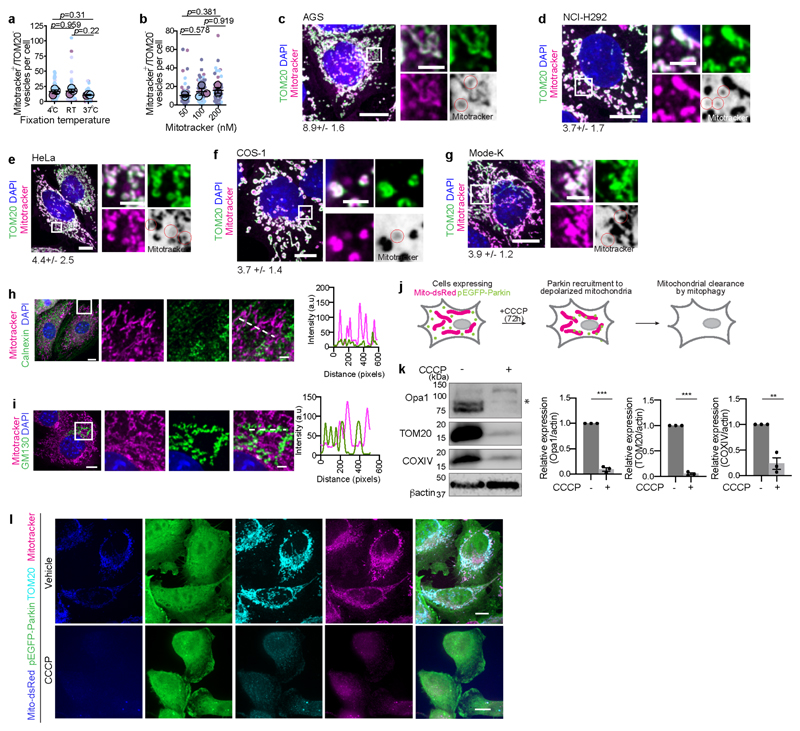
ED Fig. 2
Validating specificity of IMM in VDIMs
a , Effect of fixation conditions on mitotracker + /TOM20 - vesicles. Cells labeled with mitotracker (100nM, 15min, 37 o C) were either fixed for 15 min at room temperature (RT), 4 o C overnight or at...
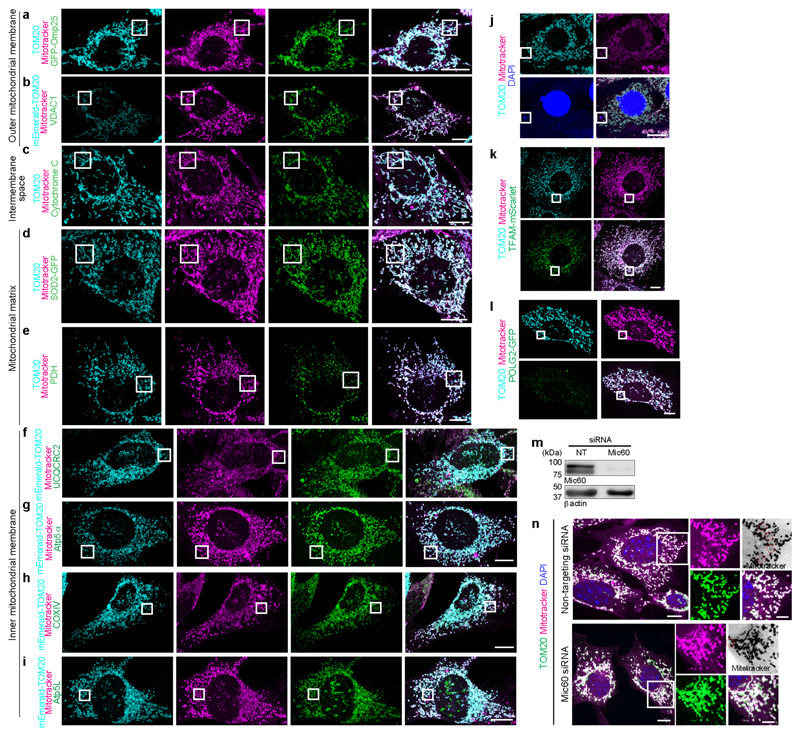
ED Fig. 3
VDIMs are derived from the IMM
a-i , Localization of mitotracker along with markers associated with different mitochondrial compartments. a , b , Representative images showing localization of mitotracker (magenta) and OMM localized...
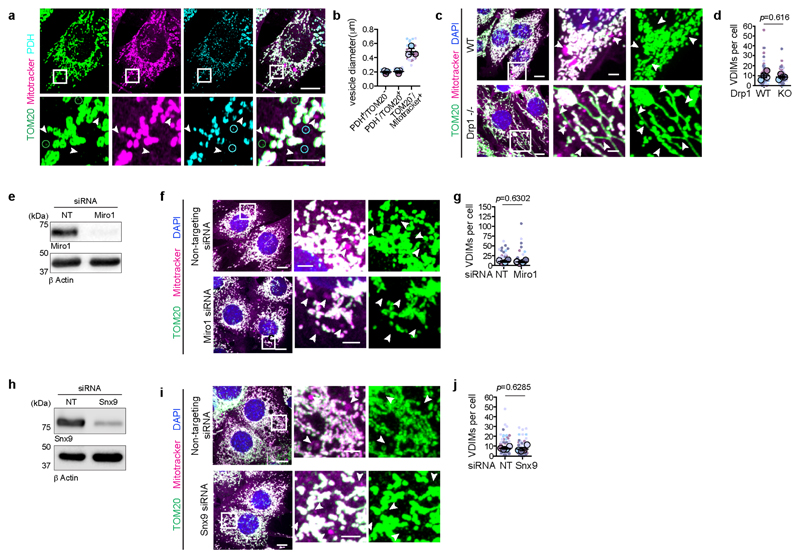
ED Fig. 4
VDIMs are distinct from MDVs and MDCs
a , VDIMs are larger than MDVs. Size difference between the Tom20 (green) or PDH (cyan) positive mitochondria derived vesicles (MDVs) (indicated by open circles), and mitotracker + /TOM20 - vesicles (...
ED Fig. 5
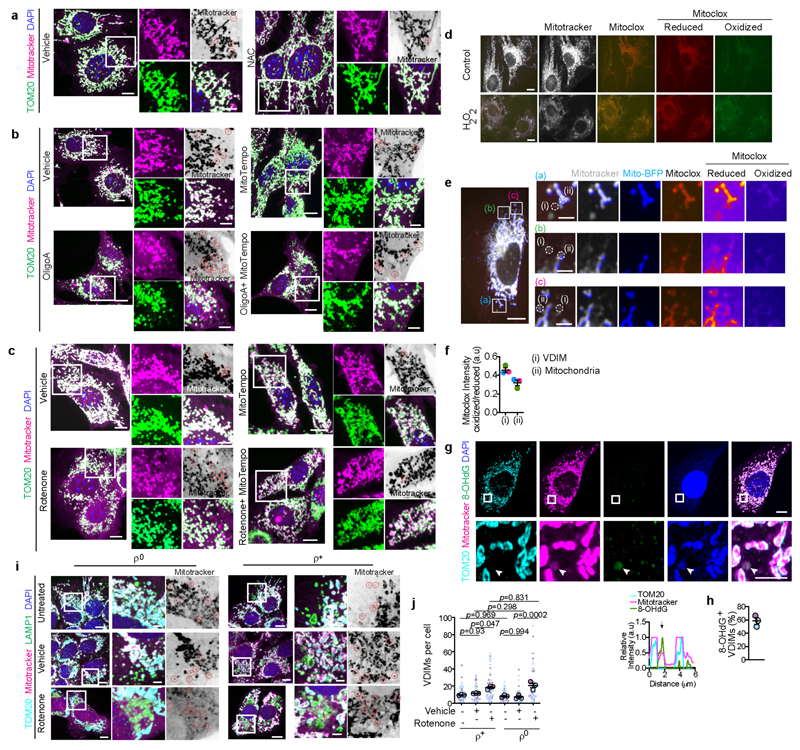
VDIM formation for intramitochondrial QC
a , VDIM formation is inhibited by quenching ROS. Representative spinning disc confocal micrographs showing the effect of NAC on VDIM formation. Red circles in the inverted color mitotracker micrograp...
ED Fig. 6
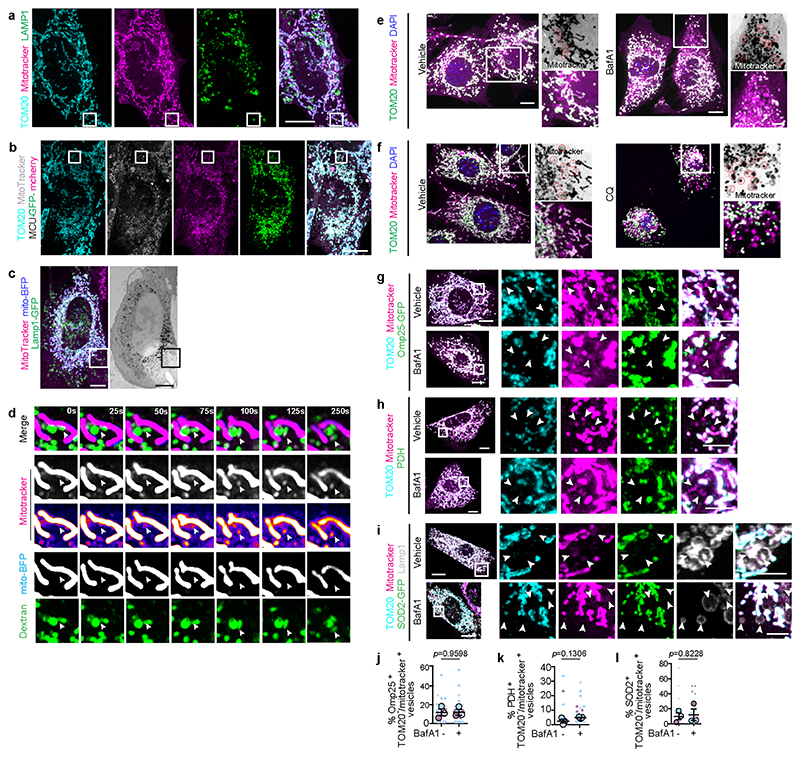
VDIMs are delivered to lysosomes for degradation
a , Mitotracker (magenta), TOM20 (cyan) and LAMP1 (green) localization. Higher magnifications of indicated regions are shown in Fig.3a . b , Localization of mitotracker (grey), TOM20 (cyan) and MCU-GF...
ED Fig. 7
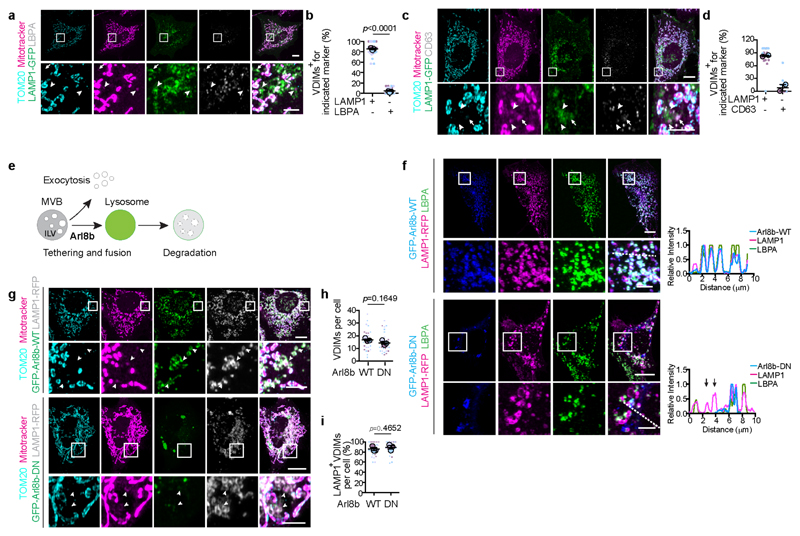
VDIMs are not multivesicular bodies (MVB)
a , Representative images showing mitotracker (magenta), TOM20 (cyan), LBPA (grey) in cells expressing LAMP1-GFP (green). Bottom : Higher magnification of indicated regions. Arrowheads indicate VDIMs ...
ED Fig. 8
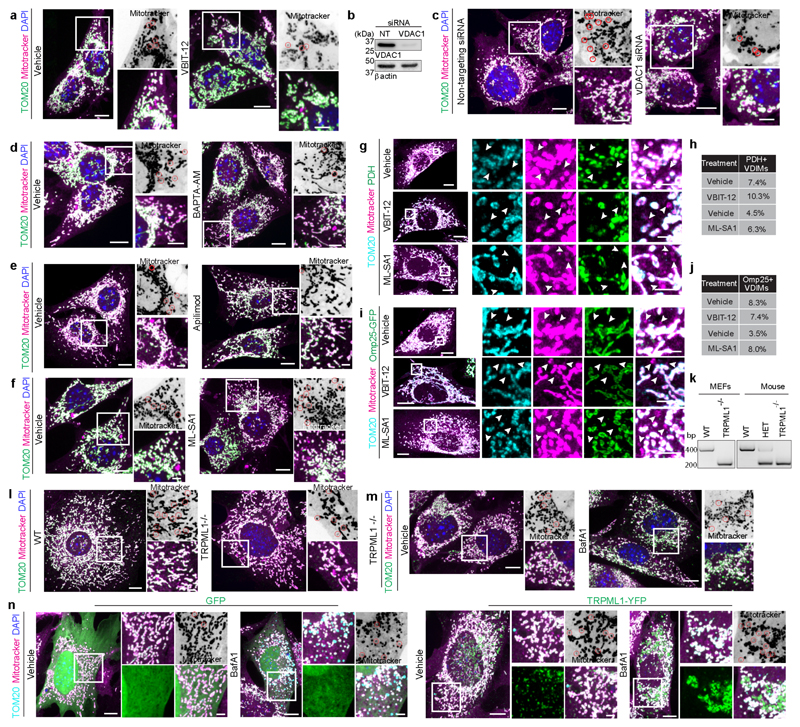
VDAC1 and TRPML1 mediate VDIM formation
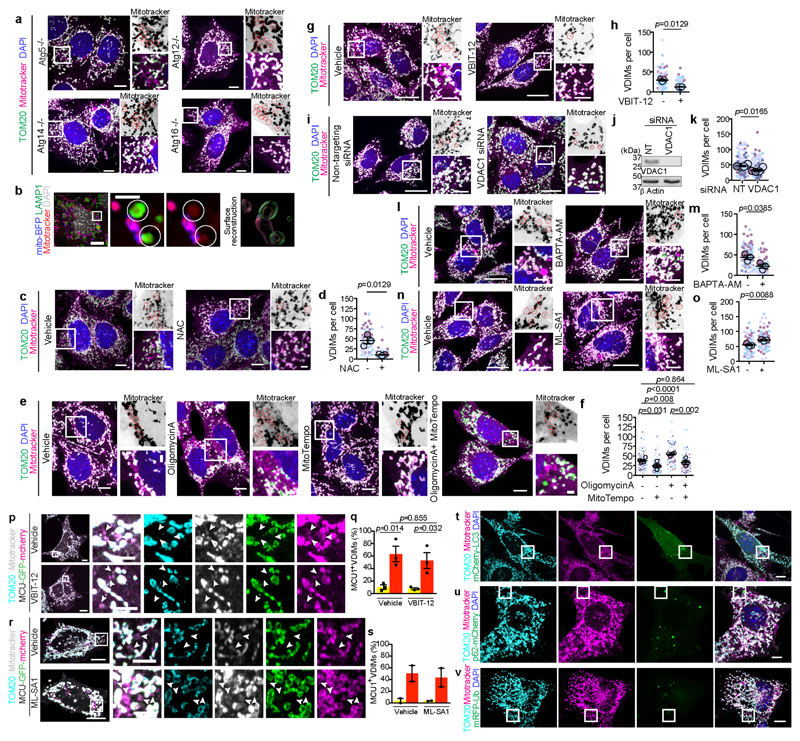
a , VDIM formation in cells treated with vehicle or VBIT-12. b , Representative western blot showing the efficiency of VDAC1 knockdown (n=4 experiments). c , VDIM formation in cells treated with indic...
ED Fig. 9
VDIMs form independently of macroautophagy
a , VDIM formation in MEFs lacking Atg5, Atg12, Atg14 and Atg16. Right : Higher magnification of indicated regions. b , VDIM formation in Atg5-/- MEFs. Representative confocal micrographs showing VDIM...
ED Fig. 10
VDIMs form by ESCRT-mediated, microautophagy-like process
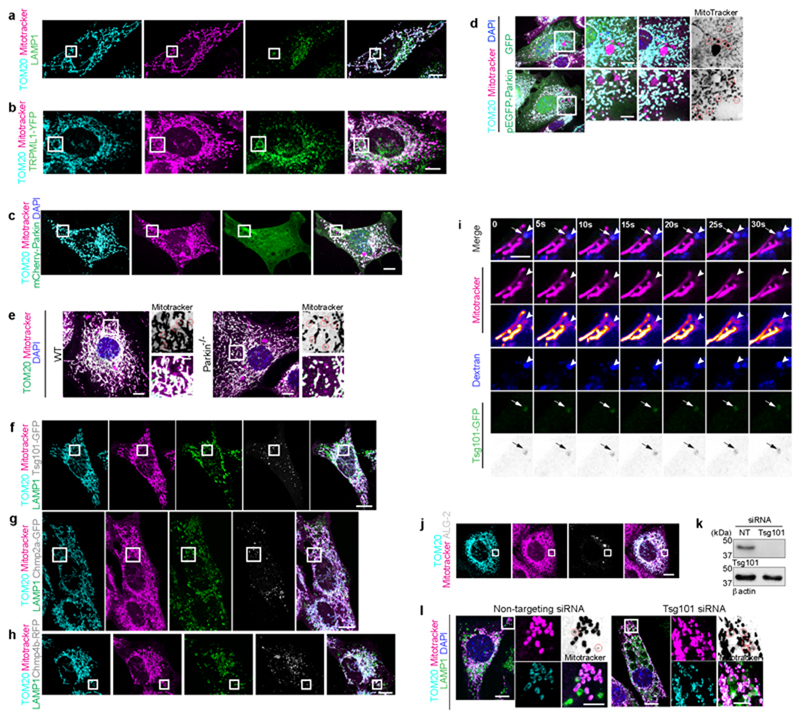
a , Representative images showing TOM20 (cyan), mitotracker (magenta) and LAMP1 (green). Higher magnifications of indicated regions are shown in Fig.5g . b , Representative images showing localization...
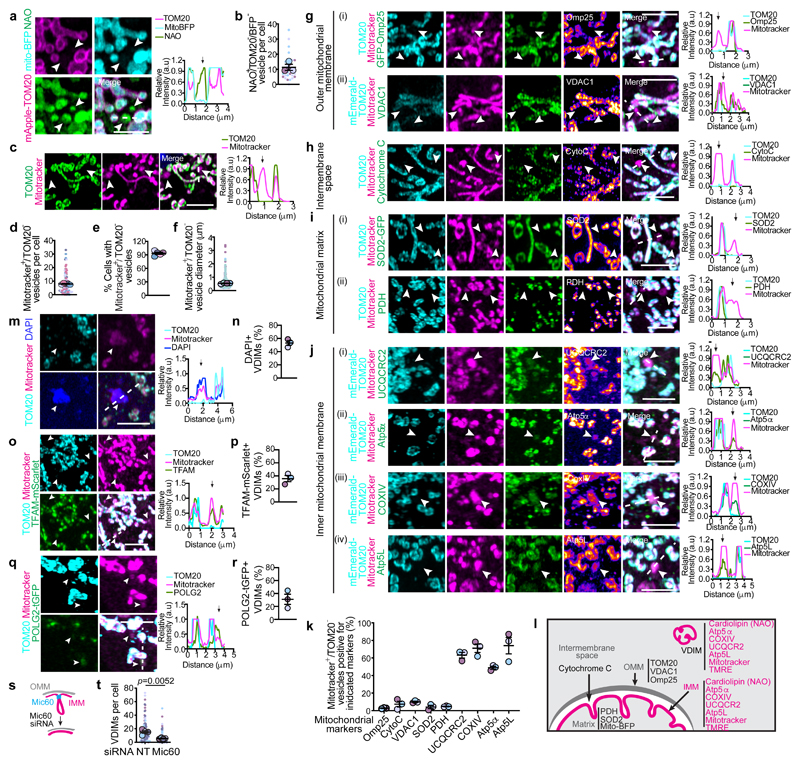
Fig. 1
Selective sorting of mitochondrial inner membrane proteins into VDIMs
a , Cytosolic TOM20 - /NAO + / mito-BFP - vesicles (arrowheads) in MEFs expressing mito-BFP (cyan, matrix) and mApple-TOM20 (magenta, OMM), stained with NAO (green, IMM). Right: Pixel intensity plot f...
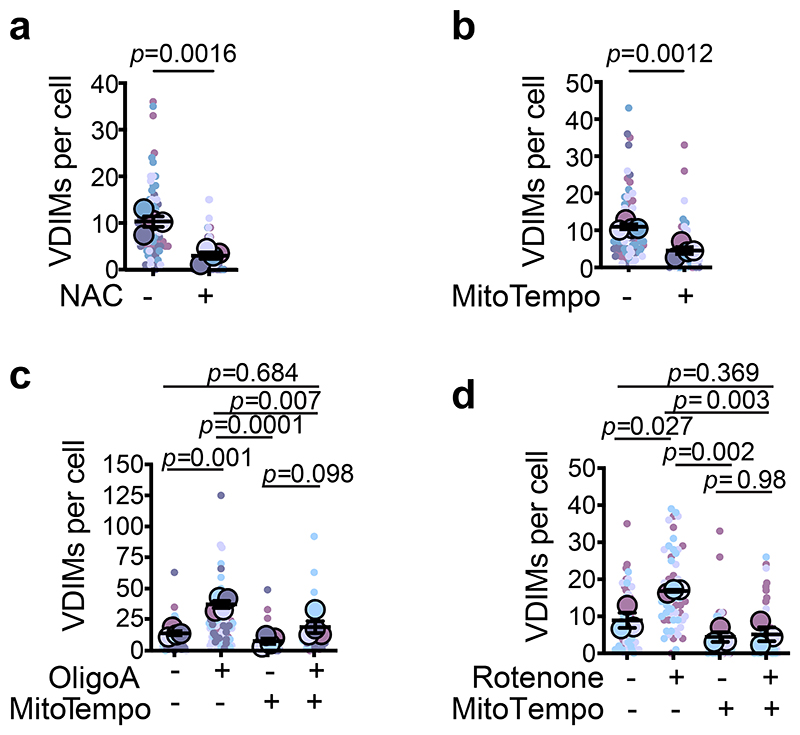
Fig. 2
VDIM formation as an intramitochondrial quality control mechanism
a , b , Effect of scavenging ROS on VDIM formation. Cells were treated with ( a) vehicle (-) and NAC (+) (n=80 cells, 4 experiments), or ( b ) mitoTempo (n=81 cells, 4 experiments). c , d , Effect of ...
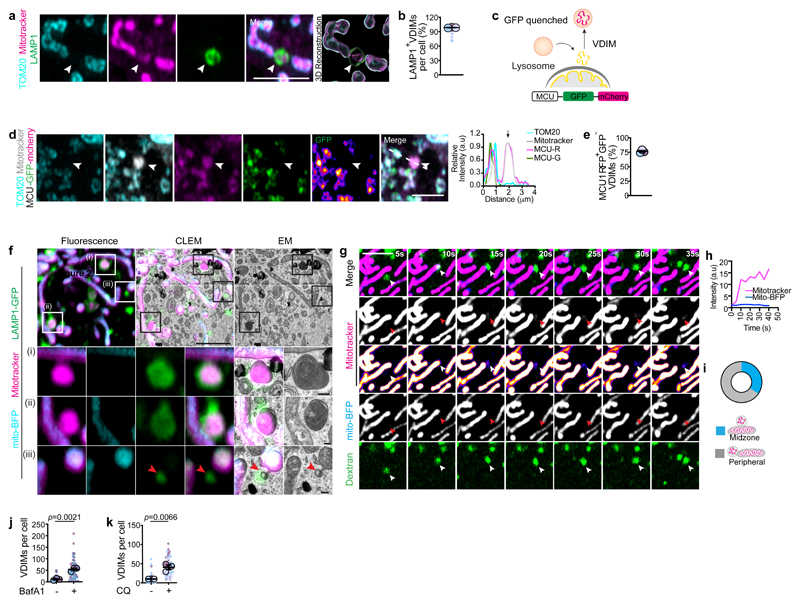
Fig. 3
VDIMs are delivered to lysosomes for degradation
a , Localization of VDIMs in LAMP1 + lysosomes. Right : 3D reconstruction. Arrowheads indicate the VDIMs. b , Number LAMP1positive VDIMs in experiments as in ( a ) (n= 36 cells, 3 experiments). c , Sc...
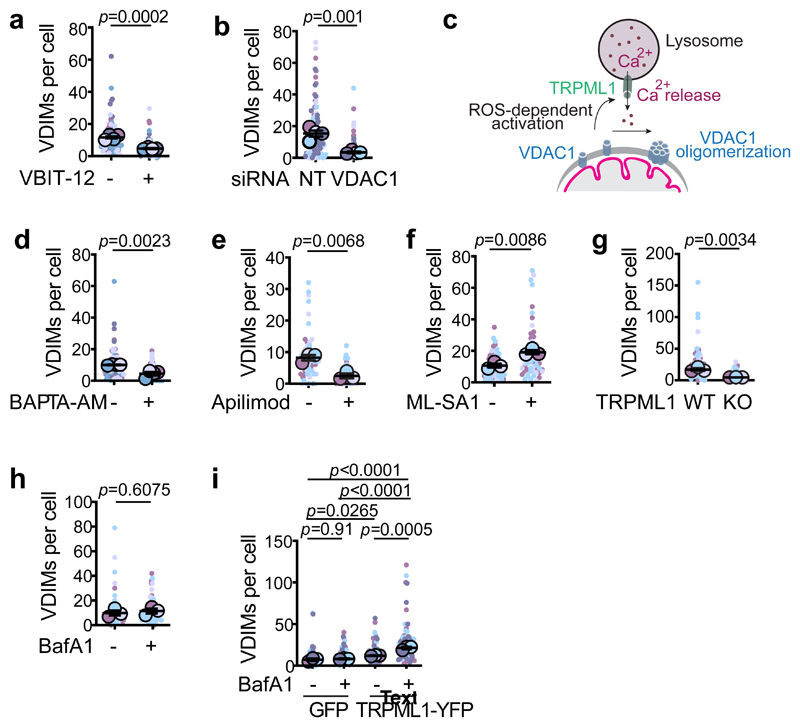
Fig. 4
VDAC1 and lysosomal Ca 2+ channel TRMPL1 mediate VDIM formation
a , Number of VDIMs in cells treated with VBIT-12 (n= 81 cells for vehicle, 83 for VBIT-12, 4 experiments). b , Number of VDIMs in cells treated with scrambled (NT) or VDAC1 siRNA (n= 36 cells, 4 expe...
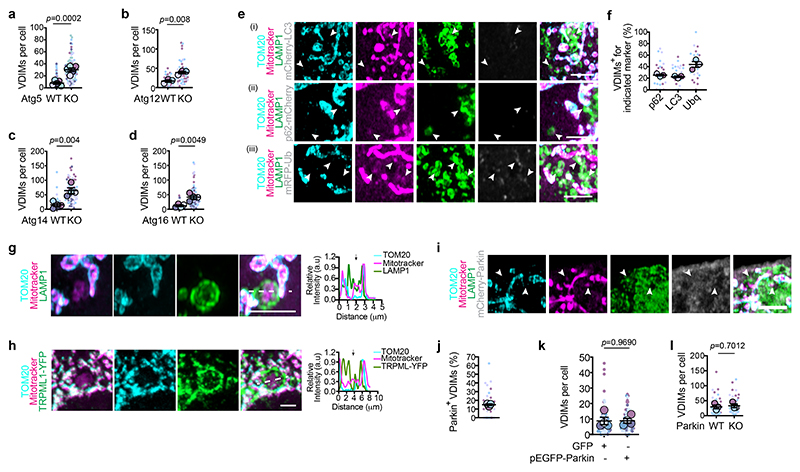
Fig 5
VDIMs form by engulfment of IMM by lysosomes in a microautophagy-like process
a-d , Number of VDIMs in ( a ) Atg5 -/- (KO) (n= 101 WT, 98 KO cells, 5 experiments), ( b ) Atg12 -/- (KO) (n= 40 WT, 46 KO cells, 3 experiments), ( c ) Atg14 -/- (KO) (n= 61 WT, 91 KO cells, 4 experi...
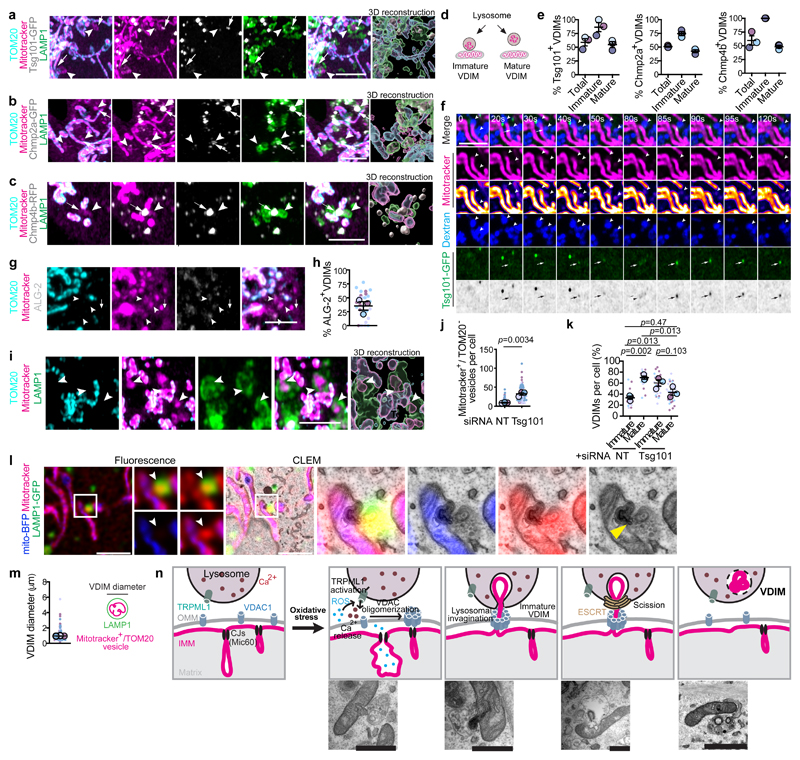
Fig 6
The ESCRT complex mediates VDIM formation
a , Tsg101-GFP, b , Chmp2a-GFP, or c , Chmp4b-RFP (grey) localization with VDIMs (arrowheads). Arrows indicate ESCRT puncta. Right : 3D-reconstruction. d , Schematic illustrating VDIM stages observed ...
Figure images are served from the NIH/NLM PubMed Central Open Access Subset or Europe PMC; copyright remains with the publishers and authors.
💬 Discussion
0 commentsNo comments yet. Be the first to start a discussion!
Leave a Comment