Abstract
The contractile ring is a complex molecular apparatus which physically divides many eukaryotic cells. Despite knowledge of its protein composition, the molecular architecture of the ring is not known. Here we have applied super-resolution microscopy and FRET to determine the nanoscale spatial organization of Schizosaccharomyces pombe contractile ring components relative to the plasma membrane. Similar to other membrane-tethered actin structures, we find proteins localize in specific layers relative to the membrane. The most membrane-proximal layer (0-80 nm) is composed of membrane-binding scaffolds, formin, and the tail of the essential myosin-II. An intermediate layer (80-160 nm) consists of a network of cytokinesis accessory proteins as well as multiple signaling components which influence cell division. Farthest from the membrane (160-350 nm) we find F-actin, the motor domains of myosins, and a major F-actin crosslinker. Circumferentially within the ring, multiple proteins proximal to the membrane form clusters of different sizes, while components farther from the membrane are uniformly distributed. This comprehensive organizational map provides a framework for understanding contractile ring function.
🔬 Techniques
🔭 Microscopes
🧬 Organisms
💻 Software
✨ Fluorophores
🧪 Sample Preparation
🏭 Microscope Brands
🧪 Reagent Suppliers
📷 Detectors
🎨 Filters
💻 Software Details
💾 Data Repositories
🏛️ Research Organizations (ROR)
Affiliated research institutions:
📋 Methods
Yeast methods and strain construction
S. pombe strains ( Supplementary file 1 ) were grown in yeast extract (YE) media at 25°C, with the exception of pnmt1-Acyl-mMaple3 ( Figure 1—figure supplement 1B ) and nmt1-Acyl-GFP ( Figure 5A ) which were grown in Edinburgh minimal medium (EMM) lacking thiamine to induce expression ( Basi et al., 1993 ). S. pombe transformations were performed with a lithium acetate method ( Keeney and Boeke, 1994 ). mMaple3 ( Wang et al., 2014 ) was cloned into a pFA6a vector at AscI and PacI sites. C-terminal fluorophore endogenous fusion strains were created by transforming a pFA6a integration cassette amplified with gene specific primers for insertion at the 3’ end of open reading frames ( Bähler et al., 1998 ). N-terminal mMaple3 or GFP fusion proteins were created with two methods. For nonessential genes (Cyk3, Imp2, Mid1, Pom1, Pxl1, Rga7, and Spa2), constructs containing (1) a 500 bp 5’ flank, (2) mMaple3 or GFP with a GGGGSGGGGSG C-terminal linker, (3) the coding sequence, and (4) a 500 bp 3’ flank were assembled into a pSK or pIRT2 vector ( Gibson et al., 2009 ). These cassettes were amplified from their 5’ and 3’ flanks, transformed into ura4 + deletion strains of the targeted gene, and selected for ura4 + loss and integration by resistance to 5-FOA. For essential genes (Cdc12, Cdc15, Myo2, Rng2, and Rgf3), constructs containing (1) a 500 bp 5’ flank, (2) mMaple3 or GFP with a GGGGSGGGGSG C-terminal flexible linker, (3) the coding sequence, (4) a Kan R cassette from pFA6a, and (5) a 500 bp 3’ flank were assembled into a pSK vector. These cassettes were digested before and after their 5’ and 3’ flanks and transformed into wildtype S. pombe . G418 resistant transformants were screened for correct integration by PCR. pAct-LifeAct-mMaple3 was constructed to be identical to the previously described pAct-LifeAct-GFP ( Huang et al., 2012 ). A 1 kb promotor from act1 , the LifeAct peptide (MGVADLIKKFESISKE) ( Riedl et al., 2008 ), a short GGPGG linker, and mMaple3 were assembled into a pJK148 plasmid which was subsequently digested by NruI and integrated into the leu1-32 locus ( Keeney and Boeke, 1994 ). Acyl-mMaple3 was constructed with the N-terminal acyl sequence from Gpa1 (MGCMSSKYADTSGGEV) and mMaple3 in a pREP1 vector ( Maundrell, 1993 ). All strains were confirmed by PCR and sequencing.
Show full methods section
Yeast methods and strain construction
S. pombe strains ( Supplementary file 1 ) were grown in yeast extract (YE) media at 25°C, with the exception of pnmt1-Acyl-mMaple3 ( Figure 1—figure supplement 1B ) and nmt1-Acyl-GFP ( Figure 5A ) which were grown in Edinburgh minimal medium (EMM) lacking thiamine to induce expression ( Basi et al., 1993 ). S. pombe transformations were performed with a lithium acetate method ( Keeney and Boeke, 1994 ). mMaple3 ( Wang et al., 2014 ) was cloned into a pFA6a vector at AscI and PacI sites. C-terminal fluorophore endogenous fusion strains were created by transforming a pFA6a integration cassette amplified with gene specific primers for insertion at the 3’ end of open reading frames ( Bähler et al., 1998 ). N-terminal mMaple3 or GFP fusion proteins were created with two methods. For nonessential genes (Cyk3, Imp2, Mid1, Pom1, Pxl1, Rga7, and Spa2), constructs containing (1) a 500 bp 5’ flank, (2) mMaple3 or GFP with a GGGGSGGGGSG C-terminal linker, (3) the coding sequence, and (4) a 500 bp 3’ flank were assembled into a pSK or pIRT2 vector ( Gibson et al., 2009 ). These cassettes were amplified from their 5’ and 3’ flanks, transformed into ura4 + deletion strains of the targeted gene, and selected for ura4 + loss and integration by resistance to 5-FOA. For essential genes (Cdc12, Cdc15, Myo2, Rng2, and Rgf3), constructs containing (1) a 500 bp 5’ flank, (2) mMaple3 or GFP with a GGGGSGGGGSG C-terminal flexible linker, (3) the coding sequence, (4) a Kan R cassette from pFA6a, and (5) a 500 bp 3’ flank were assembled into a pSK vector. These cassettes were digested before and after their 5’ and 3’ flanks and transformed into wildtype S. pombe . G418 resistant transformants were screened for correct integration by PCR. pAct-LifeAct-mMaple3 was constructed to be identical to the previously described pAct-LifeAct-GFP ( Huang et al., 2012 ). A 1 kb promotor from act1 , the LifeAct peptide (MGVADLIKKFESISKE) ( Riedl et al., 2008 ), a short GGPGG linker, and mMaple3 were assembled into a pJK148 plasmid which was subsequently digested by NruI and integrated into the leu1-32 locus ( Keeney and Boeke, 1994 ). Acyl-mMaple3 was constructed with the N-terminal acyl sequence from Gpa1 (MGCMSSKYADTSGGEV) and mMaple3 in a pREP1 vector ( Maundrell, 1993 ). All strains were confirmed by PCR and sequencing.
Sample preparation for fPALM imaging
To enrich for cells undergoing cytokinesis for imaging, newly separated short cells containing mMaple3-tagged proteins were isolated from a 7–30% lactose gradient, grown for 80 min in YE, labeled with 0.5 mM mCling-ATTO647N ( Revelo et al., 2014 ) (Synaptic Systems, Goettingen, Germany) for 10 min, and fixed. The resulting fixed sample was enriched for cells containing fully formed but unconstricted contractile rings. Cells were fixed with 3.7% paraformaldehyde directly in media for 20 min and subsequently washed 6X with PBS. Staining of actin with phalloidin was performed on fixed cells with 3.3 µM Phalloidin-Alexa488 in PBS + 0.1% NP-40 for 30 min, followed by 3 washes with PBS. Fixed and washed cells were resuspended in a small volume of PBS containing 1:100 diluted 80 nm gold particles (Microspheres-Nanospheres, Cold Spring, NY) previously sonicated for 1 hr to disperse clusters. The cell and gold particle suspension was mounted on a 3% agarose pad to prevent cell drifting during imaging. fPALM imaging fPALM imaging ( Figures 1 – 4 and 6 ) was performed on a Nikon dSTORM 4.0 system which included a Nikon Eclipse Ti microscope, 405, 488, 561, and 647 nm solid state lasers, a Hamamatsu ORCA-Flash4.0 camera, and a 100X CFI HP Apochromat TIRF 1.49NA objective with a 1.5X tubelens (resulting in 110 nm pixels). Imaging was performed at a 0° laser angle (‘straight through’) focused in Z at the center of cells for Figures 1 – 4 and the top of cells for Figure 6 . Z drift was minimized using a Nikon Perfect Focus system. The mMaple3 channel was imaged with simultaneous 0.5% 405 nm activation and 7.5% 561 nm excitation lasers, filtered through a polychroic mirror (ZT405/488/561/647rpc, Chroma, Bellows Falls, VT) and emission filter (ET585/65 m, Chroma), and captured with 30 ms exposures over 10–20 k frames. The ATTO647N channel was imaged with simultaneous 0.2% 405 nm activation and 2% 647 nm excitation lasers, filtered through a polychroic mirror (ZT405/488/561/647rpc, Chroma) and emission filter (ET705/75 m, Chroma), and captured with 10 ms exposures over 15 k frames. The Alexa488 channel for Phalloidin-Alexa488 was imaged with simultaneous 0.2% 405 nm activation and 2% 488 nm excitation lasers, filtered through a polychroic mirror (ZT405/488/561/647rpc, Chroma) and emission filter (ET525/50 m, Chroma), and captured with 10 ms exposures over 15 k frames. Laser powers and exposure times were optimized for single photoactivated localizations per ring in each frame. fPALM analysis fPALM images were analyzed using the ImageJ plugin ThunderSTORM ( Ovesný et al., 2014 ). Images were pre-filtered with a wavelet B-spline filter and molecules were approximately localized with the 8-neighborhood local maximum method. Molecules were sub-pixelly localized using the elliptical Gaussian weighted least squares method to identify precise lateral and Z positions. A Z-calibration was performed with 0.1 µm Tetraspek beads (ThermoFisher) for accurate Z positioning. Axial drift, though minimal with this microscope setup, was corrected in post-processing by tracking fiducial gold bead markers as well as cross-correlation analysis. fPALM images are visualized with localizations as normalized Gaussians, where each peak’s standard deviation (FWHM) equals its localization uncertainty ( Betzig et al., 2006 ). Processed and aligned 2-color images were restricted to a 500 nm plane through the center of the cells. Fully formed, unconstricted rings were identified visually through the following criteria: (1) a lack of precursor nodes, (2) a fully formed contiguous ring perpendicular to the long cell axis, and (3) a lack of membrane and septum ingression detected in the mCling channel. These criteria place all analyzed rings in a short window of 15–20 min between ring formation and constriction ( Wu et al., 2003 ). The edge of the plasma membrane was identified in an unbiased manner using an automated threshold method to determine where the signal from the mCling-ATTO647N channel drops to 5% of its maximum plasma membrane intensity ( Figure 1—figure supplement 1B ). The distance of each individual mMaple3 particle in the contractile ring to this edge was calculated. These data were fit with a Gaussian curve and the distance from the membrane (d center ) and a vertical width parameter (σ vert or FWHM) were determined using R ( Figure 1E ), as performed previously in a study of focal adhesion proteins ( Kanchanawong et al., 2010 ). A horizontal width parameter (σ width ) was also calculated to describe the FWHM of ring localizations parallel to the plasma membrane. d center , σ vert , and σ width values from multiple rings (see Figure 1—figure supplement 1 and Figure 2—figure supplement 1 for n values and other statistics) were plotted using ggplot2 in R. The contractile ring horizontal width dimension reported in the text (182 ± 26 nm) represents an average of all components’ σ width . The contractile ring maximum extension from the plasma membrane figure reported in the text (293 ± 64 nm) represents LifeAct-mMaple3’s (the most distal component) d center + ½(σ vert ), approximating the ring’s extension into the cytoplasm. Analysis of local homogeneity in Figure 6 was performed with downconverted 8-bit images using the ‘Texture Analysis’ ImageJ plugin ( https://imagej.nih.gov/ij/plugins/texture.html ). This plugin computes a grey-level co-occurrence matrix for all the pixels in the ROI of a contractile ring p(i, j) , and calculates multiple of Haralick’s textural features ( Haralick et al., 1973 ) from this matrix. We utilized the Inverse Difference Moment (IDM), a measure of local homogeneity: ∑ i = 1 N g ∑ j = 1 N g 1 1 + i - j 2 p ( i , j ) where N g is the maximum grey value and p(i, j) is the grey level co-occurrence matrix. This analysis was performed specifically in the direction of the ring circumferential axis.
FRET imaging
FRET imaging ( Figure 5 ) was performed on a Perkin Elmer Ultraview Vox spinning disk system equipped with a Zeiss Axio Observer microscope, 488 and 561 nm solid state lasers with a PhotoKinesis bleaching module, a Yokogawa CSU-X1 spinning disk, a 63X C-Apochromat objective, and a Hamamatsu ImageEM C9100-13 EMCCD camera. An acceptor photobleaching method was employed for FRET imaging in live cells. The mCherry-Cdc15 or Cdc15-mCherry fluorophores were bleached throughout the cells with 100% 561 nm laser power for 20 cycles. 10 frames of single Z slices in the donor GFP channel were acquired pre- and post-bleach. FRET percentages were calculated by first correcting for background and photobleaching over the 10 pre- and post-bleach frames, and subsequently calculating the percentage increase in GFP donor fluorescence at contractile ring ROIs of a consistent size. Statistical tests in Figure 5A–B and Figure 5—figure supplement 1B and S5B are ANOVA tests versus Rlc1-GFP a negative control which does not FRET with either mCherry-Cdc15 or Cdc15-mCherry, with uncorrected p values reported in Figure 5—figure supplement 1A–B . Statistical tests in Figure 5—figure supplement 1C were Fisher’s exact tests between the mCherry-Cdc15 and Cdc15-mCherry conditions.
Yeast methods and strain construction
S. pombe strains ( Supplementary file 1 ) were grown in yeast extract (YE) media at 25°C, with the exception of pnmt1-Acyl-mMaple3 ( Figure 1—figure supplement 1B ) and nmt1-Acyl-GFP ( Figure 5A ) which were grown in Edinburgh minimal medium (EMM) lacking thiamine to induce expression ( Basi et al., 1993 ). S. pombe transformations were performed with a lithium acetate method ( Keeney and Boeke, 1994 ). mMaple3 ( Wang et al., 2014 ) was cloned into a pFA6a vector at AscI and PacI sites. C-terminal fluorophore endogenous fusion strains were created by transforming a pFA6a integration cassette amplified with gene specific primers for insertion at the 3’ end of open reading frames ( Bähler et al., 1998 ). N-terminal mMaple3 or GFP fusion proteins were created with two methods. For nonessential genes (Cyk3, Imp2, Mid1, Pom1, Pxl1, Rga7, and Spa2), constructs containing (1) a 500 bp 5’ flank, (2) mMaple3 or GFP with a GGGGSGGGGSG C-terminal linker, (3) the coding sequence, and (4) a 500 bp 3’ flank were assembled into a pSK or pIRT2 vector ( Gibson et al., 2009 ). These cassettes were amplified from their 5’ and 3’ flanks, transformed into ura4 + deletion strains of the targeted gene, and selected for ura4 + loss and integration by resistance to 5-FOA. For essential genes (Cdc12, Cdc15, Myo2, Rng2, and Rgf3), constructs containing (1) a 500 bp 5’ flank, (2) mMaple3 or GFP with a GGGGSGGGGSG C-terminal flexible linker, (3) the coding sequence, (4) a Kan R cassette from pFA6a, and (5) a 500 bp 3’ flank were assembled into a pSK vector. These cassettes were digested before and after their 5’ and 3’ flanks and transformed into wildtype S. pombe . G418 resistant transformants were screened for correct integration by PCR. pAct-LifeAct-mMaple3 was constructed to be identical to the previously described pAct-LifeAct-GFP ( Huang et al., 2012 ). A 1 kb promotor from act1 , the LifeAct peptide (MGVADLIKKFESISKE) ( Riedl et al., 2008 ), a short GGPGG linker, and mMaple3 were assembled into a pJK148 plasmid which was subsequently digested by NruI and integrated into the leu1-32 locus ( Keeney and Boeke, 1994 ). Acyl-mMaple3 was constructed with the N-terminal acyl sequence from Gpa1 (MGCMSSKYADTSGGEV) and mMaple3 in a pREP1 vector ( Maundrell, 1993 ). All strains were confirmed by PCR and sequencing.
Additional files 10.7554/eLife.28865.017 Supplementary file 1. S. pombe strains used in this study. 10.7554/eLife.28865.018 Transparent reporting form
📊 Figures
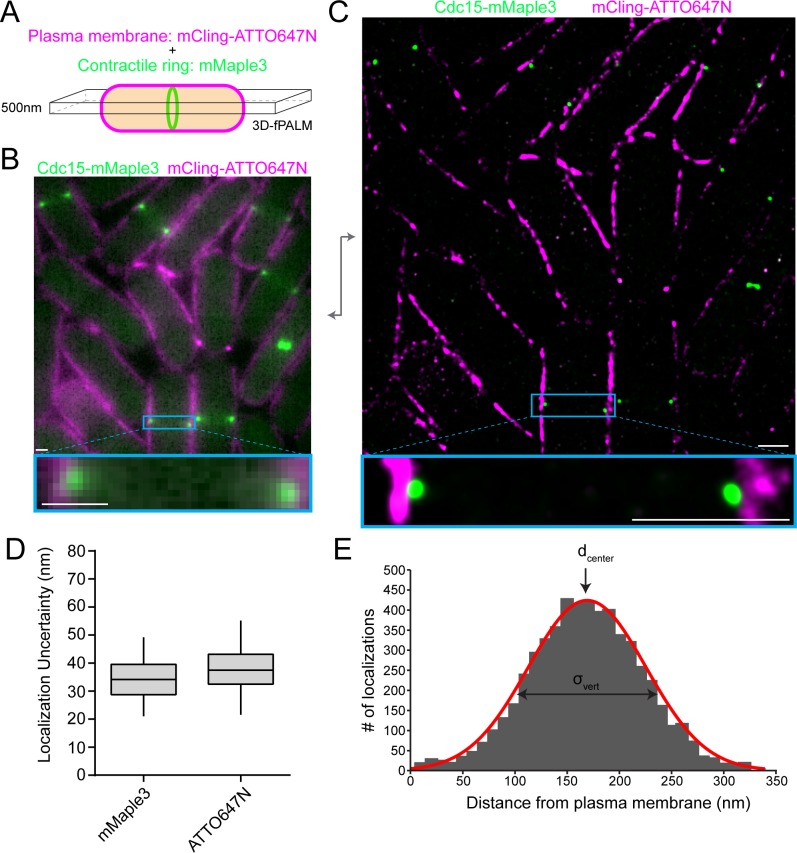
Figure 1.
fPALM strategy to localize contractile ring proteins relative to the plasma membraneu00a0with nanometer resolution.
( A ) Schematic of fPALM sample setup. Contractile ring proteins were endogenously tagged with mMaple3 while the plasma membrane was labeled with mCling-ATTO647N. A 3D-fPALM system was used to restric...
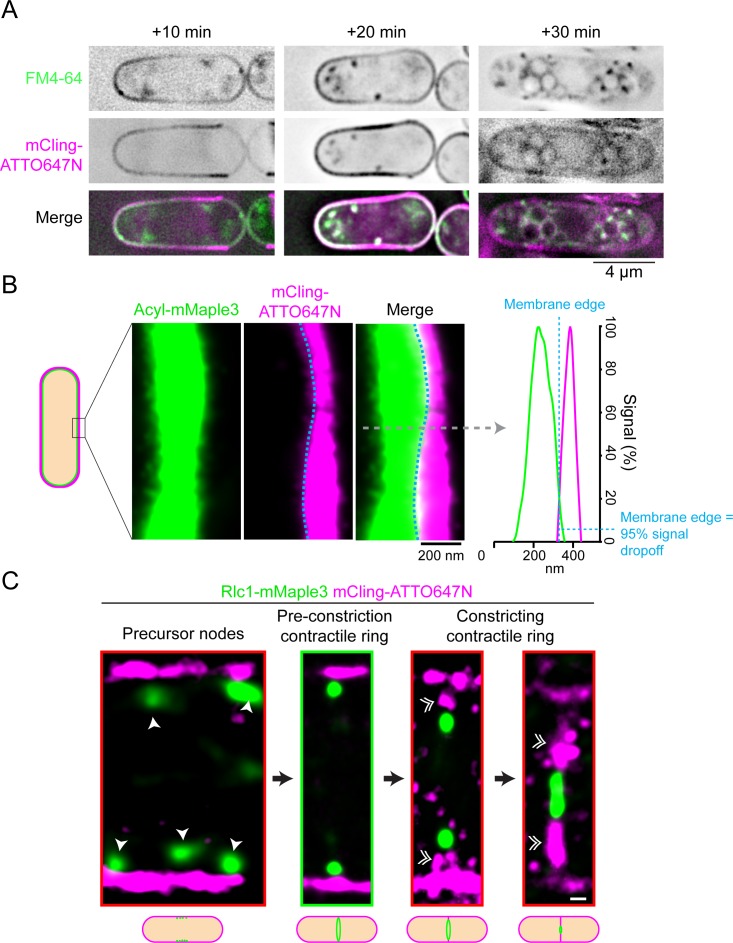
Figure 1u2014figure supplement 1.
The mCling-ATTO674N plasma membrane marker accurately identifies the plasma membrane edge.
( A ) mCling-ATTO647N is a bona fide plasma membrane marker. Time course of mCling-ATTO647N and FM4-64 staining of cells reveals plasma membrane colocalization and trafficking into internal compartmen...
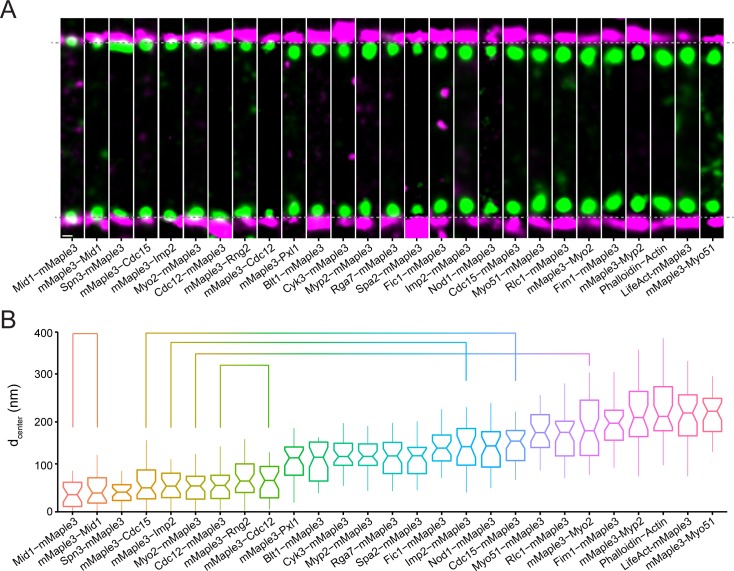
Figure 2.
Nanoscale organization of contractile ring structural components.
( A ) Representative fPALM images of structural contractile ring components. Scale, 100 nm. Particles are visualized as normalized Gaussians with standard deviationu00a0=u00a0localization uncertainty....
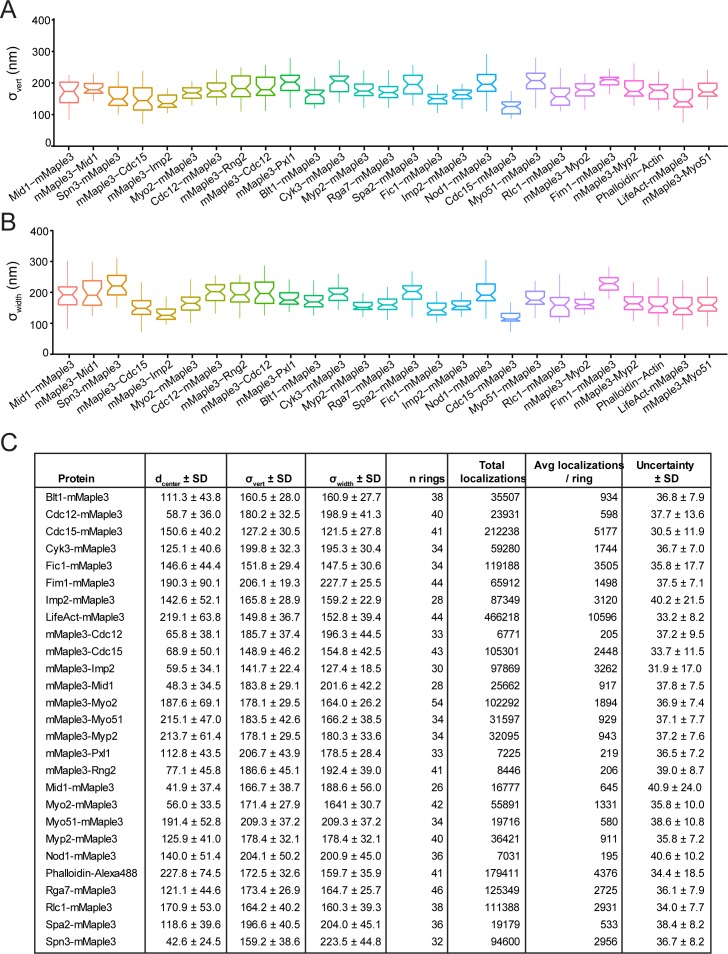
Figure 2u2014figure supplement 1.
Vertical and horizontal width parameters (u03c3 vert and u03c3 width ) and localization values for strains in Figure 2 .
( A ) Vertical width parameters (u03c3 vert ) for structural contractile ring components in Figure 2 . ( B ) Horizontal width parameters (u03c3 width ) for structural contractile ring components in Fi...
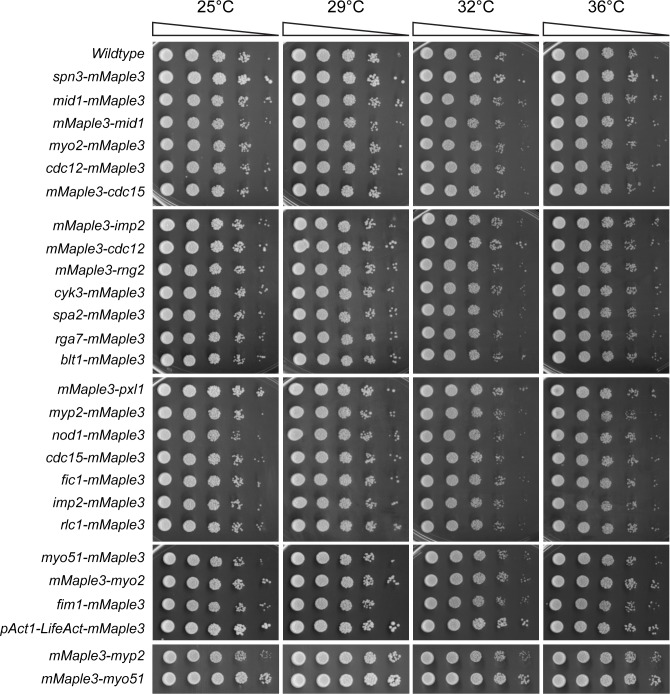
Figure 2u2014figure supplement 2.
Endogenous mMaple3 tags do not perturb normal growth and division.
Serial dilutions of the strains used in Figure 2 were grown at the indicated temperatures.
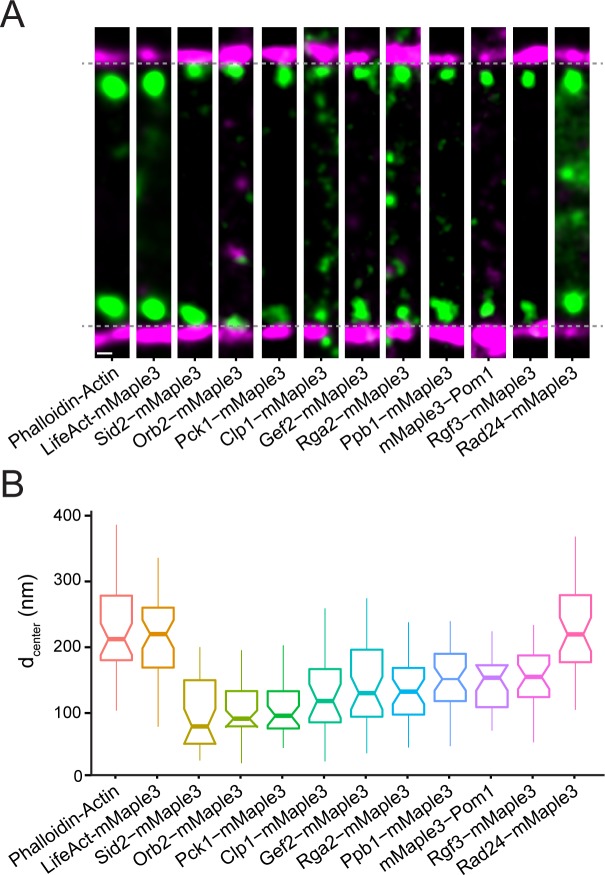
Figure 3.
Nanoscale organization of contractile ring signaling components.
( A ) Representative fPALM images of signaling contractile ring components. Scale, 100 nm. Particles are visualized as normalized Gaussians with standard deviationu00a0=u00a0localization uncertainty. ...
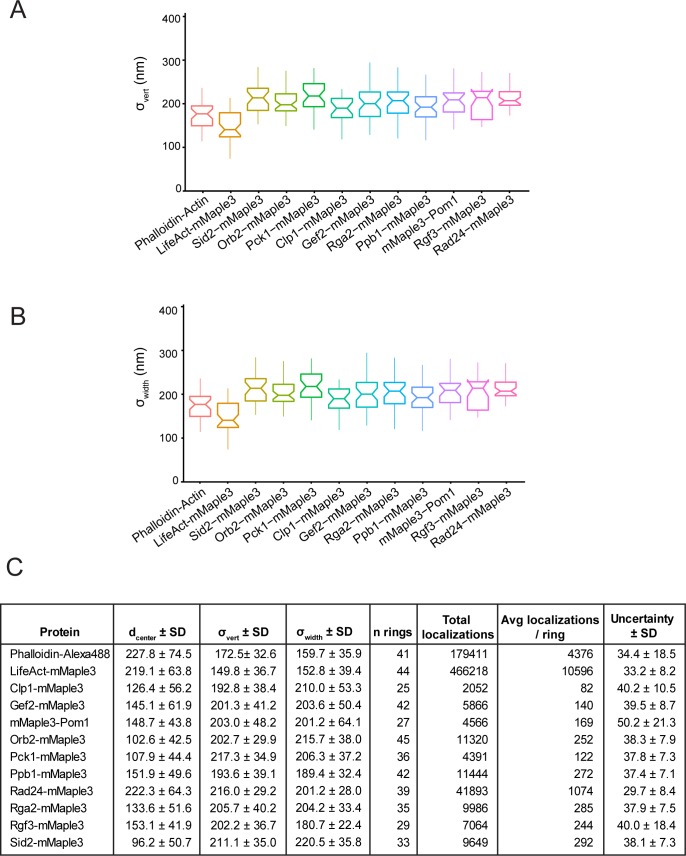
Figure 3u2014figure supplement 1.
Vertical and horizontal width parameters (u03c3 vert and u03c3 width ) and localization values for strains in Figure 3 .
( A ) Vertical width parameters (u03c3 vert ) for signaling contractile ring components in Figure 3 . ( B ) Horizontal width parameters (u03c3 width ) for signaling contractile ring components in Figu...
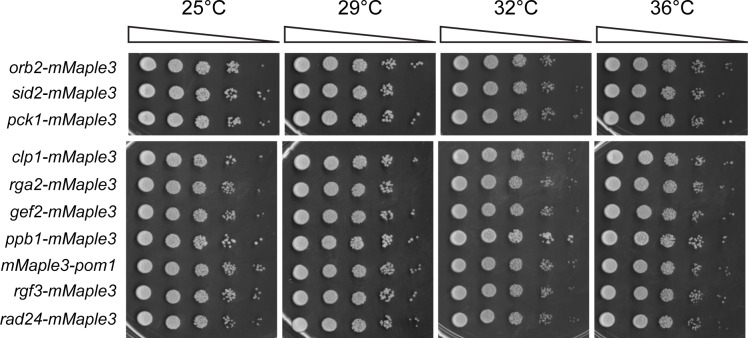
Figure 3u2014figure supplement 2.
Endogenous mMaple3 tags do not perturb normal growth and division.
Serial dilutions of the strains used in Figure 3 were grown at the indicated temperatures.
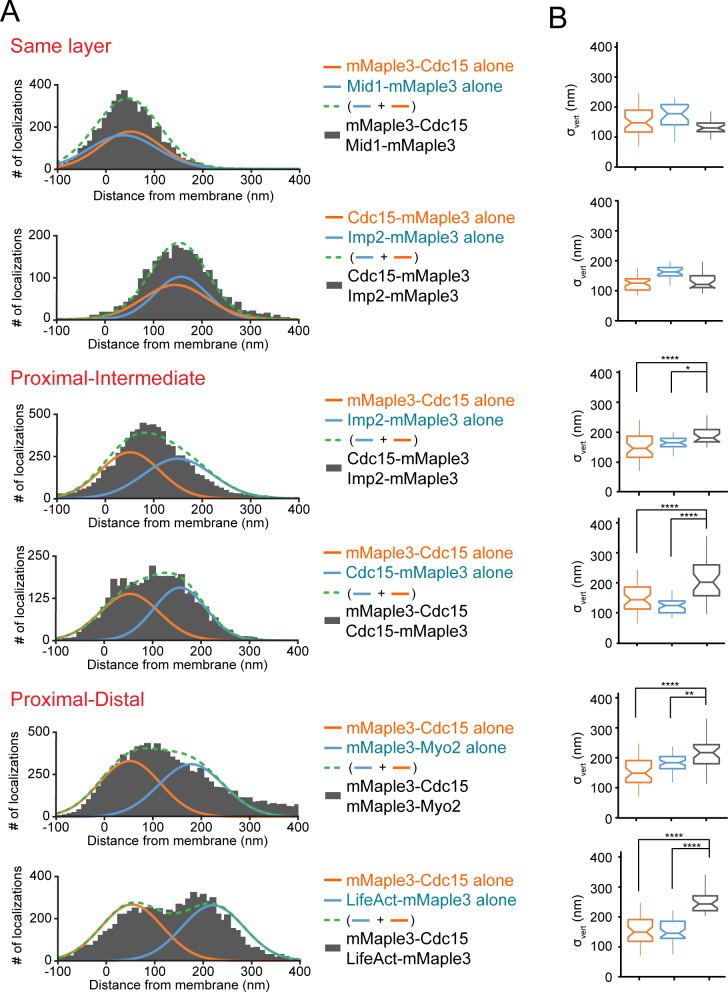
Figure 4.
Distinguishing contractile ring layers with pairsu00a0of mMaple3-taggedu00a0proteins.
( A ) Comparison of single mMaple3-tagged proteins in similar or disparate localizations in the contractile ring. Orange and blue lines represent average localization of individual proteins from Figur...
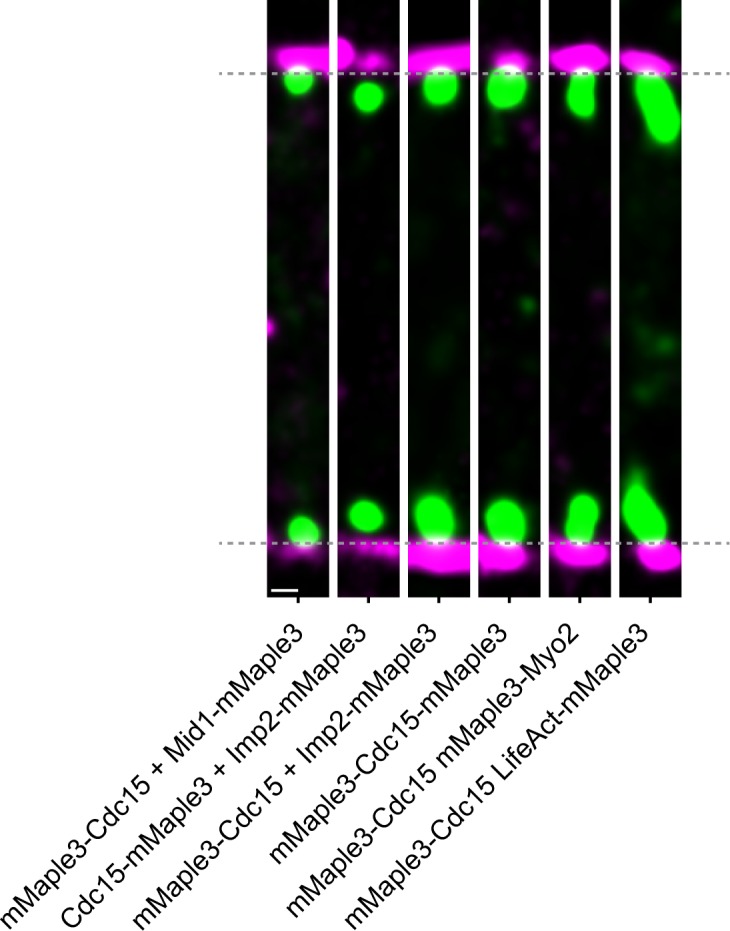
Figure 4u2014figure supplement 1.
Visualizing pairsu00a0ofu00a0mMaple3 taggedu00a0protein.
Representative f-PALM images of dual mMaple3-tagged strains. Particles are visualized as normalized Gaussians with standard deviation = localization uncertainty. Dashed lines indicate plasma membrane ...
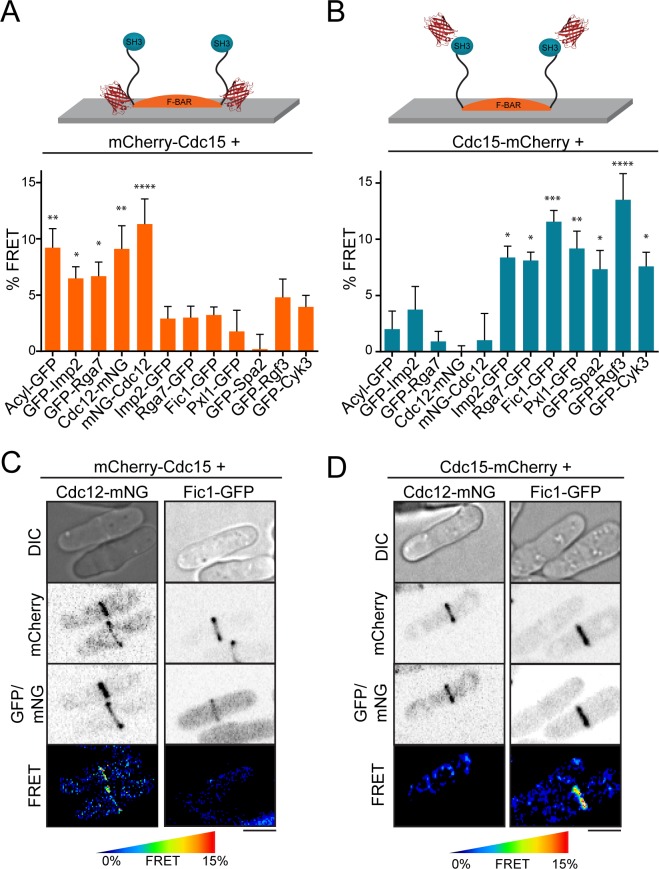
Figure 5.
FRET confirms distinct layers around F-BAR proteins in the contractile ring.
( Au2013B ) Quantification of FRET between mCherry-Cdc15 ( A ) or Cdc15-mCherry ( B ) and GFP- or mNG-conjugated contractile ring components. See also Figure 5u2014figure supplement 1 for direct mCher...
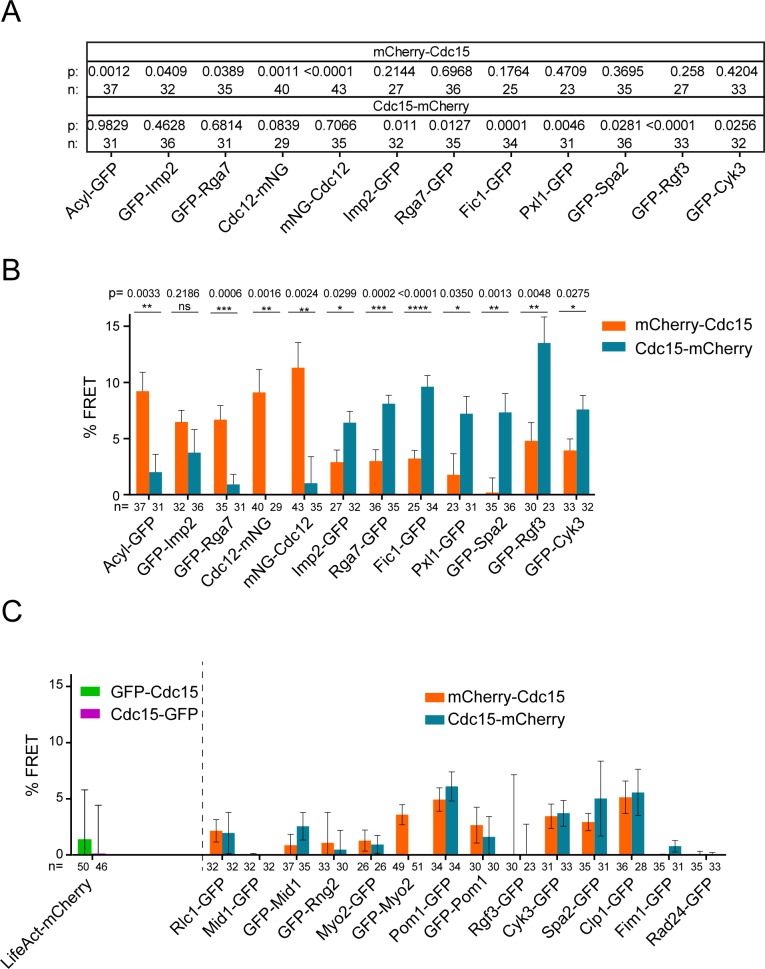
Figure 5u2014figure supplement 1.
Intermolecular FRET experiments.
( A ) Statistics for data in Figure 5Au2013B . A one way ANOVA test was performed between each GFP strain and an Rlc1-GFP negative control and uncorrected p values are reported. ( B ) Comparison of FR...
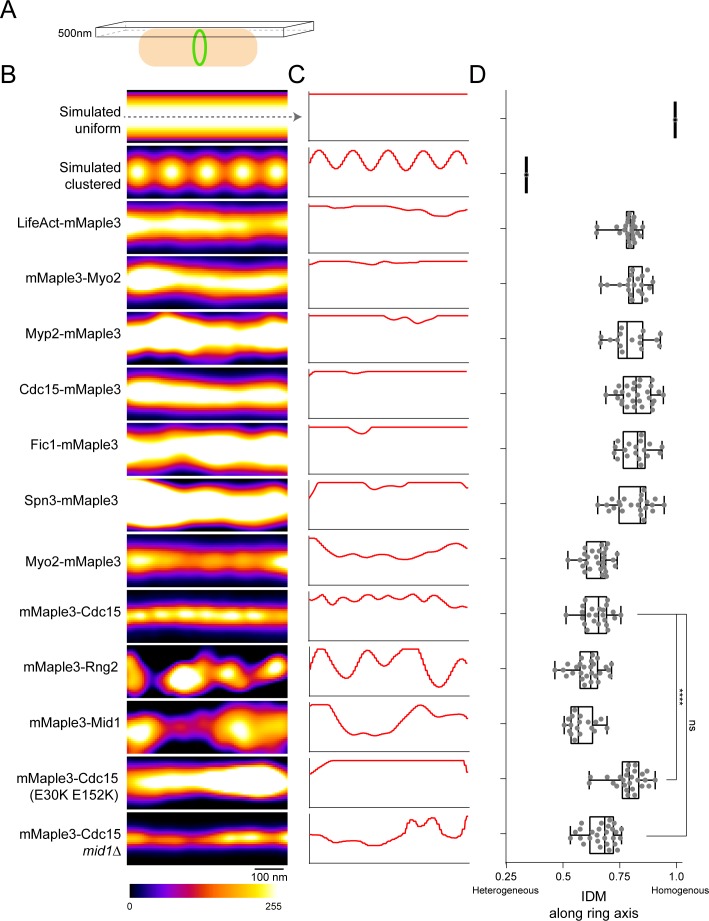
Figure 6.
Lateral organization of components in the contractile ring.
( A ) Schematic of fPALM setup with Z focus at the top of cells. ( B ) Representative fPALM image of the top of contractile rings with the indicated components labeled. Simulated clustered or smooth r...
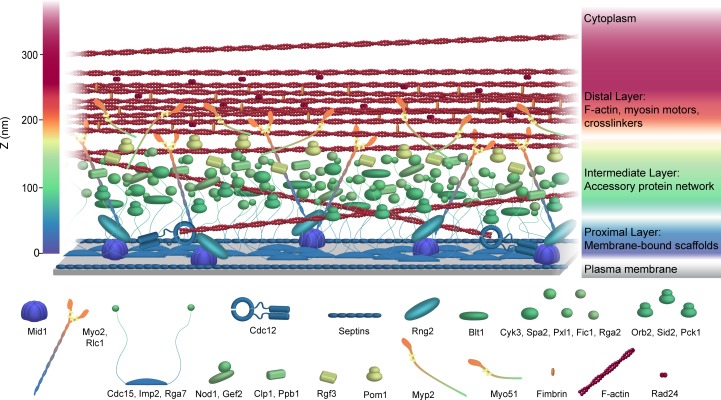
Figure 7.
Schematic model of the S. pombe contractile ring molecular architecture.
Depicted protein positions were calculated experimentally and are color-coded in the Z dimension. Note that this model does not incorporate stoichiometry. See also Video 1 .
Video 1.
Animated schematic model of the S. pombe contractile ring molecular architecture.
Depicted protein positions were calculated experimentally and are color-coded in the Z dimension. Note that this model does not incorporate stoichiometry.
Figure images are served from the NIH/NLM PubMed Central Open Access Subset or Europe PMC; copyright remains with the publishers and authors.
💬 Discussion
0 commentsNo comments yet. Be the first to start a discussion!
Leave a Comment