Abstract
DNA double-strand break (DSB) repair by homologous recombination has evolved to maintain genetic integrity in all organisms. Although many reactions that occur during homologous recombination are known, it is unclear where, when and how they occur in cells. Here, by using conventional and super-resolution microscopy, we describe the progression of DSB repair in live Escherichia coli. Specifically, we investigate whether homologous recombination can occur efficiently between distant sister loci that have segregated to opposite halves of an E. coli cell. We show that a site-specific DSB in one sister can be repaired efficiently using distant sister homology. After RecBCD processing of the DSB, RecA is recruited to the cut locus, where it nucleates into a bundle that contains many more RecA molecules than can associate with the two single-stranded DNA regions that form at the DSB. Mature bundles extend along the long axis of the cell, in the space between the bulk nucleoid and the inner membrane. Bundle formation is followed by pairing, in which the two ends of the cut locus relocate at the periphery of the nucleoid and together move rapidly towards the homology of the uncut sister. After sister locus pairing, RecA bundles disassemble and proteins that act late in homologous recombination are recruited to give viable recombinants 1-2-generation-time equivalents after formation of the initial DSB. Mutated RecA proteins that do not form bundles are defective in sister pairing and in DSB-induced repair. This work reveals an unanticipated role of RecA bundles in channelling the movement of the DNA DSB ends, thereby facilitating the long-range homology search that occurs before the strand invasion and transfer reactions.
🔬 Techniques
🧬 Organisms
💻 Software
✨ Fluorophores
🧪 Sample Preparation
🔬 Cell Lines
🏭 Microscope Brands
🧪 Reagent Suppliers
📷 Detectors
💻 Software Details
💾 Data Repositories
🏛️ Research Organizations (ROR)
Affiliated research institutions:
📋 Methods
Bacterial strains and growth
All strains are derivatives of E. coli K12 TB28 (MG1655, Δ lacIZYA 24 ). Cells were grown at 30°C in M9 media supplemented with 0.2% glucose. Ampicillin (100 μg/ml), kanamycin (50 μg/ml), chloramphenicol (20 μg/ml) and tetracycline (10 μg/ml) were added when required. Expression of I-SceI endonuclease from an arabinose inducible promoter 25 was induced by the addition of 0.2% arabinose. Intracellular localisation of chromosomal loci flanking the I-SceI CS cut site was visualized by fluorescent wide-field microscopy using two distinct ParB/ parS systems 26 . Mutations were generally constructed by λ-Red recombination 27 and further introduced into the strain of interest by P1 transduction. When needed, the DNA region between the two frt sites ( cam/kan resistance genes) was removed using Flp recombinase expressed from pCP20 27 .
Microscopy sample preparation
All microscopy experiments were performed on live cells growing in exponential phase (A 600 ~0.1-0.2). Cells were transferred from liquid culture to a slide mounted with 1% agarose in M9 glucose 0.2% medium and incubated during microscopy at the required temperature using an incubation chamber. 3D-structured illumination microscopy (3D-SIM) snapshots were performed at 24 °C with cells covered with precision cover glass thickness No. 1.5H (170 μm ±5 μm; Marienfeld Superior) using immersion oil with a refractive index of 1.512 to minimise spherical aberration. For time-lapses after DSB induction, arabinose 0.2% was added to the liquid culture for 30 min before the cell were mounted on the slide. Nucleoids were visualized using 4 μg/ml 4′,6-diamidino-2-phenylindole (DAPI), and cells membrane were visualized using 1 μg/ml FM4-64 (Life Technologies). Wide-field microscopy, 3D-structured illumination microscopy and FRAP imaging Conventional wide-field fluorescence microscopy was carried out on an Eclipse TE2000-U microscope (Nikon), equipped with a 100x/1.4 oil PlanApo objective and either a Cool-Snap HQ CCD or a QuantEM camera (Photometrics), and using Metamorph software for image acquisition. Super-resolution 3D-SIM imaging as well as conventional wide-field imaging was performed on a DeltaVision OMX V3 (Applied Precision/GE Healthcare) equipped with a Blaze SIM module, a 60x/1.42 oil UPlanSApo objective (Olympus), 405 nm and 488 nm and 593 nm diode lasers and three sCMOS cameras (PCO). The fast-live mode enabled ultra-high speed illumination and simultaneous or sequential acquisition of multiple-color 3D stacks of RecA-GFP/DAPI, RecA-GFP/FM4-64, RecA-GFP/mCherry or RecA-GFP alone. For each color, the raw 3D-SIM stacks were composed of 225 images (512×512 pixels) consisting of 15 z-sections (125 nm z-distance, sample thickness of 1.750 μm), with 15 images per z-section with the striped illumination pattern 28 , 29 rotated to the three angles (−60°, 0°, +60°) and shifted in five phase steps. Acquisition settings were as follows: RecA-GFP, 2-5 ms exposure with 488 nm laser (attenuated to 10% transmission); DAPI, 20 ms exposure with 405 nm laser (100% transmission); FM4-64, 30 ms exposure with 593 nm laser (100% transmission). Total acquisition times per stack were 1.8 s for RecA-GFP, and ~10 s for RecA-GFP/DAPI and RecA-GFP/FM4-64. Note that simultaneous imaging of RecA-GFP and DSe (ParB-mCherry) was performed in 3D-SIM mode for RecA-GFP and conventional wide-field for ParB-mCherry. The 3D-SIM raw data was computationally reconstructed with SoftWoRx 6.0 (Applied Precision) using Wiener filter settings 0.002 and channel specifically measured optical transfer functions to generate a super-resolution 3D image stack with a lateral (x-y) resolution of 100-130 nm (wavelength-dependent) and an axial (z) resolution of ~300 nm. In the reconstruction process the pixel size is halved from 80 nm to 40 nm and the pixel number doubled in order to meet the Nyquist sampling criterion. The number of pixels in the DSe conventional images were doubled using Priism (Image Visualization Environment, http://msg.ucsf.edu/IVE/ ) in order to merge with 3D-SIM images. A constrained iterative 3D image deconvolution was applied to conventional wide-field data in SoftWorX 6.0. Images from the different color channels were registered with alignment parameter obtained from calibration measurements with 0.2 μm diameter TetraSpeck beads (Life Technologies) using the OMX Editor software (Chris Weisiger & John Sedat, UCSF; unpublished). FRAP experiments were performed with an UltraVIEW VoX spinning disk confocal system with Photokinesis module (PerkinElmer) assembled on an IX8 microscope (Olympus) equipped with an C9100-13 EMCCD camera (Hamamatsu) and a 100x/1.4 oil PlanApo objective (Olympus). Photobleaching of a small diffraction-limited spot was carried out with a focused 488 nm laser beam (100 ms with AOTF set to 50% transmission). Fluorescence intensity measurements of the unbleached and bleached regions were performed using ImageJ ( rsbweb.nih.gov/ij/ ). Values were normalized to those of initial prebleaching images.
Show full methods section
Bacterial strains and growth
All strains are derivatives of E. coli K12 TB28 (MG1655, Δ lacIZYA 24 ). Cells were grown at 30°C in M9 media supplemented with 0.2% glucose. Ampicillin (100 μg/ml), kanamycin (50 μg/ml), chloramphenicol (20 μg/ml) and tetracycline (10 μg/ml) were added when required. Expression of I-SceI endonuclease from an arabinose inducible promoter 25 was induced by the addition of 0.2% arabinose. Intracellular localisation of chromosomal loci flanking the I-SceI CS cut site was visualized by fluorescent wide-field microscopy using two distinct ParB/ parS systems 26 . Mutations were generally constructed by λ-Red recombination 27 and further introduced into the strain of interest by P1 transduction. When needed, the DNA region between the two frt sites ( cam/kan resistance genes) was removed using Flp recombinase expressed from pCP20 27 .
Microscopy sample preparation
All microscopy experiments were performed on live cells growing in exponential phase (A 600 ~0.1-0.2). Cells were transferred from liquid culture to a slide mounted with 1% agarose in M9 glucose 0.2% medium and incubated during microscopy at the required temperature using an incubation chamber. 3D-structured illumination microscopy (3D-SIM) snapshots were performed at 24 °C with cells covered with precision cover glass thickness No. 1.5H (170 μm ±5 μm; Marienfeld Superior) using immersion oil with a refractive index of 1.512 to minimise spherical aberration. For time-lapses after DSB induction, arabinose 0.2% was added to the liquid culture for 30 min before the cell were mounted on the slide. Nucleoids were visualized using 4 μg/ml 4′,6-diamidino-2-phenylindole (DAPI), and cells membrane were visualized using 1 μg/ml FM4-64 (Life Technologies). Wide-field microscopy, 3D-structured illumination microscopy and FRAP imaging Conventional wide-field fluorescence microscopy was carried out on an Eclipse TE2000-U microscope (Nikon), equipped with a 100x/1.4 oil PlanApo objective and either a Cool-Snap HQ CCD or a QuantEM camera (Photometrics), and using Metamorph software for image acquisition. Super-resolution 3D-SIM imaging as well as conventional wide-field imaging was performed on a DeltaVision OMX V3 (Applied Precision/GE Healthcare) equipped with a Blaze SIM module, a 60x/1.42 oil UPlanSApo objective (Olympus), 405 nm and 488 nm and 593 nm diode lasers and three sCMOS cameras (PCO). The fast-live mode enabled ultra-high speed illumination and simultaneous or sequential acquisition of multiple-color 3D stacks of RecA-GFP/DAPI, RecA-GFP/FM4-64, RecA-GFP/mCherry or RecA-GFP alone. For each color, the raw 3D-SIM stacks were composed of 225 images (512×512 pixels) consisting of 15 z-sections (125 nm z-distance, sample thickness of 1.750 μm), with 15 images per z-section with the striped illumination pattern 28 , 29 rotated to the three angles (−60°, 0°, +60°) and shifted in five phase steps. Acquisition settings were as follows: RecA-GFP, 2-5 ms exposure with 488 nm laser (attenuated to 10% transmission); DAPI, 20 ms exposure with 405 nm laser (100% transmission); FM4-64, 30 ms exposure with 593 nm laser (100% transmission). Total acquisition times per stack were 1.8 s for RecA-GFP, and ~10 s for RecA-GFP/DAPI and RecA-GFP/FM4-64. Note that simultaneous imaging of RecA-GFP and DSe (ParB-mCherry) was performed in 3D-SIM mode for RecA-GFP and conventional wide-field for ParB-mCherry. The 3D-SIM raw data was computationally reconstructed with SoftWoRx 6.0 (Applied Precision) using Wiener filter settings 0.002 and channel specifically measured optical transfer functions to generate a super-resolution 3D image stack with a lateral (x-y) resolution of 100-130 nm (wavelength-dependent) and an axial (z) resolution of ~300 nm. In the reconstruction process the pixel size is halved from 80 nm to 40 nm and the pixel number doubled in order to meet the Nyquist sampling criterion. The number of pixels in the DSe conventional images were doubled using Priism (Image Visualization Environment, http://msg.ucsf.edu/IVE/ ) in order to merge with 3D-SIM images. A constrained iterative 3D image deconvolution was applied to conventional wide-field data in SoftWorX 6.0. Images from the different color channels were registered with alignment parameter obtained from calibration measurements with 0.2 μm diameter TetraSpeck beads (Life Technologies) using the OMX Editor software (Chris Weisiger & John Sedat, UCSF; unpublished). FRAP experiments were performed with an UltraVIEW VoX spinning disk confocal system with Photokinesis module (PerkinElmer) assembled on an IX8 microscope (Olympus) equipped with an C9100-13 EMCCD camera (Hamamatsu) and a 100x/1.4 oil PlanApo objective (Olympus). Photobleaching of a small diffraction-limited spot was carried out with a focused 488 nm laser beam (100 ms with AOTF set to 50% transmission). Fluorescence intensity measurements of the unbleached and bleached regions were performed using ImageJ ( rsbweb.nih.gov/ij/ ). Values were normalized to those of initial prebleaching images.
Snapshot and time-lapse analysis
Snapshot analysis was performed with the MicrobeTracker suite 30 extended by custom MATLAB routines which we specifically developed to generate focus positioning dotplots, histograms of 0/1/2-focus cell fractions, 2-color cell-type counting, inter-sister-focus distance (ISD), USe-DSe distance, focus position along the cell long X-axis (length) and short Y-axis (width). Distributions of DSe foci along the cell diameter presented Fig. 1b were performed by subdividing cells into five cell slices of equivalent areas as indicated in Meile et al., (2011) 31 . Stoichiometry of RecA was determined by convolving the total fluorescence in recA-GFP cells and compare it to that of mukB-GFP cells for which MukB stoichiometry is known 32 . Total intracellular fluorescence intensity distribution analysis was performed on images resulting from the average projection of 15 z-sections (125 nm z-distance) corresponding to a sample thickness of 1.750 μm, using MicrobeTracker. Our estimate of RecA stoichiometry is in the range of previous estimates 33 - 36 . Fluorescent particle tracking during long time-lapses (>30 s/frame) was performed using a semi-automated custom MATLAB routine as previously described 37 . Mean Square Displacement (MSD) in X and Y dimensions and directionality of movement were obtained by running the View5D plug-in (ImageJ) on short time-lapses (300 s; 5 s/frame). The apparent 2D diffusion coefficient (D app ) was calculated from the initial slope of MSD plotted against time using MSD XY =4(D app )t. The directionality of movement reflects the fraction of the overall displacement (Δd 1-t ), compared to the total distance travelled by the focus (Δd 1 +Δd 2 …+Δd t ) i.e., Directionality=(Δd 1-t /(Δd 1 +Δd 2 …+Δd t )).
Immunocytochemistry
Cells were fixed in phosphate buffered saline with paraformaldehyde 5% (pH 7.2) and glutaraldehyde 0.06% and immobilized on poly-L-lysine slides (Poly-prep from Sigma-Aldrich), followed by treatment with lysozyme 1μg/ml. Immunocytochemistry was performed using rabbit anti-RecA polyclonal antibodies (Abnova), which were revealed using anti-rabbit secondary antibodies conjugated to Alexa 594 (Life Technologies). Coverslips were mounted with Vectashield mounting medium (Vector Laboratories).
Flow cytometry
Cells were grown in M9 glucose at 30°C and sampled in late stationary phase, exponential phase (A 600 ~0.15) and 3 hours after incubation with cephalexin and rifampicin (run-out). Cell samples were prepared as described 38 except that Syto16 (Life Technologies) was used to stain DNA. Analysis was performed on FACScalibur flow cytometer (BD Biosciences). Data files were analyzed using CellQuest (BD Biosciences) and Weasel (WEHI; http://www.wehi.edu.au/ ).
Construction of I-SceI system for induction of site-specific
DSB into the E. coli chromosome The Rec + strain, in which DSB were initially induced corresponds to TB28 with both the I-SceI cut site and the gene encoding the I-SceI endonuclease inserted into codA-cynR and araB chromosome loci, respectively. The I-SceI CS cassette carries frt-cam-parSP1-frt-3 χ + -I-SceI CS -parSPMT1-3 χ − where I-SceI CS stands for the cut site (5′-TAGGGATAACAGGGTAAT-3′), +/− stand for the orientation of 5′-GCTGGTGG-3′ χ-sites 39 and frt indicates the Flp site-specific recombination sites. parS sites were amplified from pGBKD3- parSPMT1 and pGBKD3- parSP1 plasmids 40 . The cassette was integrated into codA-cynR intergenic region of MG1655 chromosome (356.6 kb) or into ydeO-ydeP intergenic region (1,581.7 kb) by λ-Red recombination 27 and further transferred by P1 transduction into TB28. The wild-type allele of a I-SceI gene under the control of arabinose inducible promoter (carried by pDL2655 plasmid described in White et al., (2008) 39 ) was fused to 1X c-Myc tag followed by the DAS+4-degron tag in its C-terminus 41 amplified from pROD60. This plasmid carrying a 6-aa linker, Myc tag, 2-aa linker and the DAS+4 degron tag (S A G S A A E Q K L I S E E D L S S A A N D E N Y S E N Y A D A S) was as described 42 . The I-SceI-degron construct was tested for its reduced efficiency to linearize a I-SceI CS -carrying plasmid after induction with 0.2% arabinose in vivo . P ara I-SceI-frt-kan or P ara I-SceI-degron-frt-kan constructs were inserted in the araB gene (70 kb) of MG1655/pKD46 by the process of λ-Red recombination and further transferred into TB28 by P1 transduction. The recA gene with its P recA promoter region were amplified from K12 genomic DNA and subsequently integrated downstream of fhuB gene on MG1655 chromosome (171 kb on the chromosome) by λ-Red recombination and transferred into TB28 by P1 transduction (referred as fhuB::recA-cat ).
Supplementary Material 1 2 supp video 1 supp video 2 supp video 3 supp video 4 supp video 5 supp video 6 supp video 7 supp video 8 Extended Data Legend Extended Data Figure 1 Extended Data Figure 2 Extended Data Figure 3 Extended Data Figure 4 Extended Data Figure 5
📊 Figures
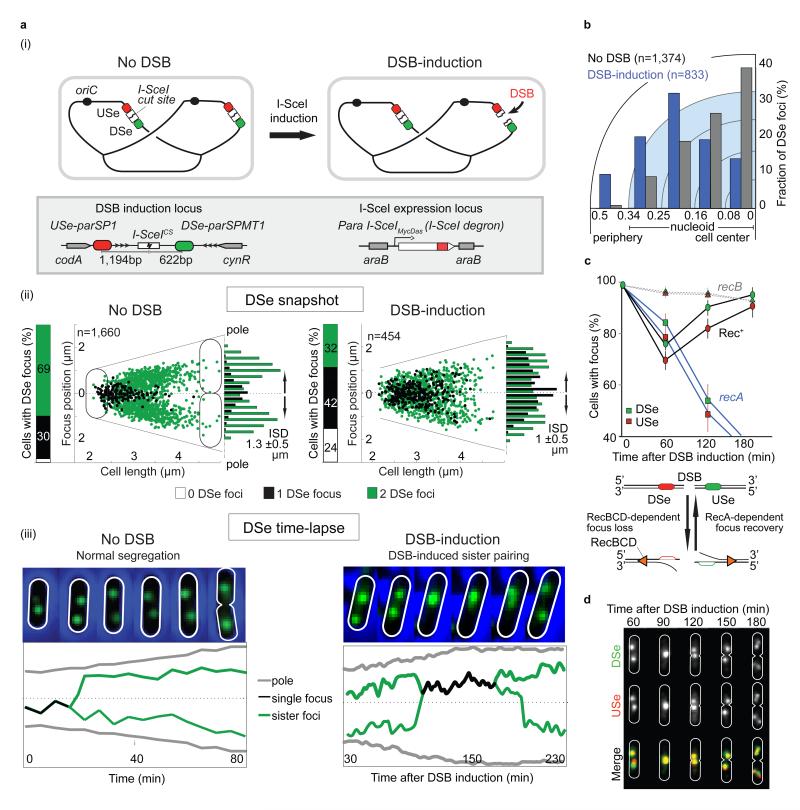
Figure 1
Effects of DSB-induction on positioning of adjacent chromosome loci
(a) (i) Schematic of DSB-induction. (ii) Snapshot analysis of DSe (Downstream end) localisation before (left) and after 60 min of DSB induction (right). ISD, mean Inter-Sister Distance. (iii), time-la...
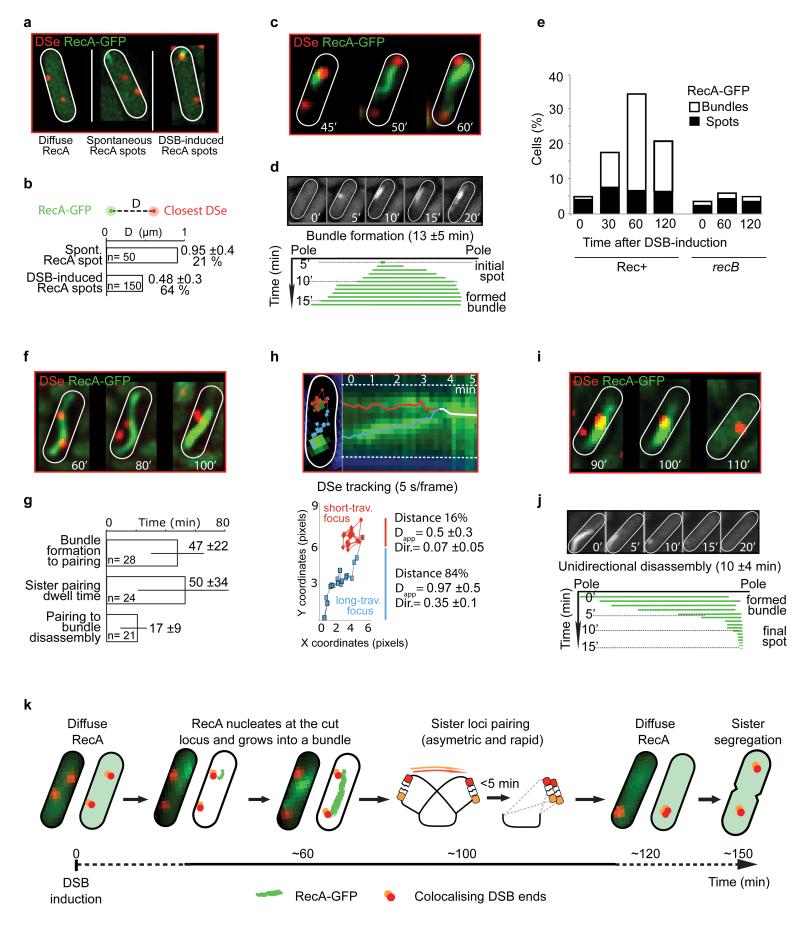
Figure 2
RecA bundle formation and disassembly, and RecA-mediated sister locus pairing
(a). RecA-GFP spot formation in relation to the cut locus during sister pairing using wide-field microscopy. (b) Histograms of the mean distance (D) between the centres of RecA spots and the closest D...
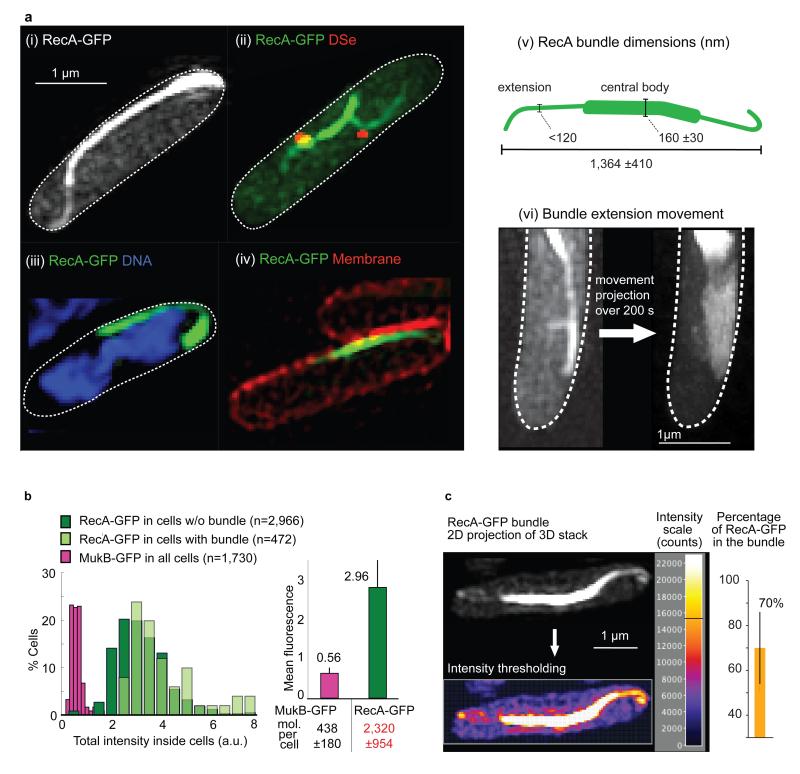
Figure 3
Super-resolution imaging of RecA bundles reveals their intracellular localization
(a). 3D-structured-illumination-microscopy (3D-SIM) of cells with DSB-induced RecA-GFP bundles alone (i), with DSe foci (ii), relative to DNA (iii), and to membrane (iv). (v), bundle architecture. (vi...
Figure images are served from the NIH/NLM PubMed Central Open Access Subset or Europe PMC; copyright remains with the publishers and authors.
💬 Discussion
0 commentsNo comments yet. Be the first to start a discussion!
Leave a Comment