Abstract
Super-resolution microscopy techniques break the diffraction limit of conventional optical microscopy to achieve resolutions approaching tens of nanometres. The major advantage of such techniques is that they provide resolutions close to those obtainable with electron microscopy while maintaining the benefits of light microscopy such as a wide palette of high specificity molecular labels, straightforward sample preparation and live-cell compatibility. Despite this, the application of super-resolution microscopy to dynamic, living samples has thus far been limited and often requires specialised, complex hardware. Here we demonstrate how a novel analytical approach, Super-Resolution Radial Fluctuations (SRRF), is able to make live-cell super-resolution microscopy accessible to a wider range of researchers. We show its applicability to live samples expressing GFP using commercial confocal as well as laser- and LED-based widefield microscopes, with the latter achieving long-term timelapse imaging with minimal photobleaching.
🔬 Techniques
🔭 Microscopes
💻 Software
✨ Fluorophores
🧪 Sample Preparation
🔬 Cell Lines
🏭 Microscope Brands
🧪 Reagent Suppliers
📷 Detectors
🔎 Objectives
💻 Software Details
🏛️ Research Organizations (ROR)
Affiliated research institutions:
📋 Methods
Cell lines
Cos7 cells were cultured in phenol red-free Dulbecco’s modified Eagle’s medium (DMEM; Thermo Fisher Scientific) supplemented with 10% (v/v) fetal bovine serum (FBS; Gibco), 1% (v/v) penicillin/streptomycin (Thermo Fisher Scientific) and 2 mM L-alanyl-L-glutamine (GlutaMAX™, Thermo Fisher Scientific) at 37 °C in a 5% CO 2 incubator.
Sample preparation
For live-cell imaging, Cos7 cells were seeded on ultraclean ( Pereira et al., 2015 ) 25 mm diameter thickness #1.5 coverslips (Marienfeld) at a density of 0.3 – 0.9 × 10 5 cells/cm 2 . One day after splitting, cells were transfected with a plasmid encoding the calponin homology domain of utrophin fused to GFP (GFP-UtrCH, here Utrophin-GFP) ( Burkel et al., 2007 ) using Lipofectamin 2000 (Thermo Fisher Scientific) according to the manufacturer’s recommendations. Cells were imaged 1–4 days post transfection in culture medium. For phalloidin dSTORM imaging, Cos7 cells were fixed at 37 °C for 15 min with 4% paraformaldehyde in cytoskeleton-preserving buffer (PEM) (80 mM PIPES pH 6.8, 5 mM EGTA, 2 mM MgCl 2 ). After fixation cells were permeabilised (1X PEM with 0.25% Triton-X) for 20 min and stained with Phalloidin-AF647 (Molecular Probes, 4 units/mL) for 30 min.
Imaging d STORM Total Internal Reflection Fluorescence
(TIRF) imaging of Alexa Fluor 647-phalloidin in fixed cells ( Fig. 2 a) was performed on a N-STORM microscope (Nikon) using a 100x TIRF objective (Apo TIRF 100x/1.49 Oil, Nikon) and additional 1.5x magnification. Fluorescence emission was collected onto an EMCCD camera (iXon Ultra 897, Andor), yielding a pixel size of 107 nm. 30,000 frames were acquired with 33 ms exposure and 642 nm laser illumination at maximum output power. Drift was estimated using the inbuilt function in NanoJ-SRRF and correction applied during SRRF analysis. d STORM imaging was performed in GLOX buffer (150 mM Tris, pH 8, 1% glycerol, 1% glucose, 10 mM NaCl, 1% β-mercaptoethanol, 0.5 mg/ml glucose oxidase, 40 μg/ml catalase) with phalloidin-Alexa Fluor 647 (1 unit/mL). Epifluorescence laser imaging of Utrophin-GFP in live Cos7 cells ( Fig. 2 c) was performed at 37 °C and 5% CO 2 on an Elyra PS.1 inverted microscope (Zeiss) in epifluorescence mode. Images were obtained using a 63x objective (Plan-APOCHROMAT 63x/1.4 Oil, Zeiss) with additional 1.6x magnification which was used to collect fluorescence to an EMCCD camera (iXon 897, Andor), resulting in an image pixel size of 158.7 nm. 20,000 frames were acquired continuously with 10 ms exposure and 488 nm laser illumination at 0.5% of maximum intensity. 100 raw images were used to generate each SRRF image, yielding an effective temporal resolution of 1 s.
Show full methods section
Cell lines
Cos7 cells were cultured in phenol red-free Dulbecco’s modified Eagle’s medium (DMEM; Thermo Fisher Scientific) supplemented with 10% (v/v) fetal bovine serum (FBS; Gibco), 1% (v/v) penicillin/streptomycin (Thermo Fisher Scientific) and 2 mM L-alanyl-L-glutamine (GlutaMAX™, Thermo Fisher Scientific) at 37 °C in a 5% CO 2 incubator.
Sample preparation
For live-cell imaging, Cos7 cells were seeded on ultraclean ( Pereira et al., 2015 ) 25 mm diameter thickness #1.5 coverslips (Marienfeld) at a density of 0.3 – 0.9 × 10 5 cells/cm 2 . One day after splitting, cells were transfected with a plasmid encoding the calponin homology domain of utrophin fused to GFP (GFP-UtrCH, here Utrophin-GFP) ( Burkel et al., 2007 ) using Lipofectamin 2000 (Thermo Fisher Scientific) according to the manufacturer’s recommendations. Cells were imaged 1–4 days post transfection in culture medium. For phalloidin dSTORM imaging, Cos7 cells were fixed at 37 °C for 15 min with 4% paraformaldehyde in cytoskeleton-preserving buffer (PEM) (80 mM PIPES pH 6.8, 5 mM EGTA, 2 mM MgCl 2 ). After fixation cells were permeabilised (1X PEM with 0.25% Triton-X) for 20 min and stained with Phalloidin-AF647 (Molecular Probes, 4 units/mL) for 30 min.
Imaging d STORM Total Internal Reflection Fluorescence
(TIRF) imaging of Alexa Fluor 647-phalloidin in fixed cells ( Fig. 2 a) was performed on a N-STORM microscope (Nikon) using a 100x TIRF objective (Apo TIRF 100x/1.49 Oil, Nikon) and additional 1.5x magnification. Fluorescence emission was collected onto an EMCCD camera (iXon Ultra 897, Andor), yielding a pixel size of 107 nm. 30,000 frames were acquired with 33 ms exposure and 642 nm laser illumination at maximum output power. Drift was estimated using the inbuilt function in NanoJ-SRRF and correction applied during SRRF analysis. d STORM imaging was performed in GLOX buffer (150 mM Tris, pH 8, 1% glycerol, 1% glucose, 10 mM NaCl, 1% β-mercaptoethanol, 0.5 mg/ml glucose oxidase, 40 μg/ml catalase) with phalloidin-Alexa Fluor 647 (1 unit/mL). Epifluorescence laser imaging of Utrophin-GFP in live Cos7 cells ( Fig. 2 c) was performed at 37 °C and 5% CO 2 on an Elyra PS.1 inverted microscope (Zeiss) in epifluorescence mode. Images were obtained using a 63x objective (Plan-APOCHROMAT 63x/1.4 Oil, Zeiss) with additional 1.6x magnification which was used to collect fluorescence to an EMCCD camera (iXon 897, Andor), resulting in an image pixel size of 158.7 nm. 20,000 frames were acquired continuously with 10 ms exposure and 488 nm laser illumination at 0.5% of maximum intensity. 100 raw images were used to generate each SRRF image, yielding an effective temporal resolution of 1 s.
Laser-based confocal imaging of Utrophin-GFP in live
Cos7 cells ( Fig. 2 b) was performed on a TCS SP8 scanning confocal microscope (Leica) with a 63x objective (HC PL APO CS2 63x/1.4 Oil, Leica). Fluorescence detection was performed using a Leica HyD hybrid detector in BrightR mode with 10% gain for fluorescence detection using cropping and zoom adjusted to ensure 100 nm image pixels. 488 nm illumination was used at 0.5% of maximum intensity. The pinhole was set to 1 Airy unit and the acquisition time per frame was 20 ms, with 10,000 frames continuously acquired. 50 raw images were used to generate each SRRF image, yielding an effective temporal resolution of 1 s in the SRRF images. LED-illumination widefield imaging of Utrophin-GFP in live Cos7 cells ( Fig. 2 d–f ) was performed at 37 °C and 5% CO 2 on a N-STORM microscope (Nikon). A 100x TIRF objective (Plan-APOCHROMAT 100x/1.49 Oil, Nikon) with additional 1.5x magnification was used to collect fluorescence onto an EMCCD camera (iXon Ultra 897, Andor), yielding a pixel size of 107 nm. For continuous imaging, frames were acquired for 30 min with 30 ms exposure time and 490 nm LED illumination at 5% of maximum output. 100 raw images were used to generate each SRRF image, yielding an effective temporal resolution of 3 s. For timelapse imaging, settings were as for continuous imaging, except 100 raw frames (30 ms exposure) were acquired once every 10 min with the illumination shutter closed between acquisitions.
📊 Figures
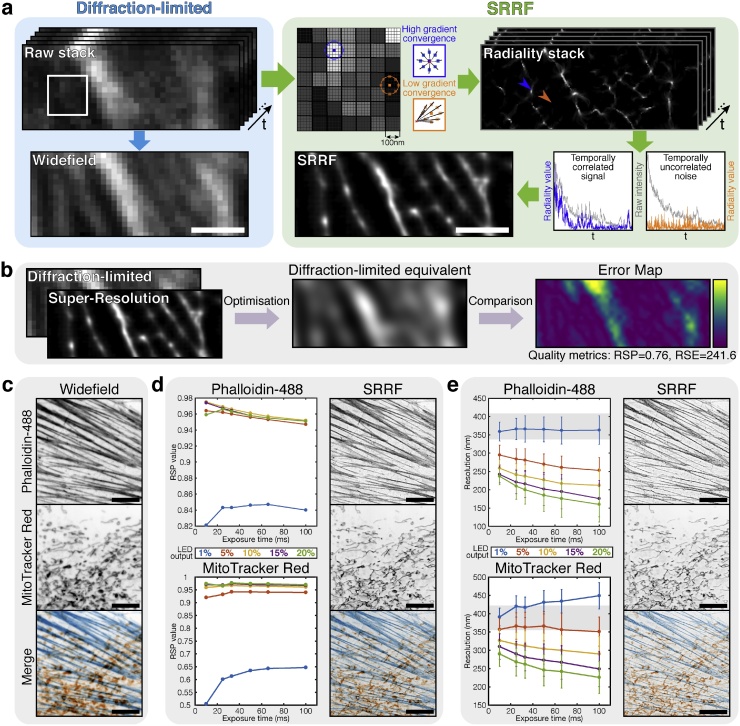
Fig. 1
OVERVIEW OF THE SRRF ALGORITHM AND OPTIMISING SRRF IMAGING. a) Raw data and processing steps in SRRF. The pale cyan box contains the raw, diffraction-limited data series that can be summed to create a...
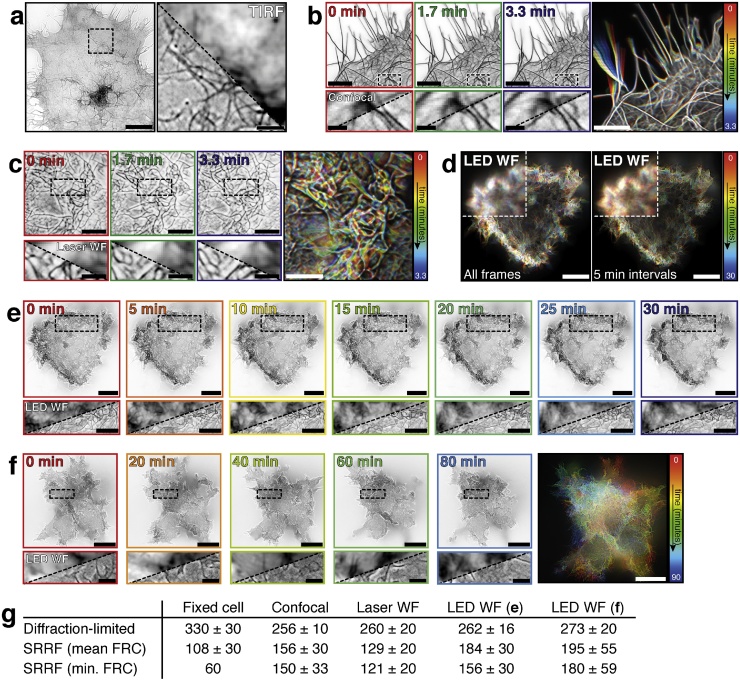
Fig. 2
SRRF IMAGING USING DIFFERENT MICROSCOPES. a) Left: SRRF image of Alexa Fluor-647-labelled phalloidin in fixed Cos7 cells imaged using TIRF with intense laser illumination. Scale baru202f=u202f10u202fu...
Figure images are served from the NIH/NLM PubMed Central Open Access Subset or Europe PMC; copyright remains with the publishers and authors.
💬 Discussion
0 commentsNo comments yet. Be the first to start a discussion!
Leave a Comment