Abstract
AbstractLittle is known about the role of islet delta cells in regulating blood glucose homeostasis in vivo. Delta cells are important paracrine regulators of beta cell and alpha cell secretory activity, however the structural basis underlying this regulation has yet to be determined. Most delta cells are elongated and have a well-defined cell soma and a filopodia-like structure. Using in vivo optogenetics and high-speed Ca2+ imaging, we show that these filopodia are dynamic structures that contain a secretory machinery, enabling the delta cell to reach a large number of beta cells within the islet. This provides for efficient regulation of beta cell activity and is modulated by endogenous IGF-1/VEGF-A signaling. In pre-diabetes, delta cells undergo morphological changes that may be a compensation to maintain paracrine regulation of the beta cell. Our data provides an integrated picture of how delta cells can modulate beta cell activity under physiological conditions.
🔬 Techniques
🔭 Microscopes
💻 Software
✨ Fluorophores
🧪 Sample Preparation
🔬 Cell Lines
🏭 Microscope Brands
🧪 Reagent Suppliers
🔎 Objectives
💻 Software Details
💾 Data Repositories
🏛️ Research Organizations (ROR)
Affiliated research institutions:
📋 Methods
Animals
All animal procedures were approved by the Institutional Animal Care and Use Committee (IACUC, protocol number 2013/SHS/816) of the SingHealth system or the Karolinska Instituet (protocol number N34/16) and complied with all relevant ethical regulations for animal testing and research. Transgenic mouse strains used in this study were from Jackson Laboratories. For in vitro studies, male and female mice were used. For in vivo imaging, female mice were used as donors and recipients. The following strains were used: SST-CRE (Ssttm2.1(CRE) Zjh/J ), Ai32-ChR2-YFP (B6;129S-Gt(ROSA)26 Sortm32(CAG-COP4*H134R/EYFP)Hze/J ), and GCaMP3 (B6;129S-Gt(ROSA)26Sor tm38(CAG-GCaMP3)Hze/J ). Wild-type (WT) C57/6NTac (In Vivos, Singapore) or C57/BL6J (Charles River, USA) mice were used as hosts of Sst-ChR2 and Sst-GCaMP3 islets, respectively.
Glucose tolerance tests
(GTT) were performed as described in 30 . Briefly, animals were fasted for 4–6 h after which the fasting blood glucose levels were measured at two time points 5 min apart. Next, mice were injected with 2 g glucose/kg body weight and blood glucose levels were measured every 15–30 min. For I.V.GTT in Sst-GCaMP3 transplanted mice, animals were anesthetized according to the imaging protocol (i.e., i.p. injection of a mixture of fluanisone (25 mg/kg), fentanyl (0.788 mg/kg) and midazolam (12.5 mg/kg)), glucose was injected in the tail vein (0.4 g/kg) and blood glucose was measured every 2 min (Accu-Check, Roche, Switzerland). For dietary treatments, animals were assigned for 6–7 weeks to either a control diet, CD (CD88137, 11% of energy from fat, 66% from carbohydrates, and 23% from proteins) or to a HFD (TD88137, 43% of energy from fat, 42% from carbohydrates, and 15% from proteins). Diets were acquired from Ssniff Spezialdiäten GmbH, Soest, Germany. Transplantation of islets into the anterior chamber of the eye (ACE) and in vivo microscopy Transplantation and in vivo imaging of ACE islets were performed as previously described 20 . In brief, islets from SST-ChR2-YFP or SST-GCaMP3 mice were isolated 24–48 h prior to transplantation using the collagenase method and recovered in vitro with fresh CMRL-1066 or RPMI 1640 medium supplemented with 10% fetal bovine serum. Delta cell GCaMP3 imaging was performed under the following anesthesia conditions: mixture of fluanisone (25 mg/kg), fentanyl (0.788 mg/kg), and midazolam (12.5 mg/kg). To image delta cell GCaMP3 in vivo (data shown in Fig. 1 ), animals were injected with insulin (0.25U/kg) 2 min prior to the injection of glucose. We determined that this 2-min time window would be used as a baseline for calculating the effect of glucose stimulation on delta cell activity. Subsequent imaging of delta cell GCaMP3 in animals fed CD or HFD diets did not involve insulin injection prior to glucose stimulation. When beta cell function was investigated in WT or SST-ChR2-YFP islets with GCaMP6s constructs, islets were transduced with an adenovirus carrying a RIP2-GCaMP6s-IRES-tdTomato construct immediately after isolation and the media was changed 24 h prior to transplantation. RIP2-GCaMP6s-IRES-tdTomato adenoviruses were produced in HEK293 cells and harvested 4–6 days after initial transfection. Next, 20 μL of the media containing the viruses was added to a 6-mm dish containing the freshly-isolated islets in 2 mL of RPMI 1640 medium supplemented with 10% fetal bovine for 16 h. The next day, the media was changed and islets incubated for 6 h prior to transplantation. The efficiency of this transduction protocol was variable ( n = 2–50 beta cells GCaMP6s-positive 2 days after transplantation) and the beta cells transduced were limited to the outer layers of the islet. On average, 5–20 islets were transplanted into the right ACE of the host mouse (8–12 weeks old) under anesthesia (2% isoflurane) as in reference 20 . In vivo imaging was performed with an upright multiphoton SP5 or SP8 microscope. For imaging delta cell function (SST-GCaMP3 mice), islets were allowed to engraft for at least 30 days prior to imaging with single- and two-photon laser scanning microscopy. For imaging beta cell function (WT or SST-ChR2-YFP islets transduced with the RIP2-GCaMP6s-IRES-tdTomato construct), islets were engrafted for 10–12 days prior to start of the experiments. In vivo optogenetic stimulation of delta cells was performed by pulsing (4 × 15-s pulses) a blue light (450–490 nm) through the imaging objective focused on the engrafted islet (Fig. 4a ). For monitoring of delta cell filopodia movement, SST-ChR2-YFP islets were imaged 90 days after transplantation. To avoid uncontrolled activation of delta cell ChR2 during imaging, islets and delta cells were imaged with two-photon LSM using a bidirectional resonant scanner (8000 Hz, Ex 970 nm Em 500–550 nm), that does not activate ChR2 28 . Imaging of GCaMP6s and tdTomato in controls and SST-ChR2-YFP islets was achieved with a laser wavelength of 1000 nm. Beta cells were identified by green (GCaMP6s) and red (tdTomato) fluorescence signal. ChR2-YFP delta cells were identified by a weak green (YFP) fluorescence. Eventual drifts in X , Y , and Z were corrected post hoc with custom registration algorithms described in ref. 47 .
Show full methods section
Animals
All animal procedures were approved by the Institutional Animal Care and Use Committee (IACUC, protocol number 2013/SHS/816) of the SingHealth system or the Karolinska Instituet (protocol number N34/16) and complied with all relevant ethical regulations for animal testing and research. Transgenic mouse strains used in this study were from Jackson Laboratories. For in vitro studies, male and female mice were used. For in vivo imaging, female mice were used as donors and recipients. The following strains were used: SST-CRE (Ssttm2.1(CRE) Zjh/J ), Ai32-ChR2-YFP (B6;129S-Gt(ROSA)26 Sortm32(CAG-COP4*H134R/EYFP)Hze/J ), and GCaMP3 (B6;129S-Gt(ROSA)26Sor tm38(CAG-GCaMP3)Hze/J ). Wild-type (WT) C57/6NTac (In Vivos, Singapore) or C57/BL6J (Charles River, USA) mice were used as hosts of Sst-ChR2 and Sst-GCaMP3 islets, respectively.
Glucose tolerance tests
(GTT) were performed as described in 30 . Briefly, animals were fasted for 4–6 h after which the fasting blood glucose levels were measured at two time points 5 min apart. Next, mice were injected with 2 g glucose/kg body weight and blood glucose levels were measured every 15–30 min. For I.V.GTT in Sst-GCaMP3 transplanted mice, animals were anesthetized according to the imaging protocol (i.e., i.p. injection of a mixture of fluanisone (25 mg/kg), fentanyl (0.788 mg/kg) and midazolam (12.5 mg/kg)), glucose was injected in the tail vein (0.4 g/kg) and blood glucose was measured every 2 min (Accu-Check, Roche, Switzerland). For dietary treatments, animals were assigned for 6–7 weeks to either a control diet, CD (CD88137, 11% of energy from fat, 66% from carbohydrates, and 23% from proteins) or to a HFD (TD88137, 43% of energy from fat, 42% from carbohydrates, and 15% from proteins). Diets were acquired from Ssniff Spezialdiäten GmbH, Soest, Germany. Transplantation of islets into the anterior chamber of the eye (ACE) and in vivo microscopy Transplantation and in vivo imaging of ACE islets were performed as previously described 20 . In brief, islets from SST-ChR2-YFP or SST-GCaMP3 mice were isolated 24–48 h prior to transplantation using the collagenase method and recovered in vitro with fresh CMRL-1066 or RPMI 1640 medium supplemented with 10% fetal bovine serum. Delta cell GCaMP3 imaging was performed under the following anesthesia conditions: mixture of fluanisone (25 mg/kg), fentanyl (0.788 mg/kg), and midazolam (12.5 mg/kg). To image delta cell GCaMP3 in vivo (data shown in Fig. 1 ), animals were injected with insulin (0.25U/kg) 2 min prior to the injection of glucose. We determined that this 2-min time window would be used as a baseline for calculating the effect of glucose stimulation on delta cell activity. Subsequent imaging of delta cell GCaMP3 in animals fed CD or HFD diets did not involve insulin injection prior to glucose stimulation. When beta cell function was investigated in WT or SST-ChR2-YFP islets with GCaMP6s constructs, islets were transduced with an adenovirus carrying a RIP2-GCaMP6s-IRES-tdTomato construct immediately after isolation and the media was changed 24 h prior to transplantation. RIP2-GCaMP6s-IRES-tdTomato adenoviruses were produced in HEK293 cells and harvested 4–6 days after initial transfection. Next, 20 μL of the media containing the viruses was added to a 6-mm dish containing the freshly-isolated islets in 2 mL of RPMI 1640 medium supplemented with 10% fetal bovine for 16 h. The next day, the media was changed and islets incubated for 6 h prior to transplantation. The efficiency of this transduction protocol was variable ( n = 2–50 beta cells GCaMP6s-positive 2 days after transplantation) and the beta cells transduced were limited to the outer layers of the islet. On average, 5–20 islets were transplanted into the right ACE of the host mouse (8–12 weeks old) under anesthesia (2% isoflurane) as in reference 20 . In vivo imaging was performed with an upright multiphoton SP5 or SP8 microscope. For imaging delta cell function (SST-GCaMP3 mice), islets were allowed to engraft for at least 30 days prior to imaging with single- and two-photon laser scanning microscopy. For imaging beta cell function (WT or SST-ChR2-YFP islets transduced with the RIP2-GCaMP6s-IRES-tdTomato construct), islets were engrafted for 10–12 days prior to start of the experiments. In vivo optogenetic stimulation of delta cells was performed by pulsing (4 × 15-s pulses) a blue light (450–490 nm) through the imaging objective focused on the engrafted islet (Fig. 4a ). For monitoring of delta cell filopodia movement, SST-ChR2-YFP islets were imaged 90 days after transplantation. To avoid uncontrolled activation of delta cell ChR2 during imaging, islets and delta cells were imaged with two-photon LSM using a bidirectional resonant scanner (8000 Hz, Ex 970 nm Em 500–550 nm), that does not activate ChR2 28 . Imaging of GCaMP6s and tdTomato in controls and SST-ChR2-YFP islets was achieved with a laser wavelength of 1000 nm. Beta cells were identified by green (GCaMP6s) and red (tdTomato) fluorescence signal. ChR2-YFP delta cells were identified by a weak green (YFP) fluorescence. Eventual drifts in X , Y , and Z were corrected post hoc with custom registration algorithms described in ref. 47 .
Islet immunohistochemistry
Immunohistochemistry of pancreas and isolated islets was performed in 30–40 µm thick pancreas slices or isolated islet whole mounts as described before 30 . In brief, mouse and human pancreata were fixed overnight in fresh 4% paraformaldehyde and cryo-protected in 30% sucrose for 12 h and embedded in OCT and sectioned. Human pancreas was from cadaveric donors ( n = 5, Singapore General Hospital). Use of human tissues (with no traceable information besides age and sex) was approved by the SingHealth Centralized Institutional Review Board (IRB#2013-504-A), complied with all relevant ethical regulations for use of human tissues in research and had donor consent for use in research and publication. The following primary antibodies were used: guinea pig anti-insulin (pancreas 1:400, isolated islets 1:1500, Dako - A0564), mouse anti-glucagon (1:400, Sigma-Aldrich—G2654), rat anti-somatostatin (pancreas, 1:400 Millipore—AB5494, isolated islets 1:700, BioRad 8330-0009), goat anti-CD31 (1:100, RD Systems—AF3628), rabbit anti-VAMP2 (1:100, Cell Signaling—13508 S), rabbit anti-synaptophysin (1:100, Abcam—ab32594), and rabbit anti-CaV1.2 (1:50, Alomone—ACC-003). Secondary antibodies were raised in donkey and were conjugated to Alexa 488, 546, 561, or 647 fluorophores. Nuclei were labeled with DAPI (1:400, Invitrogen). Incubation of isolated SST-ChR2 islets with FM-4-64 (Invitrogen, T13320 ) was performed at room temperature (~23 o C), according to manufacturer guidelines. Islets were incubated with FM-4-64 at low glucose (3 mM) in Ca 2+ buffered solution (125 mM NaCl, 5.9 mM KCl, 2.56 mM CaCl 2 , 1.2 mM MgCl 2 , and 25 mM HEPES) for 3 min the day after isolation and overnight recovery in vitro. After incubation, islets were fixed in 4% PFA for 30 min, mounted on a coverslip and prepared for imaging. Simulation of delta cell contact densities and reach in islet sections Mouse and human islets immunostained with anti-insulin, -glucagon, and/or -somatostatin antibodies and DAPI were mapped using an imageJ plugin as previously described 29 . In brief, the nuclei and cells are segmented in 3D, which generates a “geographical” map of alpha, beta, and/or delta cells in XY and Z planes of each islet (Supplementary Fig. 3A–C ). Next, we determined the number of direct delta cell contacts (characterized by adjacent cell boundaries 29 ) with neighboring alpha or beta cells. This information is translated into a measure of “contact frequency”, which is the percentage of alpha or beta cells contacted by a given delta cell (e.g., if a delta cell contacts 2 out of 20 total mapped alpha cells, that delta cell’s contact frequency with alpha cells is 10%). This process is repeated for each delta cell mapped. Next, once the position of each alpha and/or beta and delta cell is known, we simulate the expected contact density that would be observed if the boundaries of each delta cell were expanded by 1 µm increments in all possible directions (except towards the outside of the islet structure) until it reaches a maximum “filopodia length” value determined by the user (Supplementary Fig. 3J ). In vitro islet treatment with axitinib, picropodophyllin, or insulin Isolated islets were used 6 h after isolation and incubated with the VEGFR inhibitor (axitinib, Sigma-Aldrich, 0.1 µM) and/or the IGF-1R inhibitor (Picropodophyllin, PPP, Sigma-Aldrich, 0.1 µM) for 30–60 min prior to incubation with VEGF-A (PeproTech #450-32, 100 ng/mL), IGF-1 (Novus Biologicals 791-MG, 20 ng/mL) or insulin (NovoNordisk, 1 µM) for the following 24 h. After incubation, isolated islets were fixed in 4% PFA for 30 min and immunohistochemistry was performed as described above. Measurements of delta cell filopodia for all experimental groups were performed in a blind fashion, where the person analyzing the images did not know the identity of all experimental groups until the analysis was completed.
High-resolution confocal imaging of pancreatic islets and imaging processing
Confocal imaging was performed on a Leica up-right or inverted SP5 or SP8 microscope fitted with a white light laser and gated Hybrid detectors. FM-4-64 stained islets were imaged using the following excitation and emission configuration: YFP, Ex510nm and Em520-570nm, FM-4-64, Ex510nm and Em630–680nm. Islet viability was checked prior to imaging with backscatter analyses 20 . For co-localization studies, isolated islets or sections were mounted on 80% glycerol/PBS (with 0.2% n-propyl gallate (NPG, Sigma) as anti-fade agent) and acquired with a glycerol 63×/1.3NA objective with a correction collar adjusted to the focal plane prior to imaging. Images were acquired using Nyquist acquisition parameters for the X ,Y , and Z axis and de-convolved using Huygens software (Scientific Volume Imaging). For deconvolution, the signal-to-noise ratio was determined for each channel and the deconvolution parameters set for 40 iterations and a quality threshold of 0.05. Co-localization was determined with IMARIS software (Bitplane) co-localization module and automatic thresholding for each channel. Imaging of mouse pancreatic sections from animals fed with a CD or HFD was performed in samples mounted in Prolong ® antifade solution with DAPI (ThermoFisher) and acquired with a glycerol 100× objective. Imaging of isolated islets treated in vitro, was performed in PBS with a water-immersion 25 × /0.95NA objective. Somatostatin was imaged with Alexa488 secondary antibodies and TPM with an excitation line of 800 nm. For simulations determining the reach and contact density of delta cells in mouse and human islets, we utilized a 3D tissue analysis ImageJ algorithm as previously described 29 . In vivo Ca 2+ trace imaging data extraction and analysis Extraction of in vivo delta cell Ca 2+ traces (i.e., raw GcAMP3 signal) was done in MATLAB using the CaImAn plugin as previously described 48 . In brief, we used the “demo script” within the CaImAn package to extract the Ca 2+ data from movement-corrected and background-subtracted GCaMP3 image stacks. We used the script to identify cells (i.e., regions of interest, ROIs) automatically (CaImAn parameters: K = 50, tau = 10, and p = 1) and normalized the GCaMP3 signal to the highest intensity peak in each cell. As a second step, the software-detected ROIs were manually curated to make sure that only ROIs representing cells were selected for analysis. Next, we ran a peak-finding function and considered all peaks that met the arbitrary threshold of 1× higher than the standard deviation of the whole in vivo recording for each cell. This threshold was chosen because it could detect peaks in all control and HFD-fed animals imaged in vivo, where the latter have overall lower peak amplitudes that could not be detected with higher thresholds. Next, the peak location and amplitude for each cell was plotted and analyzed using excel software. In addition, the modified demo script contains a classic MATLAB function that integrates the normalized GCaMP3 signal from each detected cell in a given islet to generate a hierarchical clustering analysis (HCA) (details in https://www.mathworks.com/help/stats/hierarchical-clustering.html ). Analysis of beta cell Ca 2+ traces acquired via GCaMP6s imaging was done as follows: First, we calculated the GCaMP6s/dtTomato signal intensity ratio for each identified beta cell for the entire imaging session. Next, the files containing the GCaMP6s/dtTomato ratio were analyzed with a custom MATLAB script that identified [Ca 2+ ] i peaks that passed the arbitrary threshold of 1.5× above the standard deviation for the entire imaging experiment and for each cell. Next, the location and amplitude for all [Ca 2+ ] i peaks in control and SST-ChR2 islets were quantified and normalized to the highest amplitude peak in the entire run.
Electrophysiological recordings from delta cells Acute pancreas slices from SSTxcre-Ai32
ChR2 eGFP mice were prepared by embedding pancreas tissue in low-melting agarose. Tissue was sliced in ice-cold cutting solution containing (in mM: sucrose 250, NHCO 3 26, glucose 10, MgCl 2 4, myo-inositol 3, KCl 2.5, sodium pyruvate 2, NaH 2 PO 4 2H 2 O 1.25, ascorbic acid 0.5, CaCl 2 0.1, and kynurenic acid 1), then kept at room temperature (23 °C) in ACSF (in mM: NaCl 126, NaHCO 3 24, NaH 2 PO 4 1, KCl 2.5, CaCl 2 2, MgCl 2 2, glucose 4, ascorbic acid 0.4, 300–310 mOsm) bubbled with a 95% O 2 /5% CO 2 mixture. Delta cells were identified by their eYFP expression and their electrical signals were measured by standard whole-cell patch-clamp recordings (10–15 MΩ resistance electrodes) and K-gluconate based internal solution (in mM: K-gluconate 130, KOH 10, MgCl 2 2.5, HEPES 10, Na 2 ATP 4, Na 3 GTP 0.4, EGTA 5, Na 2 phosphocreatinin 5, 290–295 mOsm, 7.4 pH). Cells were current clamped at a resting potential of −70 to −75 mV and cell voltage responses to a brief light flash of a mercury arc lamp (465–495 nm, 10 ms, 1–10 Hz) were recorded via a Multiclamp 700B amplifier with Digidata 1440 A interface (Molecular Devices).
Electron microscopy of mouse and human pancreas
Small volumes of a mouse and a human pancreas were fixed and prepared for electron microscopy as described in reference 49 . Islet sections were imaged with scanning and transmission electron microscopy and delta cells identified using established guidelines for islet electron micrographs. 3D electron tomograms of mouse delta cell filopodia were acquired as described in reference 49 and their structure was reconstructed using IMOD software (University of Colorado).
Statistics
All statistics were performed using Graphpad Prism 7 and unless otherwise noted, testing of significance between experimental groups was done using OneWay Anova with a two-stage linear step-up procedure of Benjamini, Krieger, and Yekutieli post test to control for the false discovery rate (FDR) with a Q value between 0.01 and 0.005. Reporting summary Further information on research design is available in the Nature Research Reporting Summary linked to this article.
Supplementary information Supplementary Information Peer Review File Description of Additional Supplementary Files Supplementary Data 1 Supplementary Data 2 Supplementary Movie 1 Supplementary Movie 2 Supplementary Movie 3 Supplementary Movie 4 Reporting Summary
📊 Figures
Fig. 1
Delta cell activity in vivo. Delta cells are activated by increasing glucose levels. Longitudinal imaging of in vivo activity in islets expressing the Ca 2+ reporter GCaMP3 in delta cells. a Maximum p...
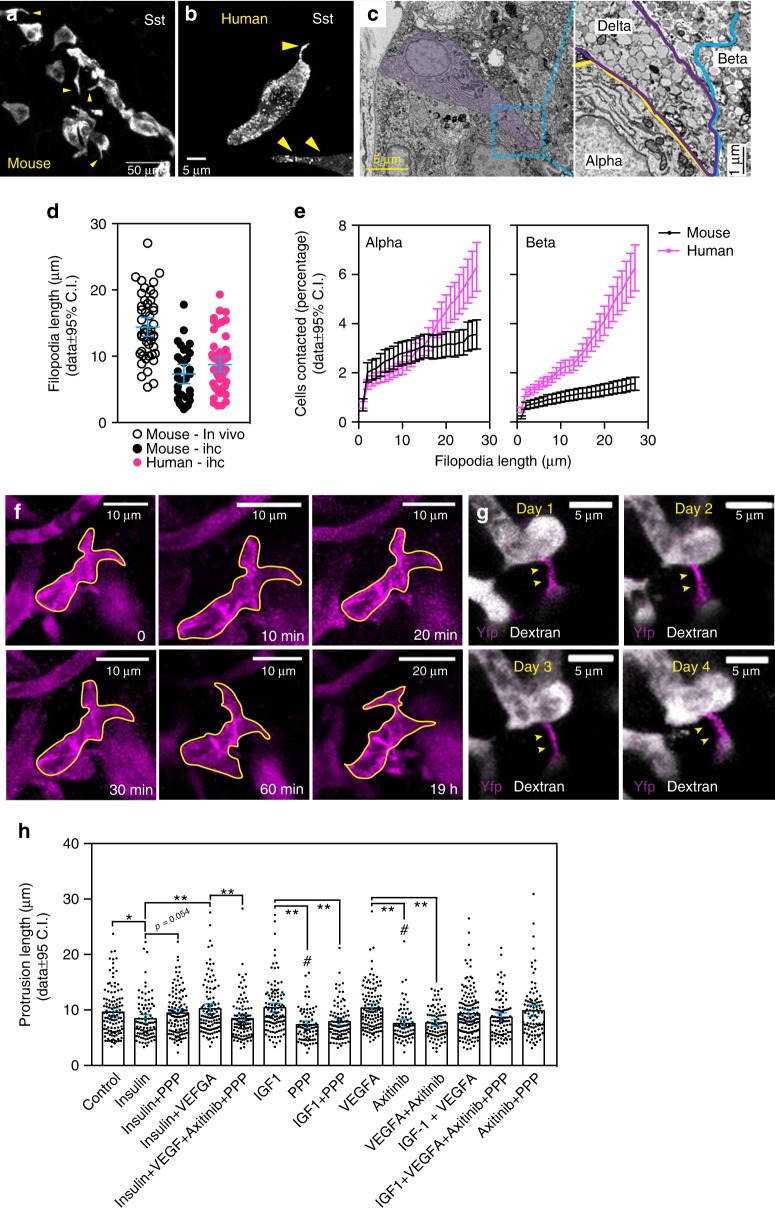
Fig. 2
Cyto-architecture of delta cells in rodents and human islets. Delta cells send out cellular processes (filopodia) to increase their intra-islet reach. Maximum projection images of representative mouse...
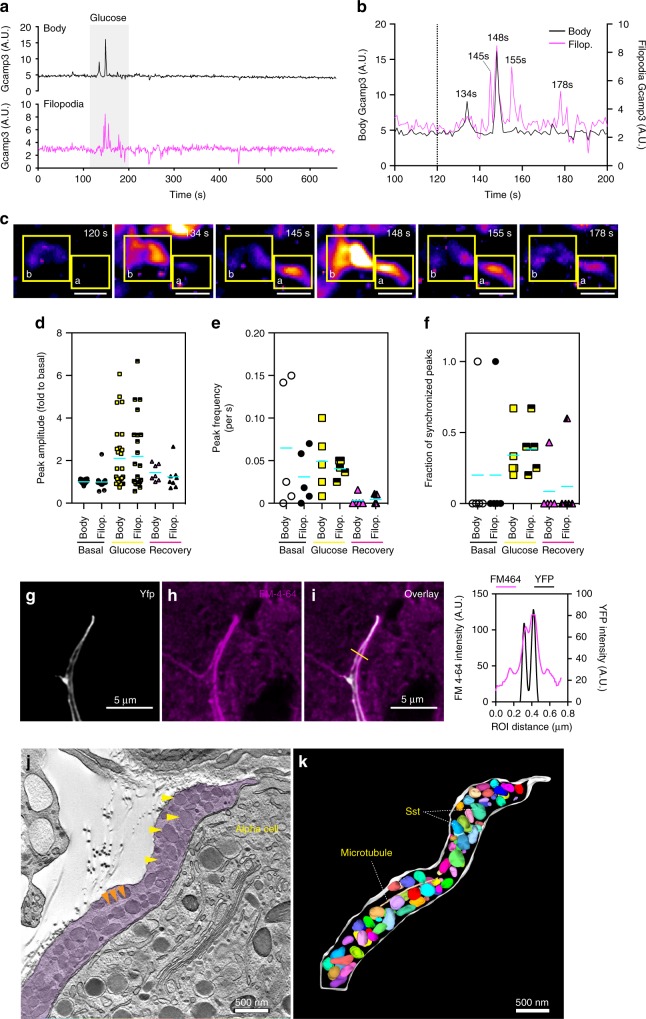
Fig. 3
Islet delta cell filopodia have independent Ca 2+ spikes from the soma and contain secretory granules. Delta cell filopodia display Ca 2+ spikes in vivo upon stimulation with glucose. a Representative...
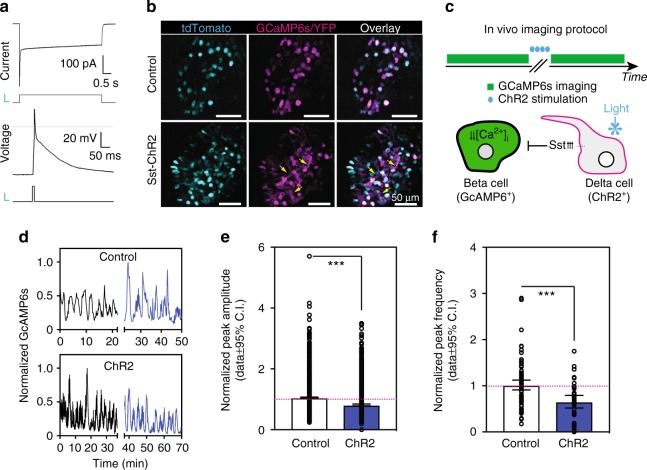
Fig. 4
Optogenetic control of delta cell activity. Somatostatin reduces beta cell [Ca 2+ ] i oscillatory frequency and peak amplitude, and hyperglycemia is associated with impaired delta cell function and lo...
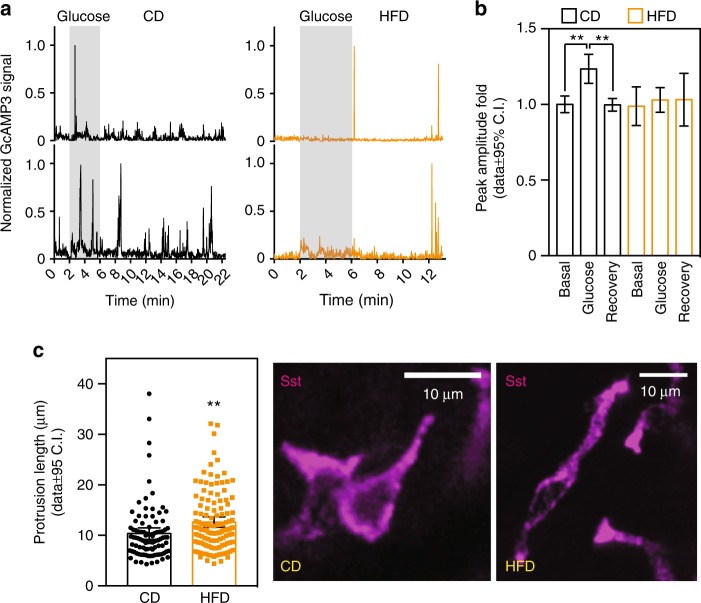
Fig. 5
Delta cell activity is impaired in prediabetes. a Representative normalized traces of GCaMP3 signals measured in vivo in delta cells from animals fed with control (CD, black lines) or HFD (orange line...
Figure images are served from the NIH/NLM PubMed Central Open Access Subset or Europe PMC; copyright remains with the publishers and authors.
💬 Discussion
0 commentsNo comments yet. Be the first to start a discussion!
Leave a Comment