Abstract
Abstract Chromatin organization is crucial for regulating gene expression. Previously, we showed that nucleosomes form groups, termed clutches. Clutch size correlated with the pluripotency grade of mouse embryonic stem cells and human induced pluripotent stem cells. Recently, it was also shown that regions of the chromatin containing activating epigenetic marks were composed of small and dispersed chromatin nanodomains with lower DNA density compared to the larger silenced domains. Overall, these results suggest that clutch size may regulate DNA packing density and gene activity. To directly test this model, we carried out 3D, two-color super-resolution microscopy of histones and DNA with and without increased histone tail acetylation. Our results showed that lower percentage of DNA was associated with nucleosome clutches in hyperacetylated cells. We further showed that the radius and compaction level of clutch-associated DNA decreased in hyperacetylated cells, especially in regions containing several neighboring clutches. Importantly, this change was independent of clutch size but dependent on the acetylation state of the clutch. Our results directly link the epigenetic state of nucleosome clutches to their DNA packing density. Our results further provide in vivo support to previous in vitro models that showed a disruption of nucleosome-DNA interactions upon hyperacetylation.
🔬 Techniques
🔭 Microscopes
💻 Software
✨ Fluorophores
🧪 Sample Preparation
🔬 Cell Lines
🏭 Microscope Brands
🧪 Reagent Suppliers
🔴 Lasers
📷 Detectors
🔎 Objectives
🎨 Filters
💻 Software Details
🏛️ Research Organizations (ROR)
Affiliated research institutions:
📋 Methods
Cell culture and sample preparation Human
Fibroblasts (hFb) (BJ, Skin Fibroblast, American Type Culture Collection, ATCC CRL-2522) were cultured in DMEM (#41965062, Gibco) supplemented with 10% FBS (#10270106, Gibco), 1× non-essential amino acids (#11140050, Gibco), 1× Penicillin/Streptomycin (#15140122, Gibco) and 1× GlutaMax (#35050061, Gibco). For DNA labeling experiments, cells were cultured with 5 μM ethynil-deoxy-cytdine (EdC) (#T511307, Sigma-Aldrich) for 96 h previous to fixation. For hyperacetylation experiments, hFb were treated with 300 nM of TrychostatinA (TSA) (#T8552 Sigma-Aldrich) in complete growth medium supplemented with 5 μM EdC during the final 24 h of the 96 h EdC incubation before fixation. When using fiduciary markers for drift correction and 3D overlap, growth media with EdC was supplemented with 1:800 dilution of 160 nm amino yellow beads (#AFP-0252-2, Spherotech) for the final 1 h prior to fixation to permit internalization of the beads into the cells prior to fixation. Cell cycle analysis hFb were grown in growth media supplemented with EdC for 96 h. The cells were collected and were resuspended gently with ethanol 70% at –20C. The cells were pelleted, washed and resuspended in propidium iodide (Molecular Probes, #P-1304) 0.03 mg/ml, Sodium Citrate 1.1 mM and RNAse A (Sigma, #R-5503) 0.3 mg/ml in PBS at 4°C overnight. Flow cytometry analysis was performed in a FACSCalibur (BD Biosciences). Cell cycle analysis was performed using the ModFit program.
Staining for STORM
For imaging experiments, cells were plated on eight-well Lab-tek #1 borosilicate chambers (#155411, Nunc) at a seeding density of 20 000–30 000 per well for immunostaining experiments; and at a seeding density of 5000–10 000 cells per well for DNA labeling experiment to allow cell proliferation and hence EdC incorporation to the genome. The cells were fixed with 4% PFA (#43368, Alfa Aesar) diluted in PBS for 15 min at room temperature (RT). Then, they were permeabilized with 0.3% (v/v) Triton X-100 (#327371000, AcrosOrganics) in PBS for 15 min at room temperature. Cells were then blocked using 10% BSA (#9048468 Fisher Scientific) (w/v), 0.01% (v/v) Triton X-100 in PBS. Cells were incubated overnight with the rabbit polyclonal anti-H2B (Abcam, #1790) primary antibody diluted 1:50 in blocking buffer, at 4°C with gentle rocking. Finally, cells were washed three times with blocking buffer, then incubated with 1:50 secondary antibody for STORM Imaging (see below) for 1 h at room temperature. For PAINT labeling, we used the Ultivue Paint Kit (Ultivue-2). Cells were incubated for 2 h at room temperature with 1:100 of Goat-anti-Rabbit (D2) antibody diluted in Antibody Dilution Buffer. Lastly, click chemistry was performed. For click chemistry, we prepared a reaction consisting of HEPES pH 8.2 150 mM, amino guanidine 50 mM (#396494, Sigma), ascorbic acid 100 mM (#A92902, Sigma), CuSO4 1 mM, glucose 2% (#G8270, Sigma), Glox (described in STORM imaging) 1:1000 and Alexa647 azide 10 nM (#A10277, Thermo). The sample was incubated in this reaction for 30 min at RT. Repeated washing was done at every step. Secondary antibody used was donkey-anti rabbit NHS ester (Jackson ImmunoResearch) custom labeled with AF405/AF647 activator reporter dyes as previously described ( 58 ).
Show full methods section
Cell culture and sample preparation Human
Fibroblasts (hFb) (BJ, Skin Fibroblast, American Type Culture Collection, ATCC CRL-2522) were cultured in DMEM (#41965062, Gibco) supplemented with 10% FBS (#10270106, Gibco), 1× non-essential amino acids (#11140050, Gibco), 1× Penicillin/Streptomycin (#15140122, Gibco) and 1× GlutaMax (#35050061, Gibco). For DNA labeling experiments, cells were cultured with 5 μM ethynil-deoxy-cytdine (EdC) (#T511307, Sigma-Aldrich) for 96 h previous to fixation. For hyperacetylation experiments, hFb were treated with 300 nM of TrychostatinA (TSA) (#T8552 Sigma-Aldrich) in complete growth medium supplemented with 5 μM EdC during the final 24 h of the 96 h EdC incubation before fixation. When using fiduciary markers for drift correction and 3D overlap, growth media with EdC was supplemented with 1:800 dilution of 160 nm amino yellow beads (#AFP-0252-2, Spherotech) for the final 1 h prior to fixation to permit internalization of the beads into the cells prior to fixation. Cell cycle analysis hFb were grown in growth media supplemented with EdC for 96 h. The cells were collected and were resuspended gently with ethanol 70% at –20C. The cells were pelleted, washed and resuspended in propidium iodide (Molecular Probes, #P-1304) 0.03 mg/ml, Sodium Citrate 1.1 mM and RNAse A (Sigma, #R-5503) 0.3 mg/ml in PBS at 4°C overnight. Flow cytometry analysis was performed in a FACSCalibur (BD Biosciences). Cell cycle analysis was performed using the ModFit program.
Staining for STORM
For imaging experiments, cells were plated on eight-well Lab-tek #1 borosilicate chambers (#155411, Nunc) at a seeding density of 20 000–30 000 per well for immunostaining experiments; and at a seeding density of 5000–10 000 cells per well for DNA labeling experiment to allow cell proliferation and hence EdC incorporation to the genome. The cells were fixed with 4% PFA (#43368, Alfa Aesar) diluted in PBS for 15 min at room temperature (RT). Then, they were permeabilized with 0.3% (v/v) Triton X-100 (#327371000, AcrosOrganics) in PBS for 15 min at room temperature. Cells were then blocked using 10% BSA (#9048468 Fisher Scientific) (w/v), 0.01% (v/v) Triton X-100 in PBS. Cells were incubated overnight with the rabbit polyclonal anti-H2B (Abcam, #1790) primary antibody diluted 1:50 in blocking buffer, at 4°C with gentle rocking. Finally, cells were washed three times with blocking buffer, then incubated with 1:50 secondary antibody for STORM Imaging (see below) for 1 h at room temperature. For PAINT labeling, we used the Ultivue Paint Kit (Ultivue-2). Cells were incubated for 2 h at room temperature with 1:100 of Goat-anti-Rabbit (D2) antibody diluted in Antibody Dilution Buffer. Lastly, click chemistry was performed. For click chemistry, we prepared a reaction consisting of HEPES pH 8.2 150 mM, amino guanidine 50 mM (#396494, Sigma), ascorbic acid 100 mM (#A92902, Sigma), CuSO4 1 mM, glucose 2% (#G8270, Sigma), Glox (described in STORM imaging) 1:1000 and Alexa647 azide 10 nM (#A10277, Thermo). The sample was incubated in this reaction for 30 min at RT. Repeated washing was done at every step. Secondary antibody used was donkey-anti rabbit NHS ester (Jackson ImmunoResearch) custom labeled with AF405/AF647 activator reporter dyes as previously described ( 58 ).
STORM imaging and analysis
Imaging of H2B in single color images with spectrally different dyes was performed on a custom-built inverted microscope based on Nikon Eclipse Ti frame (Nikon Instruments). The excitation module was equipped with five excitation laser lines: 405 nm (100 mW, OBIS Coherent, CA, USA), 488 nm (200 mW, Coherent Sapphire, CA, USA), 561 nm (500 mW MPB Communications, Canada), 647 nm (500 mW MPB Communications, Canada) and 750 nm (500 mW MPB Communications, Canada). Each laser beam power was regulated through AOMs (AA Opto Electonics MT80 A1,5 Vis) and different wavelengths were coupled into an oil immersion 1.49 NA objective (Nikon). An inclined illumination mode ( 59 ) was used to obtain the images. The focus was locked through the Perfect Focus System (Nikon). The fluorescence signal was collected by the same objective and imaged onto an EMCCD camera (Andor iXon X3 DU-897, Andor Technologies). Fluorescence emitted signal was spectrally filtered by either a Quad Band beamsplitter (ZT405/488/561/647rpc-UF2, Chroma Technology) with Quad Band emission filter (ZET405/488/561/647m-TRF, Chroma), or a custom Penta Band beamsplitter (ZT405/488/561/647/752rpc-UF2) with a Penta Band Emission filter (ZET405/488/561/647-656/752m) as in ( 40 ). STORM and STORM+PAINT raw image data were acquired at 20 ms per frame. 488, 560, 647 or 750 nm lasers were used for exciting the reporter dye and switching it to the dark state, and a 405 nm laser was used for reactivating the reporter dye. An imaging cycle was used in which one frame belonging to the activating pulse laser (405) was alternated with three frames belonging to the reporter dye. Single color imaging was performed using a previously described imaging buffer ( 58 ): 100mM Cysteamine MEA (#30070, Sigma-Aldrich), 5% glucose (#G8270, Sigma-Aldrich, 1% Glox (0.5 mg/ml glucose oxidase, 40 mg/ml catalase (#G2133 and #C100, Sigma-Aldrich)) in PBS. A minimum of 45 000 frames were obtained for every image. For dual color, 3D SMLM images were acquired with a commercial N-STORM microscope (Nikon) equipped with a CFI HP Apochromat TIRF 100 × 1.49 oil objective, an iXon Ultra 897 camera (Andor) and a Dual View system (Photometrics DV2 housing with a T647lpxr dichroic beamsplitter from Chroma). The dual view allowed us to split the image on the full chip of the camera based on emission wavelength. 647 nm laser was used to excite the DNA labeled with AlexaFluor 647 using a power density of ∼3 kW/cm 2 . Simultaneously, in order to perform PAINT, the 560 nm laser was used with ∼0.8 kW/cm 2 power density to excite the dye attached to the imager strand. The 405 laser was used for reactivating AlexaFluor 647 via dSTORM during acquisition. The 488 laser at ∼0.1 kW/cm 2 power density was used to illuminate the fiduciary beads, which were used for drift correction and chromatic alignment. The imaging cycle was composed by 19 frames of simultaneous 405, 560 and 647 nm activation interspersed with one frame of 488 nm illumination. The yellow beads imaged with the 488 nm laser were visible in both the red and orange channel, albeit dimly in the red channel. In all cases, Alexa 647 was progressively reactivated with increasing 405 nm laser power during acquisition up to a maximal power density of 0.020 kW/cm 2 . The imaging buffer was composed of 100 mM Cysteamine MEA, 5% glucose, 1% Glox and 0.75 nM Imager strand (I2-560 Ultivue) in Ultivue Imaging Buffer. Localizations were extracted from raw images of bead calibration, STORM and STORM+PAINT data using Insight3 standalone software (kind gift of Bo Huang, UCSF). The N-STORM cylindrical lens adaptor was used for STORM+PAINT data acquisition to obtain 3D localization data, as previously described ( 60 ). Briefly, calibration data was first acquired by imaging subdiffraction limit size beads (100 nm Tetraspeck, ThermoScientific, T7279) in PBS adsorbed to clean glass at low enough dilution to enable single bead visualization.
Using the NIS software
STORM module, Z -calibration data was recorded as the microscope stage was moved in 10 nm steps over a 1.6 μm range and through the objective focal plane to image the elliptically shaped beads as they first elongated vertically, then horizontally. Bead localizations were extracted using the aforementioned Insight3 software through elliptical Gaussian fitting to extract horizontal and vertical width values ( W x and W y , respectively). These widths were plotted versus the distance of the localization from the imaging focal plane, then fit with a third order polynomial, as previously established ( 60 ). The coefficients of the polynomial function were input into the Insight3 software to enable assignment of an axial, z , position to elliptical localizations from STORM+PAINT data in addition to their lateral, x and y , positions. Rendering of DNA and histone images was performed using a summation of uniform Gaussian peaks having a fixed standard deviation of 20 nm.
STORM-PAINT workflow
STORM localizations of DNA structure in the red 647nm channel were overlaid with PAINT localizations of histone structure in the orange 560 nm channel through a defined, multistep data workflow. Firstly, the same Tetraspeck beads used for Z -calibration were utilized to define a single, second order polynomial surface transfer function to overlay the two colors in x and y when imaged with the dual view. To this end, beads in 10–15 separate fields of view were imaged for 100 frames. The localizations were grouped into bead-clusters and their center identified. The bead centers from all fields of view were combined to create a pseudo-high density image map to define the registration between the orange and red channel and remove residual chromatic aberrations. Raw STORM+PAINT image data was obtained using the aforementioned microscope hardware, including the dual view and NSTORM cylindrical lens, to record a minimum of 200 000 frames with 20 ms camera exposure. Red-channel STORM localizations were extracted in 3D from the 20 ms images. For the orange channel PAINT localizations, five sequential image frames were first summed together to obtain an effective 100ms camera exposure, then the 3D localizations were extracted from these summed frame images. The five-frame summed images were used also to extract red-channel fiduciary bead localizations, and thereby improve the bead's signal-to-background ratio, while the orange-channel fiduciary bead localizations were extracted from the raw 20 ms images. All orange-channel localizations were first overlaid upon the red channel localizations in x and y using the second order polynomial surface transfer function. Next, bead localizations in each color were grouped into bead-clusters and used to extract and correct the drift trajectory for each color throughout data acquisition. Following drift correction of the datasets, the fiduciary bead positions were used to refine the lateral alignment of the two datasets in x and y using a linear affine transformation. Finally, the axial positions of the fiduciary beads were used to apply a rigid Z -translation to the orange dataset and fully overlay the 3D DNA and histone datasets. Once aligned, a 120 nm slice centered near the imaging focal plane (i.e. Z = 0) was selected for further co-structural analysis. This workflow was automated using functions developed in MATLAB version 2013a and 2016a.
Voronoi tesselation analysis
Voronoi tesselation analysis was performed in MATLAB 2016a in a fashion similar to ( 28 ). First, the lateral x , y localizations were input into the ‘delaunayTriangulation’ function, and then used to construct Voronoi polygons using the ‘Voronoidiagram’ function. Areas of the Voronoi polygons were determined from the vertices with the function ‘polyarea’. The local density in each data point was defined as the inverse value of the area of the corresponding Voronoi polygon. Voronoi polygons were visualized using the ‘patch’ function, wherein the look up table was mapped to cover 99% of the polygons; the smallest polygons being yellow (high density, >0.02 nm −2 ), larger polygons set to blue, (low density, 0.05, * P ≤ 0.05, ** P ≤ 0.01, *** P ≤ 0.001, **** P ≤ 0.0001.
Dataset selection & H2B cluster analysis
The inclined illumination utilized on our microscope systems often gave rise to illumination inhomogeneity that was visualized as long, straight areas of a nucleus having sparse localizations. Sub-regions having a more uniform illumination for both 560 and 647 nm laser lines were selected manually and used for H2B and DNA data analysis. A single sub-region was selected for each dataset. We measured the median lateral localization precision for visualizing H2B in situ via DNA-PAINT ( 36 ) methodology to be 20.6 nm (16.4, 25.0 interquartile range). The precision was determined by calculating lateral localization precision as the 2D width of a point cloud for localizations visualized in five or more sequential imaging frames ( 61 ). H2B cluster segmentation analysis was performed using the same algorithm previously published ( 8 ). STORM-DNA and PAINT-H2B images were subjected to a quality test as described next and only those images that passed the quality test were accepted for further analysis. DNA datasets were selected according to an estimate for their Nyquist sampling frequency as described previously ( 22 ). To this end, two localization densities were calculated for each dataset relative to the nuclear area measured by (i) a diffraction-limited image, and (ii) binning localizations into boxes 20 nm on each side. Dividing the 120 nm slice thickness by this density value, and then taking the cube-root provided an estimate for the sampling frequency within a dataset. The mean ± σ value across all datasets was found to be 30 ± 2 nm/localization. Datasets utilized in DNA analysis (Figure 1C ) were required be 32 nm/localization or lower for both densities (i) and (ii). For H2B, thresholds were applied following cluster analysis of an H2B-PAINT dataset using the resulting cluster metrics to determine the quality of a dataset. The three cluster metrics used to select datasets were: (i) localization occupied nuclear area (Figure 2 ), (ii) clusters per island (Figure 2 ) and (iii) the nuclear area comprising clusters. This latter metric is a ratio of the area covered by clusters compared to the area covered by localizations, where datasets having low ratios were found to be visually sparser than datasets having a higher ratio. Because the TSA treatment led to H2B reorganization, separate thresholds had to be set for control vs. treated cells. For control Cells, PAINT datasets used for analysis of H2B clusters (Figure 3 and Supplementary Figure S3 ) were required to have: (i) occupancy > 35%, (ii) clustered area > 15%, (iii) clusters per island > 3; for TSA-treated cells they were required to have: (i) occupancy > 25%, (ii) clustered area > 10%, (iii) clusters per island > 1.5. Dataset selection appeared robust because no datasets were found to have only one or two of the metrics above/below the thresholds. Rather, datasets removed from analysis were found to have all three metrics below the respective thresholds in all cases, while datasets included in the analysis had all three metrics well above the thresholds. Figure 3. DNA co-localizes with H2B to a lesser extent in TSA-treated cells compared to untreated cells. ( A ) Cropped nuclear super-resolution image in human Fibroblasts of EdC-labeled DNA (cyan) and PAINT image of H2B labeled with anti-H2B antibodies (orange) and the overlay. A zoom of the region inside the yellow box is shown. ( B ) (left) A zoom of the region shown inside the yellow square, (right) scheme of the analysis of clutch-bound DNA. The centers of H2B clusters (stars) are the seeds for the Voronoi polygons (blue) inside which the DNA localizations (black dots) are distributed. Overlaid on top are concentric circles whose radii increase by 10 nm steps. ( C ) Percentage of DNA localizations associated to clutches in wild-type ( N = 4, green) and TSA-treated ( N = 5, magenta) fibroblasts for a circle of radius 120 nm bounded by Voronoi polygons ( P -value 0.0441). ( D ) Cumulative DNA density inside circles of increasing search radii in untreated (green) and TSA-treated (magenta) cells. The dots correspond to the mean, the bars correspond to the standard deviations: the lines connect sequential points and are guides to the eye. Datasets utilized in co-structure analysis of Figure 3 , Figure 4 and Supplementary Figure S4 were required to pass the selection criteria for both DNA and H2B. Figure 4. Nucleosome clutch associated DNA undergoes decompaction in TSA-treated cells: ( A ) DNA density in a bound circle of increasing size (30–100 nm) versus cluster (clutch) size measured as area in nm 2 . TSA treated clusters (magenta) have lower density than control clusters (green) independent of cluster size. The line corresponds to the mean of clusters; the bars correspond to the standard deviations. ( B ) Similarity matrix for untreated (left) and TSA-treated (right) cells showing the level of similarity in DNA density within 10 nm discs of increasing radii. The similarity was calculated as a P -value from Kruskalwallis test and is shown as a color coding corresponding to the color scale bar (from P = 0.0001 in blue to P = 0.05 in yellow). The diagonal was set to white and not calculated. Cyan and red lines show the boundary of a switch from low to high similarity in untreated and TSA treated cells, respectively. ( C ) Mean DNA density ± standard deviation as a function of clutch nearest neighbor distance (NND) for untreated (green) and TSA-treated (magenta) cells calculated for a circle of radius 70 nm. The bars show the standard deviation.
Co-localization analysis
To quantify the percentage of DNA localizations associated to nucleosome clutches, a clipped circle of 120 nm radius was drawn and the percentage of DNA localizations inside the disk over the total DNA localization in the polygon was calculated. From this analysis we also quantified the percentage of H2B clusters that have more than 5 DNA localizations inside the clipped disk of 120 nm radius (Figure 3D ). Co-localization analysis of Supplementary Figure S1D was performed using the ‘Coloc2’ plugin in Fiji. Briefly, cell nucleus obtained with both DAPI and EdC-A647 fluorophores were selected as ROIs. The 2D intensity histogram relation between the two signals was obtained and from it, the Pearson's R correlation was calculated.
Supplementary Material gkz593_Supplemental_File Click here for additional data file.
📊 Figures
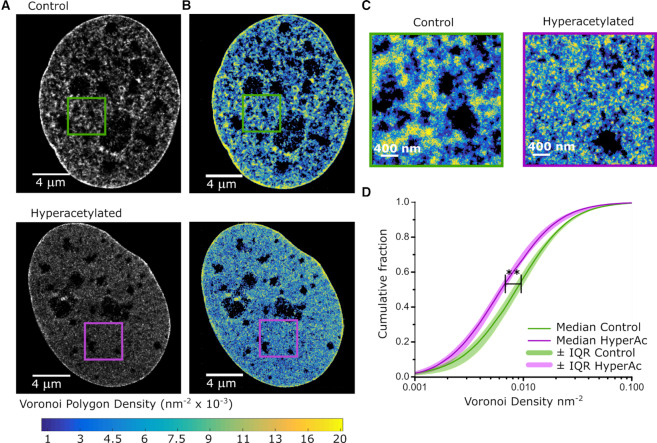
Figure 1.
EdC labeling enables super-resolution imaging of DNA structure. ( A ) Cropped nuclear super-resolution images of EdC labeled DNA in control (upper) and TSA-treated (lower) human BJ fibroblast cells re...
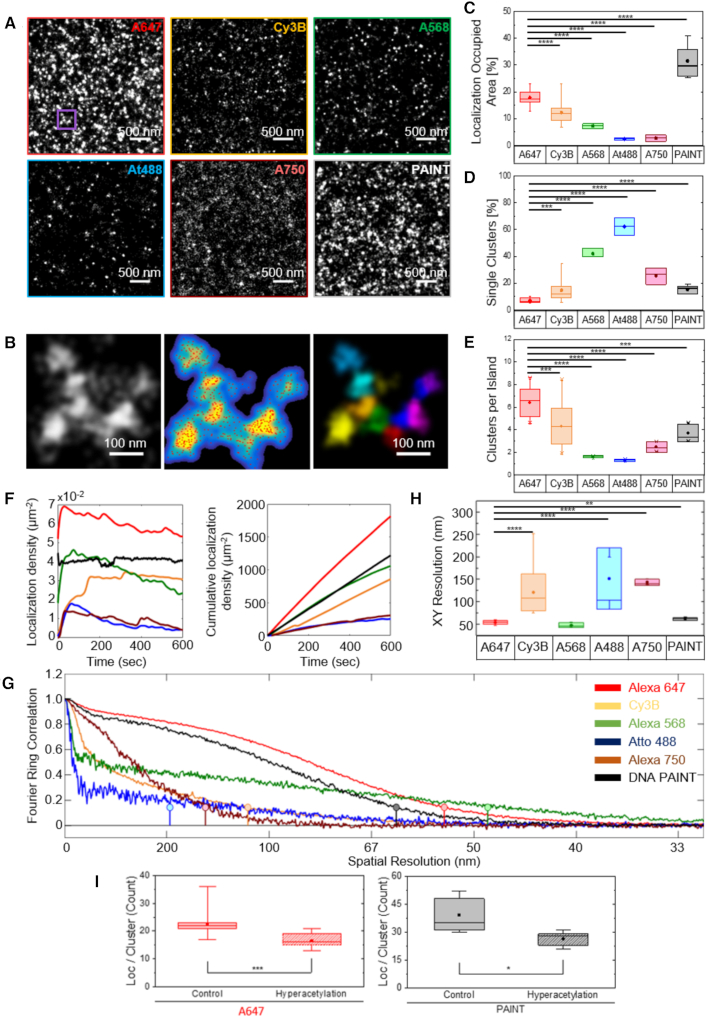
Figure 2.
2D super-resolution imaging of H2B with alternative super-resolution compatible dyes. ( A ) Representative 2D super-resolution images of the histone H2B obtained using fluorophores AlexaFluor647, Cy3B...
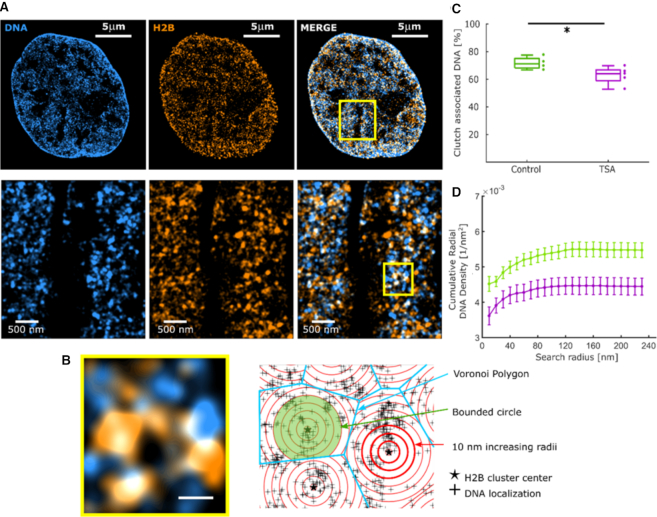
Figure 3.
DNA co-localizes with H2B to a lesser extent in TSA-treated cells compared to untreated cells. ( A ) Cropped nuclear super-resolution image in human Fibroblasts of EdC-labeled DNA (cyan) and PAINT ima...
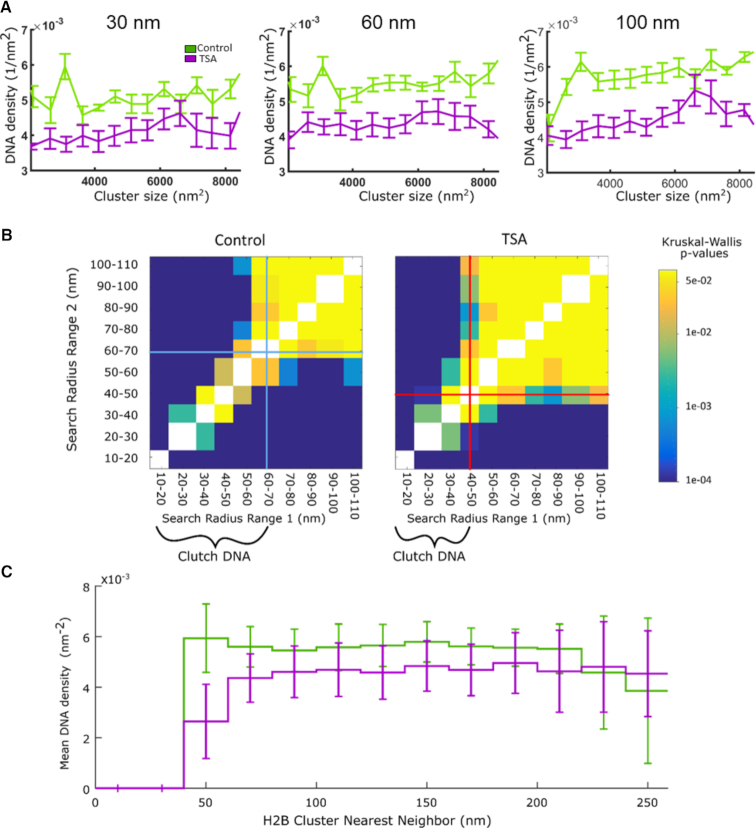
Figure 4.
Nucleosome clutch associated DNA undergoes decompaction in TSA-treated cells: ( A ) DNA density in a bound circle of increasing size (30u2013100 nm) versus cluster (clutch) size measured as area in nm...
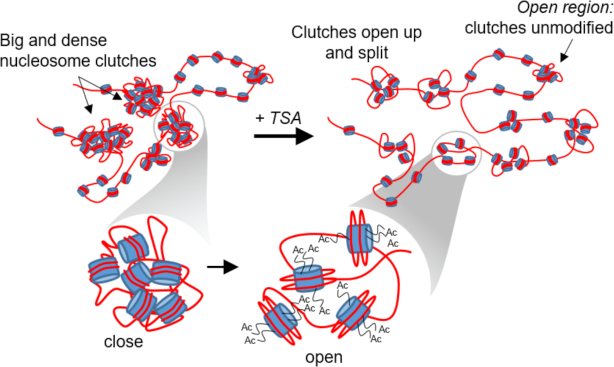
Figure 5.
Acetylation changes clutch size and the packing density of clutch DNA. Cartoon model of nucleosomal DNA decompaction upon hyperacetylation. Nucleosome clutches become smaller (see Figure 2I , Figure 3...
Figure images are served from the NIH/NLM PubMed Central Open Access Subset or Europe PMC; copyright remains with the publishers and authors.
💬 Discussion
0 commentsNo comments yet. Be the first to start a discussion!
Leave a Comment