Abstract
Experience results in long-lasting changes in dendritic spine size, yet how the molecular architecture of the synapse responds to plasticity remains poorly understood. Here a combined approach of multicolor stimulated emission depletion microscopy (STED) and confocal imaging in rat and mouse demonstrates that structural plasticity is linked to the addition of unitary synaptic nanomodules to spines. Spine synapses in vivo and in vitro contain discrete and aligned subdiffraction modules of pre- and postsynaptic proteins whose number scales linearly with spine size. Live-cell time-lapse super-resolution imaging reveals that NMDA receptor-dependent increases in spine size are accompanied both by enhanced mobility of pre- and postsynaptic modules that remain aligned with each other and by a coordinated increase in the number of nanomodules. These findings suggest a simplified model for experience-dependent structural plasticity relying on an unexpectedly modular nanomolecular architecture of synaptic proteins.
🔬 Techniques
🔭 Microscopes
💻 Software
✨ Fluorophores
🧪 Sample Preparation
🔬 Cell Lines
🏭 Microscope Brands
🧪 Reagent Suppliers
📷 Detectors
🎨 Filters
💻 Software Details
💾 Data Repositories
🏛️ Research Organizations (ROR)
Affiliated research institutions:
📋 Methods
Animals
All animal studies were approved by the Institutional Animal Care and Use Committee guidelines at Thomas Jefferson University in accordance with US National Institutes of Health guidelines. Mouse pups for lentiviral transduction experiments were obtained from timed pregnant CD-1 mice purchased from Charles River Laboratories Inc. (Wilmington, MA) and housed (3-5 mice per cage) in Thomas Jefferson University’s laboratory animal facility. Long-Evans E17-18 rat embryos from timed pregnant animals purchased from Charles River Laboratories Inc. (Wilmington, MA) were used to make primary cortical neuron cultures (see below).
Primary Cortical Neuron Culture preparation
Dissociated cortical neurons were prepared from embryonic day 17-18 (E17-18) rat cerebral cortex as described previously 37 , 51 , 52 and cultured in Neurobasal medium (Life Technologies, Carlsbad, CA) supplemented with B27 (Life Technologies), glutamine (Sigma, St. Louis, MO) and penicillin-streptomycin (Sigma). Neurons were plated on poly-D-lysine (BD Biosciences, San Jose, CA) and laminin (BD Biosciences) coated glass coverslips (12 mm, #1.5; Cat#: 64-0712, Warner Instruments, Camden, CT) or in glass bottom 35mm dishes made with #1.5 German optic cover glass (cat#: GBD00004-200, Cell E&G LLC, Houston, TX). Neurons were plated at 150,000/well in 24-well plates or at 180,000 neurons per 18 mm glass coverslip of a single 35 mm dish for transfection experiments and were maintained in a humidified 37°C incubator with 5% CO 2 .
Plasmids and Plasmid construction
The tdTomato expression construct used to visualize neuronal morphology was made using a neuronal specific human Synapsin-1 promoter (kind gift from Dr. Peter Scheiffele, University of Basel, Biozentrum) by replacing EGFP between the BamHI and MscI restriction sites with the tdTomato sequence 37 . For visualization of PSD-95-EGFP puncta and neuronal morphology with tdTomato in live-cell STED experiments we used GATEWAY technology (Invitrogen) to generate a plasmid that simultaneously expresses PSD-95-EGFP under control of the human ubiquitin promoter and tdTomato from the human Synapsin-1 promoter (pFUb_PSD-95/hSYN-1_tdTomato) 37 , 53 . Endogenous PSD-95 in live-cell STED experiments was visualized using EGFP labeled Fibronectin intrabodies generated with mRNA display (FingR) construct under the pCAGGS promoter element 34 . Synaptophysin-1 was tagged at the N-terminus with mTurqouise2. Briefly, HA-tagged Synaptophysin-1 cDNA ( NM_009305 ; kind gift from Dr. Peter Scheiffele, University of Basel, Biozentrum) was subcloned into the NotI/NheI sites of the pCAGGS vector 54 . The mTurquoise2 cDNA was then cloned in frame into the KpnI/XhoI sites just upstream of the HA site in the HA-Synaptophysin-1 pCAGGS vector to generate a fluorescently tagged molecule (pCAGGS_mTurq2-HA-SYP-1).
Show full methods section
Animals
All animal studies were approved by the Institutional Animal Care and Use Committee guidelines at Thomas Jefferson University in accordance with US National Institutes of Health guidelines. Mouse pups for lentiviral transduction experiments were obtained from timed pregnant CD-1 mice purchased from Charles River Laboratories Inc. (Wilmington, MA) and housed (3-5 mice per cage) in Thomas Jefferson University’s laboratory animal facility. Long-Evans E17-18 rat embryos from timed pregnant animals purchased from Charles River Laboratories Inc. (Wilmington, MA) were used to make primary cortical neuron cultures (see below).
Primary Cortical Neuron Culture preparation
Dissociated cortical neurons were prepared from embryonic day 17-18 (E17-18) rat cerebral cortex as described previously 37 , 51 , 52 and cultured in Neurobasal medium (Life Technologies, Carlsbad, CA) supplemented with B27 (Life Technologies), glutamine (Sigma, St. Louis, MO) and penicillin-streptomycin (Sigma). Neurons were plated on poly-D-lysine (BD Biosciences, San Jose, CA) and laminin (BD Biosciences) coated glass coverslips (12 mm, #1.5; Cat#: 64-0712, Warner Instruments, Camden, CT) or in glass bottom 35mm dishes made with #1.5 German optic cover glass (cat#: GBD00004-200, Cell E&G LLC, Houston, TX). Neurons were plated at 150,000/well in 24-well plates or at 180,000 neurons per 18 mm glass coverslip of a single 35 mm dish for transfection experiments and were maintained in a humidified 37°C incubator with 5% CO 2 .
Plasmids and Plasmid construction
The tdTomato expression construct used to visualize neuronal morphology was made using a neuronal specific human Synapsin-1 promoter (kind gift from Dr. Peter Scheiffele, University of Basel, Biozentrum) by replacing EGFP between the BamHI and MscI restriction sites with the tdTomato sequence 37 . For visualization of PSD-95-EGFP puncta and neuronal morphology with tdTomato in live-cell STED experiments we used GATEWAY technology (Invitrogen) to generate a plasmid that simultaneously expresses PSD-95-EGFP under control of the human ubiquitin promoter and tdTomato from the human Synapsin-1 promoter (pFUb_PSD-95/hSYN-1_tdTomato) 37 , 53 . Endogenous PSD-95 in live-cell STED experiments was visualized using EGFP labeled Fibronectin intrabodies generated with mRNA display (FingR) construct under the pCAGGS promoter element 34 . Synaptophysin-1 was tagged at the N-terminus with mTurqouise2. Briefly, HA-tagged Synaptophysin-1 cDNA ( NM_009305 ; kind gift from Dr. Peter Scheiffele, University of Basel, Biozentrum) was subcloned into the NotI/NheI sites of the pCAGGS vector 54 . The mTurquoise2 cDNA was then cloned in frame into the KpnI/XhoI sites just upstream of the HA site in the HA-Synaptophysin-1 pCAGGS vector to generate a fluorescently tagged molecule (pCAGGS_mTurq2-HA-SYP-1).
Neuronal transfection
To control for levels of protein expression, neurons were transfected at day in vitro 0 (DIV0) in suspension as previously described 51 using Lipofectamine 2000 (Life Technologies) and fluorescently tagged proteins were under control of mammalian promoters (described above). Briefly, immediately after dissociation of E17-18 rat cortices, cortical neurons were resuspended in OptiMEM (Life Technologies) at 500,000 neurons/mL. 1 mL of suspension was added to 1 mL of the Lipofectamine 2000 / DNA mixture and the transfection mix was incubated at 37°C for 45 minutes. Neurons were subsequently plated either in 24 well plates or in 35 mm dishes and left to adhere to coverslips for 1.5 hours after which they were washed once in cortical medium (Basal Medium Eagle, Life Technologies) supplemented with 10% heat inactivated fetal bovine serum (cat#: S11150H, Atlanta Biologicals, Flowery Branch, GA) and penicillin/streptomycin (Sigma). Neurons were then maintained in Neurobasal medium supplemented with B27 (Life Technologies) and 1% penicillin/streptomycin (Sigma) for 21-25 days at which point they were used for immunocytochemistry and STED or live-cell imaging experiments. 300,000 neurons were transfected with 300 ng of pENTR3-hSYN-1-tdTomato, 1 μg of pFU-PSD-95-EGFP/hSYN-1-tdTomato plasmid or 600 ng of pCAGGS-mTurq2-HA-SYP-1 plasmids. For visualizing endogenous PSD-95, neurons were transfected with 1 μg of the construct encoding EGFP FingR intrabody (pCAG_PSD-95.FingR-eGRP-CCR5TC was a gift from Don Arnold, Addgene plasmid # 46295) along with 300 ng of pENTR3-hSYN-1-tdTomato in suspension at DIV0. For live-cell STED simultaneous imaging of pre- and post-synaptic clusters, two groups of neurons were transfected separately either with pFU-PSD-95-EGFP/hSYN-1-tdTomato or pCAGGS-mTurq2-HA-SYP-1 plasmids for 45 minutes at 37°C after which they were combined in a 1:1 ratio when plating onto 35 mm glass bottom coverslips.
Immunocytochemistry
For immunocytochemistry, cultured cortical neurons were fixed between DIV21 and DIV25 in 4% paraformaldehyde (PFA)/2% sucrose in PBS for 8 minutes at room temperature. Fixed neurons were washed three times in PBS, then blocked and permeabilized for 2 hours at room temperature in 1% ovalbumin and 0.2% gelatin from cold-water fish in PBS containing 0.01% saponin. Neurons were then stained for 2 hours at room temperature or overnight at 4°C with the indicated primary antibodies, washed three times in PBS and then immunostained with corresponding secondary antibodies for 45 minutes at room temperature. After washing three times in PBS, coverslips were mounted with MOWIOL and used for confocal and STED imaging. Lentiviral transduction and immunohistochemistry The EGFP lentivirus used to label neuronal morphology in vivo was generated at Penn Vector Core (University of Pennsylvania, Philadelphia) using the pFUGW plasmid that expresses EGFP under control of the human ubiquitin promoter 53 . Postnatal day 7 (P7) CD-1 male and female pups were anesthetized with 5% isoflurane for 5 minutes and then maintained under 1-2% isoflurane anesthesia while performing bilateral stereotaxic injections of the EGFP lentivirus into somatosensory cortex of the brain (~30 minutes). Sparse labeling of cortical neurons was achieved by delivering 0.6 μl of the EGFP lentivirus (9.05 × 10 10 infective particles/mL) into each injection site. To allow for the efficient expression of EGFP, mice were sacrificed three to four weeks post-injection. At P28-35 mice were perfused trans-cardially with PBS followed by 4% PFA. Brains were post-fixed overnight in 4% PFA at 4˚C. After washing three times for 10 minutes in PBS brains were sectioned at 300 μm using a VT-1000S Vibratome (Leica). All subsequent steps were carried out with sections free floating. Sections were cleared using the CUBIC1/2 method 23 , 24 . Briefly, sections were incubated in CUBIC reagent-1 (25% urea (cat# U5378, Sigma), 25% N, N, N’, N’-tetrakis (2-hydroxypropyl) ethylenediamine (Sigma, cat#: 122262) and 0.2% Triton-X100) for three days at room temperature and washed with PBS. After CUBIC reagent-1 treatment, blocking was performed overnight at room temperature in a blocking solution of 10% fetal bovine serum (FBS, Atlanta biological), 1% bovine serum albumin (BSA, cat# 10857, Affymetrix, Cleveland, OH) and 0.2% Triton-X100 (cat# T9284, Sigma) diluted in PBS. Sections were incubated with primary antibodies diluted in blocking solution for three days at room temperature, washed three times for 10 minutes with PBS and stained with secondary antibodies diluted in blocking solution for three days at room temperature. The stained samples were then washed with PBS and immersed in CUBIC reagent-2 (50% sucrose (BP220-1, Fisher Scientific), 25% urea, 10% tri-ethanolamine (cat# T58300 , Sigma) and 0.1% Triton-X100) overnight at room temperature. The cleared sections were then mounted using CUBIC-2 reagent on slides, covered with #1.5 cover glass and used for STED imaging. For the experiments in non-cleared brain sections, fixed brains were sectioned at 50 μm. Prior to immunostaining, antigen retrieval was carried out by incubating sections in ddH 2 O for 5 minutes at 37˚C followed by 0.2N HCl containing 0.5 mg/ml pepsin protease for 10 minutes at 37˚C. Sections were then blocked overnight at 4˚C in 10% FBS, 1% BSA, and 0.2% Triton-X100 in 1× PBS, incubated overnight at 4˚C with primary antibodies, washed 3 times in PBS, incubated for 2 hours at room temperature with secondary antibodies, washed 3 times in PBS then mounted. Delivery of EGFP by lentivirus was used only to label neuronal morphology. No manipulation of protein expression was performed and, therefore, no randomization was done in animal studies.
Antibodies
All primary and secondary antibodies were profiled in our previous publications and were reported to be specific 37 , 51 , 52 , 55 . Primary antibodies: mouse monoclonal (IgG2A) anti-PSD-95 clone K28/43 (1:1000 (ICC) or 1:200 (IHC), Neuromab, UC Davis, Davis, CA), mouse monoclonal (IgG1) anti-Synaptophysin-1 (1:1000, cat # 101 111, Synaptic Systems, Gottingen, Germany), guinea pig polyclonal anti-vesicular glutamate transporter 1 (α-vGlut1; 1:5000 (ICC) or 1:2500 (IHC), Milipore, Temecula, CA, cat#: AB5905), guinea pig polyclonal anti-Bassoon (1:300, Synaptic Systems, Gottingen, Germany), rabbit anti-Bassoon (1:300, cat #: 141 003, Synaptic Systems), rabbit anti-RFP (1:500, Rockland, Limerick, PA, cat# 600-401-379), rabbit anti-GFP (1:500, Abcam, Cambridge, MA, cat# ab290). Secondary antibodies: Goat anti mouse IgG2A Atto 425 (1:250, Rockland, Inc., cat# 610-151-041), Goat anti-mouse IgG1 Atto-647N (1:500, cat # 610-156-040, Rockland, Inc.), Goat anti-rabbit Atto-647N (1:500, cat # 611-156-122, Rockland, Inc.), Donkey anti-guinea pig AlexaFluor-488 (1:500, Jackson ImmunoResearch, West Grove, PA, cat# 706-545-148), Donkey anti-rabbit Cy3 (1:500, Jackson ImmunoResearch, cat# 711-165-152), Donkey anti-rabbit AlexaFluor-488 (1:500, Jackson ImmunoResearch, cat# 711-545-152), Donkey anti-mouse AlexaFluor-594 (1:500, Jackson ImmunoResearch, cat# 715-585-150), Donkey anti guinea pig AlexaFluor-594 (1:500, Jackson ImmunoResearch, cat # 706-586-148), Donkey anti-guinea pig AlexaFluor-647 (1:500, Jackson ImmunoResearch, cat# 706-605-148). Chemical LTP NMDAR-dependent chemical LTP was induced by treatment of DIV21-25 cortical neurons transfected with tdTomato or pFUG-PSD-95-EGFP/hSYN-1-tdTomato and pCAGGS-mTurq2-HA-SYP-1 with 200 μM glycine as described 26 , 28 . Neurons were placed in artificial cerebrospinal fluid (ACSF, 143 mM NaCl, 5 mM KCl, 2 mM CaCl 2 , 1 mM MgCl 2 , 30 mM Glucose and 10 mM HEPES, pH 7.4) containing 0.5 μM TTX, 1 μM Strychnine and 20 μM Bicuculline. After 15-30 minutes of imaging, cultures of neurons were treated with 10 ml of glycine stimulating solution (143 mM NaCl, 5 mM KCl, 2 mM CaCl 2 , 0 mM MgCl 2 , 30 mM Glucose, 10 mM HEPES, pH 7.4, 0.5 μM TTX, 1 μM Strychnine, 20 μM Bicuculline and 200 μM Glycine) for 3-5 minutes, followed by 10 mL of 0 mM MgCl 2 containing ACSF. To block cLTP, 50 μM APV and 10 μM of MK-801 were included in the solutions described above. Imaging was then conducted for three hours to monitor long-term changes in spine morphology. Spines were classified as “enlarged” only if their area increased by at least 10% immediately following the application of glycine and remained increased (≥10% over baseline) for the entire imaging period.
Imaging – STED nanoscopy
Dual-color imaging of synaptic structures in fixed and immunostained cultured cortical neurons was conducted on a Leica TCS SP5 STED CW confocal microscope (Leica Microsystems, Mannheim, Germany) containing a 592 nm CW depletion line. Images of fixed neurons were acquired as single optical sections using a resonance scanner (8000 Hz scanning), HyD detectors (set between 100-200%) and 100× oil immersion objective (Leica) with 5-10× zoom to obtain 15-30 nm pixel size. The 442 nm and 488 nm lines were used to excite the Atto-425-labeled PSD-95 and the AlexaFluor-488-labeled vGlut1, respectively. The 592 nm depletion line (at 90-100% power) was used to reduce the point-spread function (PSF) for both fluorophores to ~80 nm. Images were deconvolved using the 80 nm PSF in Leica TCS SP5 software and analyzed in ImageJ (NIH, Bethesda, MD). For chemical LTP experiments, time-lapse live images were acquired using a confocal spinning disk system equipped with a Yokogawa CSU-10 and Hamamatsu EM-CCD digital camera attached to an inverted Leica microscope and controlled by Volocity software (Perkin Elmer). Optical sections spaced at 0.3 μm were used to acquire 1-2 μm image stacks of dendrites using a 100× oil immersion objective. Adaptive focus control (Leica) was used to minimize focus shifts during 3-hour image acquisition. After conclusion of live imaging neurons were immediately fixed, stained and subjected to STED imaging. Single optical sections of the same dendritic spines that were imaged live were next imaged with super-resolution (~80 nm) using Leica TCS SP5 STED CW as described above.
Live-cell STED chemical
LTP, in vivo experiments and three-color STED experiments of cultured cortical neurons were performed using a Leica TCS SP8 gated STED (GSTED) 3× super-resolution system (Leica Microsystems) equipped with a tunable white light laser, CW 592 nm and 660 nm depletion lines and a pulsed 775 nm depletion line. Live-cell STED images of PSD-95-EGFP and mTurquoise2-Synaptophysin-1 and confocal images of cell-filling tdTomato were acquired as stacks (~1μm) with a 100× oil immersion objective using a resonant scanner (8000 Hz) and gated HyD detectors (set at 150-250%). Both EGFP and mTurqoise2 have been shown to undergo effective STED in live-cell experiments 56 , 57 . Images were maintained in focus during 1-3 hours of imaging using Adaptive Focus Control (AFC, Leica). AFC was set to correct focal drifts at every timepoint and imaging position. For EGFP and mTurquoise2, the 592 nm CW line (at 25-35% power) was used to generate STED. For imaging of fixed brain sections, stacks of images at 100-150 nm intervals were acquired using a 100× oil immersion objective. Maximum XY resolution was adjusted for the individual images to ~ 25 nm/pixel. The 594 nm and 647 nm lines were used to excite the AlexaFluor-594-labeled PSD-95 and the AlexaFluor-647 labeled vGlut1, respectively. The pulsed 775 nm depletion laser was used to generate STED in XY (~70 - 80 nm FWHM) with 10% of the power redirected to the Z donut to generate Z resolution of ~200 nm. For three-color gated STED images of fixed cultured neurons imaged using Leica SP8 3× GSTED, PSD-95 was labeled with Atto-425, vGlut1 was labeled with Alexa-594 and Synaptophysin1 (SYP-1) or Bassoon were labeled with Atto-647N. Resonance scanning (8000 Hz), gated HyD detectors (set at 100-200%) and 100× oil immersion objective (Leica) with 5-10× zoom to obtain desired pixel size (15-25 nm) was used to acquire stacks at 150 nm image intervals. PSD-95 was excited with the 442 nm line (12-15% power) and the CW 592 nm line (60-65% power) was used to generate STED. Gated HyD detectors adjusted between 0.2/0.3 to 6 nanoseconds were used to acquire vGlut1 (excited with the 594 nm laser at 8-12% maximal power), and SYP-1 or Bassoon (excited with the 647 nm laser at 10-15% maximal laser power). The pulsed 775 nm depletion line (set at 10-15% of maximal laser power) was used to generate STED with a resolution of ~50 nm. For Z depletion, 10% of the 775 depletion line power was re-directed to the Z donut to achieve an image Z-resolved at ~250-300 nm.
Image processing and deconvolution Raw
STED images obtained using SP5 Leica CW STED were subjected either to (1) background subtraction (mean intensity of all pixels in the images) followed by a Gaussian blur (2 pixel size) or (2) deconvolution using SP5 Leica Application Suite Advance Fluorescence Software using 80 nm microscope resolution (determined using 40 nm yellow/green (505/515) beads, cat #: F8795, Thermo Fisher Scientific). Detailed methodology for each manipulation along with the FWHM are provided in figure S2 . Both approaches provided similar results ( Fig. 1 vs. Fig. S4 ). Raw STED images from sections of CUBIC and non-CUBIC processed brain tissue were processed with only background subtraction followed by 2 pixel Gaussian blur. Images collected using SP8 Leica GSTED from cultured neurons were deconvolved as stacks using Huygens deconvolution software by specifying the point spread function (PSF, Leica SP8/DM6000/100× objective, imaging wavelength), optical sectioning, X, Y and Z pixel resolution 21 . Deconvolution was performed separately for each channel using a maximum of 40 iterations. To validate our deconvolution approach, deconvolved images were compared to images processed with simple background subtraction and 2 pixel Gaussian blur ( Fig. S3 ). The deconvolution algorithm was further tested on extensively photobleached images to examine the effects of deconvolution at low signal-to-noise ratio. Comparison of sequentially bleached images and raw STED images validated our approach ( Fig. S3 ). Image analysis was conducted off-line using Image J.
Image analysis
Super-resolution analysis of PSD-95 and vGlut1 localization in dendritic spines was performed on a per spine basis. Images of spines, acquired at confocal resolution (~250-300 nm) were detected visually and Gaussian blur (2 pixel value) was applied to filter out noise. Individual spines were converted to binary masks by thresholding the resulting tdTomato image. Nanoclusters of labeled PSD-95 and vGlut1 (acquired in STED super-resolution) were identified by binarizing each channel separately using intensity thresholds. Thresholds were defined as the mean + 2 × S.D. of intensity values of a 500×500 image pixel area. Clusters were defined as minimum of 5 and maximum of 200 continuous pixels corresponding to an area of 0.03 – 0.3 μm 2 . For three-color STED using gated detectors, clusters were defined as a minimum of 10 and maximum of 100 continuous pixels corresponding to an area of 0.015 – 0.15 μm 2 . Separation between individual PSD-95 and vGlut1 clusters was identified from line intensity profiles of nearby clusters in each channel and was defined as the mean + 1.5 × S.D. of a local 50×50 pixel area that approximately corresponded to the average size of a spine head. The resulting thresholded nanomodules were used to determine whether these modules colocalized with individual spines. ROIs of each thresholded spine head were used to manually assign the PSD-95 and vGlut1 puncta to spines. PSD-95 clusters were assigned to a spine if the thresholded pixel areas were entirely within the spine head ROI. vGlut1 clusters were assigned to a spine if the thresholded pixel areas either completely or partially overlapped with the spine head ROI. Based on the size of the synaptic cleft and antibody chains, colocalization was defined as puncta that were separated by no more that 150 nm ( Figure 1b ). Only spines with clearly identifiable PSD-95 or vGlut1 clusters were included in the analysis. For analysis of PSD-95 and vGlut1 clusters in vivo , outlines of spines were determined in individual z sections of thresholded images. The spine outlines were then overlaid onto the thresholded images of the channels corresponding to PSD-95 and vGlut1 clusters. From these assignments, spine co-localization of each cluster was made independently for each z section. Orthogonal views of the overlaid image stacks were used to verify that individual clusters co-localized with individual spines in the z plane. Finally, image stacks were overlaid and filtered by an edge-preserving algorithm in Imaris software (Bitplane AG). High-contrast images of puncta within the area that corresponded to the size of the spine head and shaft (approximately 100×100 pixels) were projected in Imaris to generate high-contrast volume rendered images. Volume rendering was performed for each channel separately using a two-voxel separation between thresholded objects. Thresholded clusters that did not colocalize with the area of the spine were discarded. Similar to the in vitro cluster analysis, the PSD-95 and vGlut1 channels were binarized separately using intensity thresholds (mean + 2 × S.D. of intensity values within an area of 400×400 pixels). Cluster separation was determined as described above for the in vitro cluster analysis. Due to tissue expansion following the CUBIC treatment 58 the separation between aligned pre- and post-synaptic clusters was accepted to be between 100-200 nm by measuring the intensity peaks of aligned clusters. Data for both in vitro and in vivo spine analysis of module number represent observations and were acquired and analyzed without an experimenter blinding. For the live-cell cLTP and retrospective STED analysis, an experimenter was blinded to the condition and the effect of spine size change by first identifying the cluster numbers and then revealing the change in spine morphology for a given condition. Analysis of live-cell STED The 4D (x, y, z, t) deconvolved image stacks acquired from the live-cell STED experiments were aligned using ImageJ macros (Stack reg and Turbo reg) using a rigid body transformation based on the morphology of neuronal dendrites and then were analyzed as maximum intensity projections. Dendritic spines were visualized by applying a Gaussian blur (2 pixel value) to the maximum projections of the tdTomato channel. The presence of PSD-95-EGFP and mTurquoise2-Synaptophysin-1 clusters was assessed for each channel separately in each spine. To identify individual clusters, intensity thresholds were generated using the mean + 2 × S.D. of a local 50×50 pixel area corresponding to the average size of a spine head. The appearance of new clusters was determined visually from time-lapse image series by using the manual tracking algorithm in ImageJ. The identity of new clusters was confirmed from intensity plots by measuring the line profile intensity. New clusters were defined when there was >20% difference between peak intensities of individual clusters and the trough between the peaks of the clusters. The alignment of pre- and post-synaptic nanomodules in live-cell STED experiments was quantified using two metrics based on two-dimensional projections of the images ( Fig. 6i ). First, the deviation (ө x ) from perfect alignment (a 90-degree angle, ө x = ө i - 90°) between the centers of PSD-95-EGFP and SYP-mTurq2 modules measured along the long axis of the SYP-mTurq2 centroid was calculated at each time point and summed. This measure reflects the relative apposition of the two modules. Second, the distance (d x ) between the centers of PSD-95-EGFP and SYP-mTurq2 centroids was calculated for each time point. The average angular deviation and centroid distance during the three-hour imaging period were then calculated for each condition. Centroids for SYP-mTurq2 and PSD-95-EGFP were generated using the DrawElipse plugin in ImageJ software ( https://imagej.nih.gov/ij/macros/DrawEllipse.txt ) by manually tracing each nanomodule at each timepoint.
Monte Carlo simulations
The super-resolved images of PSD-95 and vGlut1 from in vitro and in vivo experiments were thresholded as described above. For in vitro data, thresholded masks for each channel were generated using maximum projection images of the entire z-stack (≤ 1μm). Thresholded images for brain sections were generated from a substack corresponding to the average thickness of a spine (~1 μm). Using thresholded masks, we modeled the probability of overlap between randomly positioned spines of varying areas and actual PSD-95, vGlut1, SYP-1 and Bassoon nanomodule images ( Fig. S6, S7 and S9 ). Spine positions were randomized using the random number generator macro in ImageJ. Clusters were assigned as belonging to simulated spines using the same criteria that were used to manually assign post-synaptic and pre-synaptic nanomodules in our data set – PSD-95 was included only when puncta were entirely within the simulated spine area and pre-synaptic nanomodules were included only when puncta were within or touching the simulated spine ( Fig. S6c ). Simulations were conducted with a variety of sizes of simulated spines reflecting the variation in spine size observed in our data set ( Fig. S6, S7 and S9 ). Spine area was approximated by a circular area calculated from the average diameter of spines in our raw data set. Monte Carlo simulations were then performed on three randomly selected images from independent experiments. For each channel, simulated spines of a specific size were placed at 500 randomly selected locations overlaid onto each raw image selected using an ImageJ macro. Simulations were conducted in three independent runs for the total of 1500 simulations per spine size. Only simulated spines placed randomly at locations that contacted puncta of synaptic marker proteins were included for further analysis.
Statistical analysis
Data were acquired and analyzed based on the standards in the field, however, no method of randomization was used to determine how samples were allocated to experimental groups and processed. Data are expressed as means ± SEM. All data points collected were included for analysis. Statistical significance of the differences among groups were determined by one-way analysis of variance followed by post-hoc tests as described in individual figure legends, or by two-tailed Student’s t -test when testing differences between two conditions. Kruskal-Wallis test was used to test differences between cumulative probability distributions as well as the differences between FRAP recovery distributions. P values less than 0.05 were considered statistically significant. For p values less than 0.0001 we are providing a range and not the exact number. See supplementary table 1 for statistical detail. Distribution of the data was assumed to be normal, but this was not formally tested. No statistical methods were used to predetermine sample sizes, but the sample sizes are similar to those reported in previous publications 37 , 51 , 52 , 55 . Group differences in variance were tested for each data set and determined to be similar. Unless stated otherwise, statistical tests were conducted on a per spine basis, from cortical neurons collected from a minimum of three independent transfection experiments/animals ( Supplementary Table 1 ).
Supplementary Material 1
📊 Figures
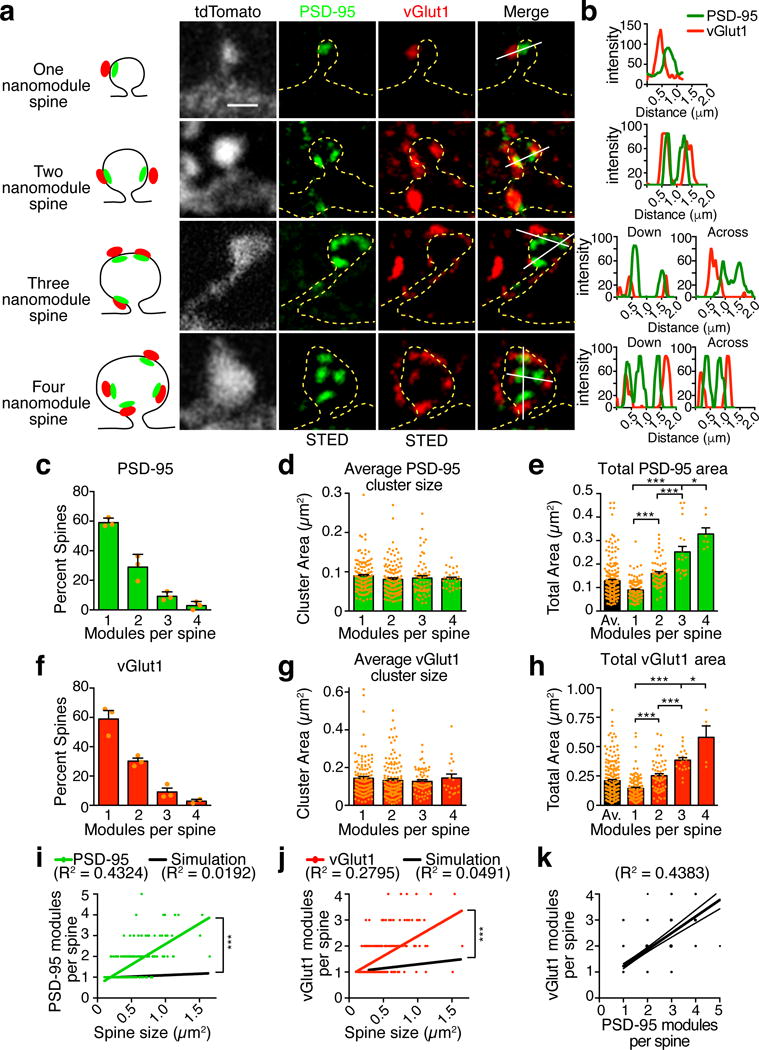
Fig. 1
Modular organization of dendritic spine synapses in vitro
( a ) Representative high-contrast images of PSD-95 (green) and vGlut1 (red) modules imaged with STED (~80 nm FWHM) in dendritic spines imaged simultaneously in confocal mode (~300 nm FWHM, gray and d...
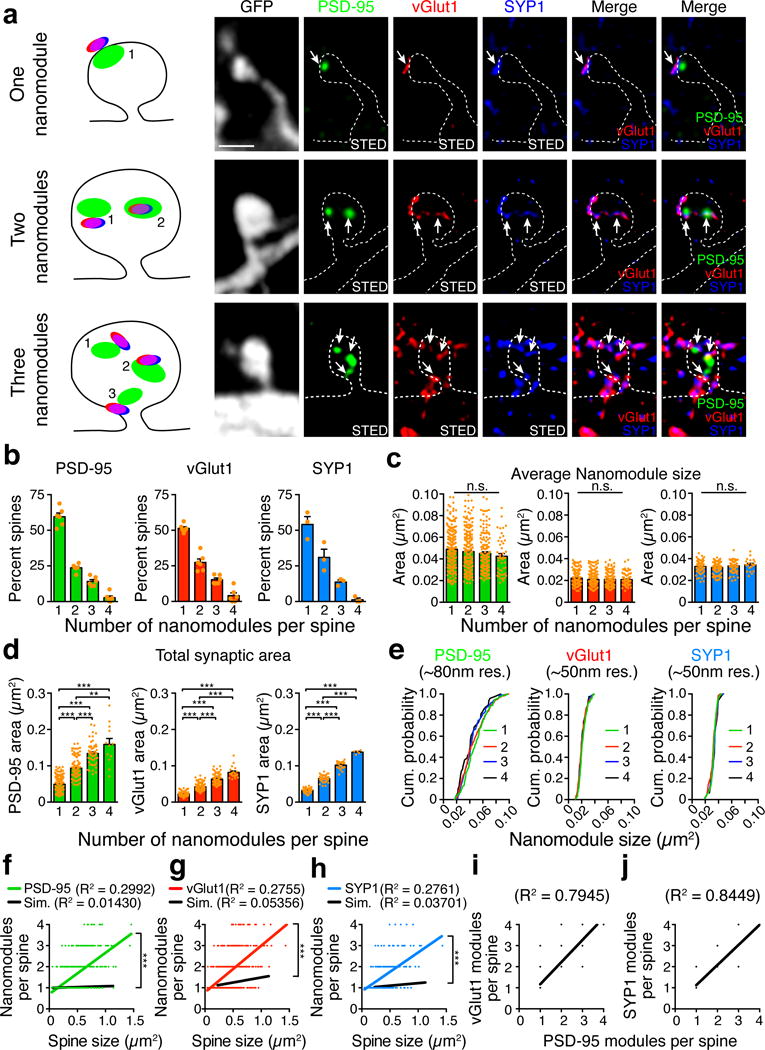
Fig. 2
Synaptic vesicle proteins exhibit modular organization at synapses
(a) Representative high-contrast three-color STED images of PSD-95 nanomodules (green, CW STED, FWHM ~80 nm), vGlut1 (red) and Synaptophysin-1 (SYP-1, blue) nanomodules imaged using gated STED (FWHM ~...
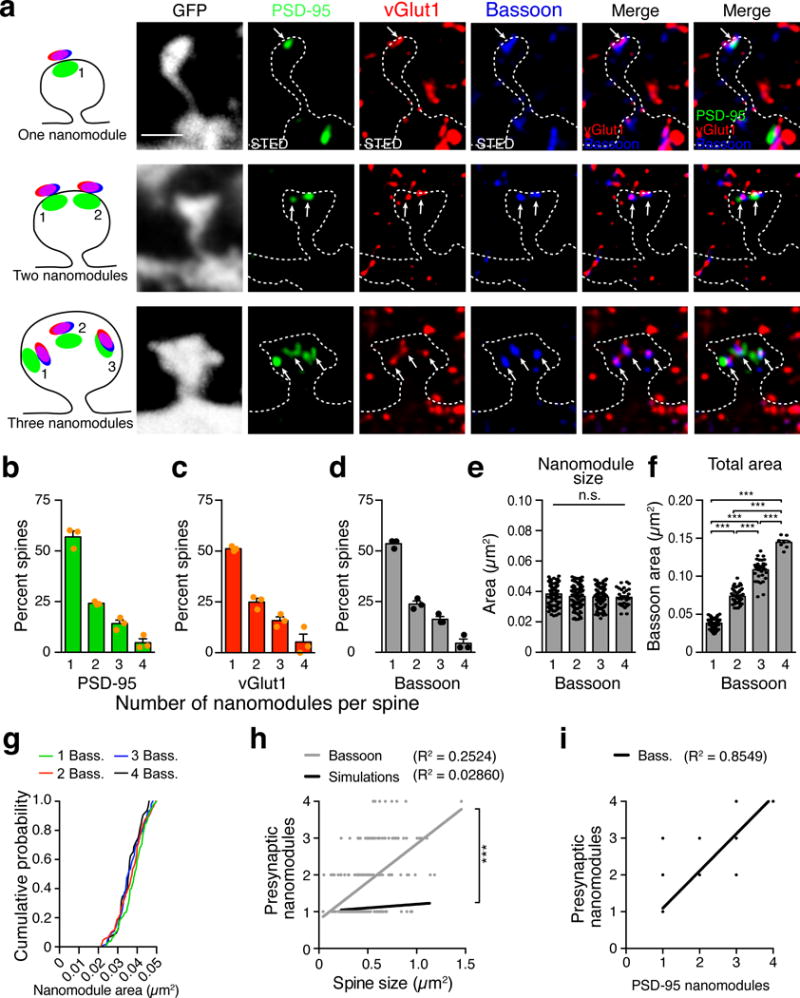
Fig. 3
Synaptic vesicle and active zone markers colocalize at spines as synaptic nanomodules
(a) Representative high-contrast three-color STED images of PSD-95 nanomodules (green, CW STED, FWHM ~80 nm), vGlut1 (red) and Bassoon (blue) nanomodules imaged using gated STED (FWHM ~50 nm) in EGFP-...
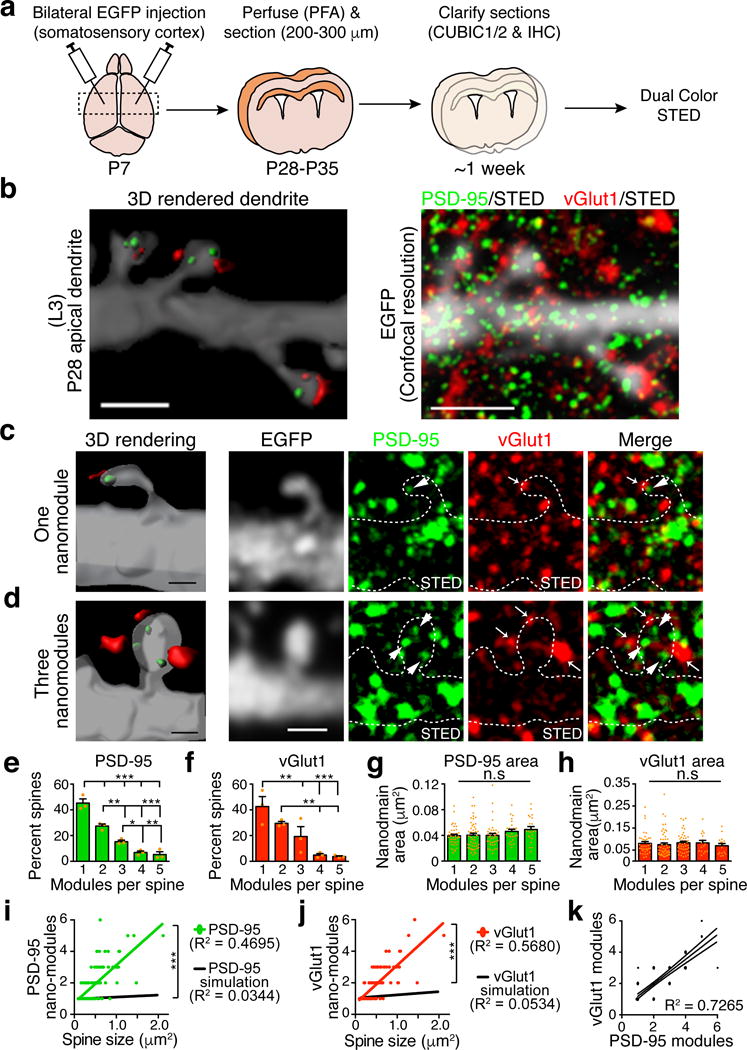
Fig. 4
Modular organization of dendritic spine synapses in vivo
(a) Schematic representation of the experiment. ( b ) 3D Imaris reconstruction (left panel) of the dendritic section, spines and corresponding synaptic modules of a layer 3 neuron shown on the right. ...
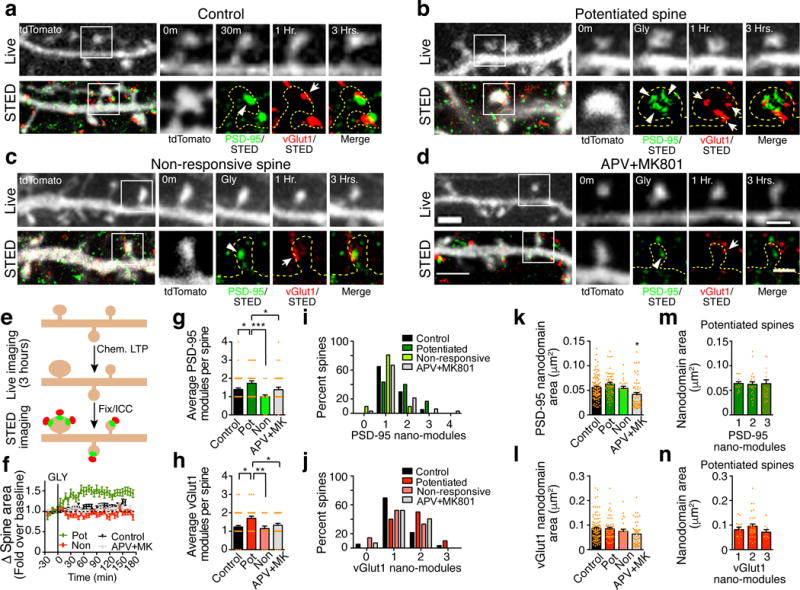
Fig. 5
Structural plasticity associated with cLTP is linked to synaptic module number
( a-d ) Representative three-hour time-lapse images (top panels, confocal resolution) and retrospective high-contrast STED images (bottom panels) of the same dendritic spines (white squares) of tdToma...
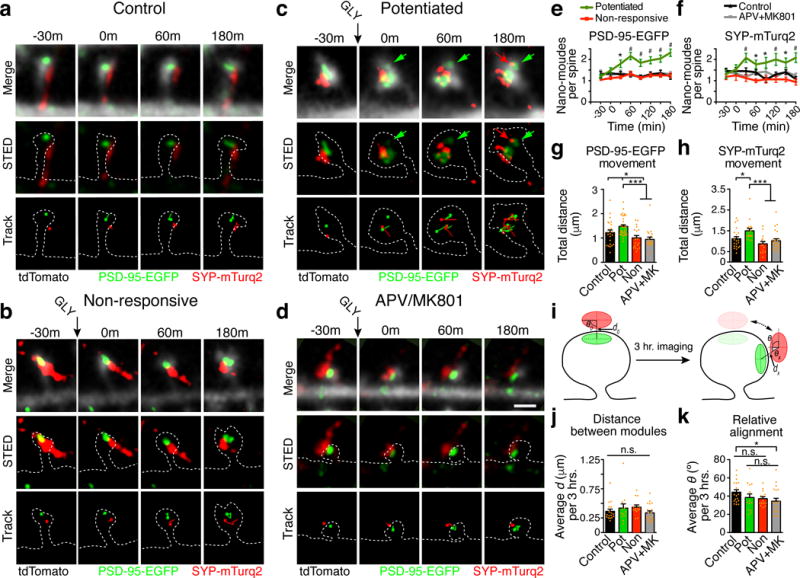
Fig. 6
Rapid remodeling of aligned pre- and post-synaptic modules underlies cLTP structural plasticity
( a-d ) Representative images of time-lapse dual-color live-cell STED of PSD-95-EGFP (green) and mTurquoise-2-Synaptophysin-1 (SYP-mTurq2, red). Gray shows cell morphology with cell-filling tdTomato i...
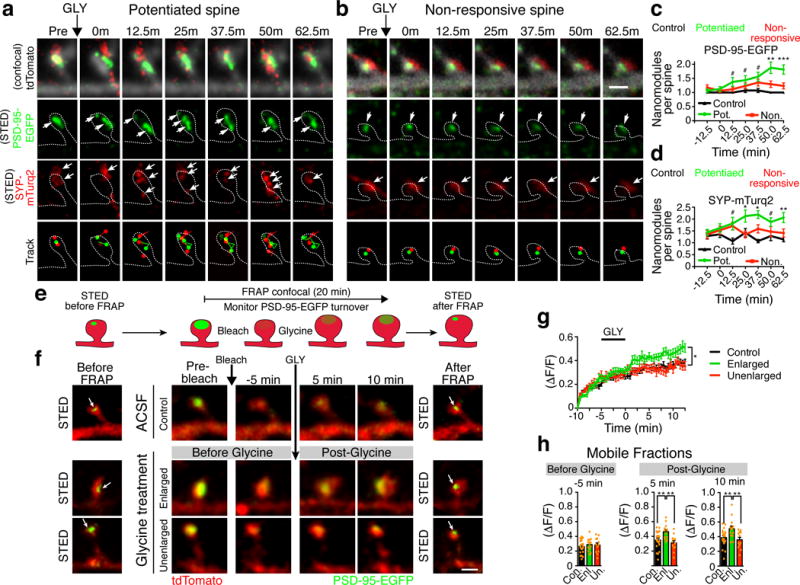
Fig. 7
NMDAR-dependent plasticity is associated with fast modification of synaptic nano-architecture
(a-b) Representative images of time-lapse dual-color live-cell STED of DIV21-25 neurons transfected with PSD-95-EGFP (green) and mTurquoise-2-Synaptophysin-1 (SYP-mTurq2, red). Gray shows cell morphol...
Figure images are served from the NIH/NLM PubMed Central Open Access Subset or Europe PMC; copyright remains with the publishers and authors.
💬 Discussion
0 commentsNo comments yet. Be the first to start a discussion!
Leave a Comment