Abstract
BACKGROUND: Filoviruses, including Ebola virus, are unusual in being filamentous animal viruses. Structural data on the arrangement, stoichiometry and organisation of the component molecules of filoviruses has until now been lacking, partially due to the need to work under level 4 biological containment. The present study provides unique insights into the structure of this deadly pathogen. METHODOLOGY AND PRINCIPAL FINDINGS: We have investigated the structure of Ebola virus using a combination of cryo-electron microscopy, cryo-electron tomography, sub-tomogram averaging, and single particle image processing. Here we report the three-dimensional structure and architecture of Ebola virus and establish that multiple copies of the RNA genome can be packaged to produce polyploid virus particles, through an extreme degree of length polymorphism. We show that the helical Ebola virus inner nucleocapsid containing RNA and nucleoprotein is stabilized by an outer layer of VP24-VP35 bridges. Elucidation of the structure of the membrane-associated glycoprotein in its native state indicates that the putative receptor-binding site is occluded within the molecule, while a major neutralizing epitope is exposed on its surface proximal to the viral envelope. The matrix protein VP40 forms a regular lattice within the envelope, although its contacts with the nucleocapsid are irregular. CONCLUSIONS: The results of this study demonstrate a modular organization in Ebola virus that accommodates a well-ordered, symmetrical nucleocapsid within a flexible, tubular membrane envelope.
🔬 Techniques
🔭 Microscopes
💻 Software
🧪 Sample Preparation
🔬 Cell Lines
🏭 Microscope Brands
📷 Detectors
💻 Software Details
💾 Data Repositories
🏛️ Research Organizations (ROR)
Affiliated research institutions:
📋 Methods
Methodology and Principal Findings We have investigated the structure of Ebola virus using a combination of cryo-electron microscopy, cryo-electron tomography, sub-tomogram averaging, and single particle image processing. Here we report the three-dimensional structure and architecture of Ebola virus and establish that multiple copies of the RNA genome can be packaged to produce polyploid virus particles, through an extreme degree of length polymorphism. We show that the helical Ebola virus inner nucleocapsid containing RNA and nucleoprotein is stabilized by an outer layer of VP24-VP35 bridges. Elucidation of the structure of the membrane-associated glycoprotein in its native state indicates that the putative receptor-binding site is occluded within the molecule, while a major neutralizing epitope is exposed on its surface proximal to the viral envelope. The matrix protein VP40 forms a regular lattice within the envelope, although its contacts with the nucleocapsid are irregular.
Materials and Methods
Cells and viruses Zaire Ebolavirus was propagated in Vero E6 cells and purified as previously described [50] . Ebola enriched samples were checked by SDS-Page and Western blotting, and rendered non-infectious by fixation with 4% paraformaldehyde. Excess fixative was removed by placing the fixed samples in a Slide-A-Lyzer G2 cassette with a 0.5 ml capacity, and a 10,000 MWCO (Thermo Scientific Pierce Protein Research Products, Rockford, Illinois, USA), followed by dialysis against PBS. Virus-like particles were produced as previously described [51] . All work with infectious Ebola virus (virus culture and purification) was performed in the biosafety level 4 laboratories at the National Microbiology Laboratory of the Public Health Agency of Canada, Winnipeg, Manitoba.
Show full methods section
Methodology and Principal Findings We have investigated the structure of Ebola virus using a combination of cryo-electron microscopy, cryo-electron tomography, sub-tomogram averaging, and single particle image processing. Here we report the three-dimensional structure and architecture of Ebola virus and establish that multiple copies of the RNA genome can be packaged to produce polyploid virus particles, through an extreme degree of length polymorphism. We show that the helical Ebola virus inner nucleocapsid containing RNA and nucleoprotein is stabilized by an outer layer of VP24-VP35 bridges. Elucidation of the structure of the membrane-associated glycoprotein in its native state indicates that the putative receptor-binding site is occluded within the molecule, while a major neutralizing epitope is exposed on its surface proximal to the viral envelope. The matrix protein VP40 forms a regular lattice within the envelope, although its contacts with the nucleocapsid are irregular.
Materials and Methods
Cells and viruses Zaire Ebolavirus was propagated in Vero E6 cells and purified as previously described [50] . Ebola enriched samples were checked by SDS-Page and Western blotting, and rendered non-infectious by fixation with 4% paraformaldehyde. Excess fixative was removed by placing the fixed samples in a Slide-A-Lyzer G2 cassette with a 0.5 ml capacity, and a 10,000 MWCO (Thermo Scientific Pierce Protein Research Products, Rockford, Illinois, USA), followed by dialysis against PBS. Virus-like particles were produced as previously described [51] . All work with infectious Ebola virus (virus culture and purification) was performed in the biosafety level 4 laboratories at the National Microbiology Laboratory of the Public Health Agency of Canada, Winnipeg, Manitoba.
Cryo-electron microscopy
Samples for cryo-electron microscopy (cryo-EM), and cryo-electron tomography (cryo-ET) were mixed with BSA coated 10 nm gold particles (Aurion Immuno Gold Reagents & Accessories, Wageningen, The Netherlands) at a ratio of 2∶1 (virus∶gold) for cryo-ET, and (9∶1) for cryo-EM. Specimens (4 µl) were then applied to glow-discharged quantifoil grids with 2 µm holes spaced at 1 µm intervals (Quantifoil MicroTools GmbH, Jena, Germany). Grids were subsequently plunge cooled in liquid ethane using a Vitrobot Mark IV (FEI Company, Hillsboro, Oregon, USA). Specimens were transferred to a Tecnai 20 G2 transmission electron microscope (FEI) operated at 200 kV, equipped with a Gatan CT3500TR single tilt rotation low-temperature specimen holder. For cryo-EM imaging was conducted at temperatures of ∼−185°C. Images were recorded using an Eagle 4K CCD camera (FEI Company, Hillsboro, Oregon, USA). For single particle image analysis, images were taken at 50,000× or 80,000× magnification at 2–4 µm defocus, with a dose of 10 electrons/Å 2 . This corresponded to a pixel size at the CCD detector of 2.147 Å/pixel and 1.353 Å/pixel, respectively. For virus length measurements low magnification cryo-EM images were taken at 5,000×, 3,500× and 2,500×. For cryo-ET single axis tomograms were taken at 25,000×, 29,000× or 50,000× magnification, at −8 µ or −6 µ defocus, with angle steps of 2°−4°. Data were collected within tilt ranges of ±60°, or ±52°, with a total dose/tomographic data set of 47–60 electrons/Å 2 . For cryo-EM, data collection was done using the low-dose unit and software coupled with the TEM Imaging & Analysis (TIA) software (FEI Company, Hillsboro, Oregon, USA). Automated eucentricity determination, and focusing were performed using the Xplore3D data acquisition software (FEI Company, Hillsboro, Oregon, USA). For cryo-ET, data collection was done using the Xplore3D data acquisition software, the low-dose unit, and the TIA software (FEI Company, Hillsboro, Oregon, USA). Image processing: virus length measurements The exact magnification in the microscope at the CCD detector was determined using a calibration grid (Pelco International, Redding, CA). Ebola virus length measurements (n = 2090) were made using the Image J software package [52] using the free hand line tool, and the analyse/measure function. For this analysis only viruses containing a continuous nucleocapsid were measured. Viruses with linked nucleocapsids and empty viruses were omitted. The measurements that were made in image J were then collated, analysed, and plotted, using Microsoft Excel. Tomography: image processing Tomographic image analysis of cryo-ET data was carried out with the Inspect3D Xpress software package (FEI Company, Hillsboro, Oregon, USA). The tomographic images were aligned to each other by a two-step process. The first step involved alignment of adjacent images by cross correlation. This process was repeated several times until the shift between adjacent images was below one pixel in either the X or Y plane. The second step involved the alignment of the entire image stack using 10 nm colloidal gold particles as fiducial markers. In this instance the term “image stack” refers to all the images collected in a single tomographic tilt. This procedure involves the selection of ten to twenty of the 10 nm gold particles and the subsequent identification and tracking of these particles in all of the images in the image stack. The locations of these particles are then used in conjecture with the tilt angles of each image to globally align all of the images to each other. The last step in this process was to calculate the three dimensional reconstruction of the tomogram from the aligned images. In this study we used the simultaneous iterative reconstruction technique (SIRT) algorithm with 10 iterations to calculate the final three-dimensional reconstruction (tomogram).
Sub-tomogram analysis
Sub-tomogram image analysis of cryo-ET data was carried out with the Automated Recognition of Geometries, Objects, and Segmentations (ARGOS) software package (FEI Company, Hillsboro, Oregon, USA). For this analysis an 80 3 pixel sub-tomogram was extracted from a tomogram using the Chimera [53] software package. In this analysis the tomogram used contained a linear region of the Ebola virus ( Figure S4 ), and the 80 3 pixel sub-tomogram contained a single linear segment. This template was then used by the ARGOS software to conduct an exhaustive search of the original tomogram for similar structures. This analysis involved a six dimensional search matrix (three positional variants, and three rotational variants). The entire search process was sped up by the ARGOS software by utilizing parallel processing on the computer's graphics processing unit (GPU). Once individual sub-tomograms were selected based on correlation, they were inspected and compared to the initial template sub-tomogram. The extracted and aligned sub-tomograms were subsequently averaged with a filter that minimized the missing wedge artifact. This average structure then was used as the reference and the entire procedure was repeated several times. Single particle image analysis: software and hardware Single particle cryo-EM image processing was carried out using the EMAN/EMAN2 and SPIDER/WEB image processing program packages [54] , [55] . Particle selection (EMAN) and contrast transfer function correction (EMAN2) were conducted on an Apple Inc. Mac Pro computer (12-core, Intel Xeon Nehalem processors 2.93 GHz, 32 GB Ram, Mac OS X 10.6.7). All subsequent calculations were performed on a Dell PowerEdge R900 4-way 64-bit Xeon X7460 processors, Six Core 2.67 GHz CPUs with 256 GB Ram running Linux (CentOS 5.2). Images were corrected for contrast transfer function (ctf) using the “e2ctf.py” function in the EMAN2 software package 5 , which estimates defocus and corrects for ctf by phase-flipping. Images of the spike (n = 8084 side perspective; n = 234 end-on perspective) and nucleocapsid (n = 34,605) were selected for image analysis. The resolution of the cryo-EM reconstruction was estimated by Fourier shell correlation using the FSC 0.5 criteria. In all subsequent sections image analysis procedures were conducted using the SPIDER software package unless otherwise stated. Single particle image analysis: nucleocapsid analysis Analysis of initial images of the “straight” linear segments of the Ebola virus using Fourier transformation indicated that there was sufficient bending of the helical nucleocapsid to make standard helical analysis problematic. Therefore, an initial reference free single particle 2D analysis was conducted in EMAN using the “startnrclasses” program to identify any potentially recurring motifs within linear regions of the Ebola virus. In order to further investigate the nucleocapsid repeat identified in the 2D analysis the iterative helical real space reconstruction method (IHRSR) was implemented [26] , [27] . This procedure requires an initial 3D helical reference structure which is used for image alignment. In this investigation a linear region of the Ebola virus which was extracted from a tomogram was used to generate this helical reference structure. This initial 3D structure was first pre-treated with a Gaussian mask to select only the nucleocapsid-containing region of the virus tomogram. An auto correlation function was then performed in which the volume was rotated around the helical axis, and translated along the axis of the nucleocapsid. At each rotational and translational position and autocorrelation value was calculated (between the shifted and un-shifted volume). The net result of this process was the determination of the helical symmetry present in the tomogram. In order to analyse the data generated by this procedure the Microsoft excel spread sheet program was used. The correlation plots generated by this process solved the handedness, pitch, and number of repeats per turn for the nucleocapsid. These symmetry parameters were then applied to the tomogram to generate the initial 3D model. The IHRSR method was then applied to the 34,605 single particle images of the nucleocapsid as previously described [26] , [27] . Single particle image analysis: spike analysis For the spike dataset two image populations were combined composed of side, and end-on perspectives. For the side view perspective images were subfield directly off of the Ebola virus cryo-EM images. For the end-on perspectives sub-tomographic volumes were extracted from the tomographic reconstructions of the Ebola VLP. The 3D volumes were then added in the “Z” plane to generate 2D projection averages which were then used for the subsequent single particle image analysis. The data were the processed using EMAN to generate an initial 3D reconstruction, which was then refined in SPIDER using the projection matching technique as previously described [44] , [56] . The docking of the 3CSY.pdb [42] structure to the cryo-EM structure of the spike was accomplished using the SITUS [57] software package with the exception that only the GP1 and GP2 components of the 3CSY structure were used for the docking process. The “floodfill” program in SITUS was used to segment the spike component of the 3D cryo-EM reconstruction from the envelope component of the reconstruction. The segmented volume was then used for the docking procedure using the ‘colores’ function in SITUS. Once docked the entire 3CSY.pdb structure which included the Fab of the KZ52 neutralizing antibody was superposed over the docked GP1/GP2 component of the structure. Structure visualisation The 3D cryo-EM reconstructions, cryo-ET reconstructions, 3D models of the Ebola virus, and the atomic resolution structure 3CSY.pdb were visualized using UCSF Chimera software package (Computer Graphics Laboratory, University of California, San Francisco, supported by NIH P41 RR-01081) [53] . The 3D images and movies presented in this manuscript were generated directly by UCSF Chimera software package.
Supporting Information Figure S1 High magnification images showing linear regions of Ebola virus. The diameter of EBOV is constant in linear regions of the virus containing a nucleocapsid (A). The viral filaments are not perfectly straight, and are often curved, complicating helical image processing. Glycoprotein spikes (GP), envelope (E), and nucleocapsid (NC) are all clearly visible. The black spherical objects (shown by black arrows) are 10 nm colloidal gold particles which are used for automated focusing and tomography alignment. (B) Images of “comma-shaped” Ebola virus. Each of the comma-shaped viruses has a single copy of the genome which can be seen running through the center of the virus and curving at one end of the virus to form the globular head. In some of the heads there is a low-density region (LD) devoid of nucleocapsid. In others, the nucleocapsid is sharply bent where it folds back on itself and looks like a check mark (right panel). (C) Ebola virus structures with and without nucleocapsid. Empty tubular filaments (E), and viral filaments containing a nucleocapsid (NC) are shown. Constrictions at the transition points where the nucleocapsid ends and the viral membrane continues as an empty tubular structure are indicated by red arrow heads. The diameters are as follows: nucleocapsid, 41 nm; virus with nucleocapsid, 96–98 nm; empty filaments, 48–52 nm. (D) Ebola virus with interior vesicles. Viral particles containing additional membrane vesicles within the envelope are shown by a green “V”. Although present in a minority of virus particles, when present they are usually at the ends of the virus with a globular head. The image in the left hand column shows an example where the vesicles are in the middle of the virus. (TIF) Click here for additional data file. Figure S2 Tomographic slices of Ebola virus. Slices in “Z” of Ebola virus tomogram reveal the components of the virus and nucleocapsid (A). The insets show 2D averages of the nucleocapsid. The slice through the top of the virus reveals the envelope and glycoprotein spikes. The next slice cuts through the top of the nucleocapsid (NC) revealing the banding pattern which represents VP24–VP35 bridge. The third slice cuts through the middle of the NC. The tube-like component of the NC is primarily composed of NP. The last panel shows the average of 53 slices which make up the volume encompassing the entire NC. The image and the average in the inset contain all structural components of the NC. (B) The linear region of the tomographic nucleocapsid reconstruction (A) was translated in Z and rotated 360° in plane. At each shift/rotation point the volume was correlated to the initial (un-shifted) volume. The correlation plot is shown as a grey scale image. Eight regions have been highlighted demonstrating a characteristic right-handed helical pattern. (C). For comparison, both left and right handed helical correlation plots are shown. (D), Region three is shown, with the locations of correlation maxima shown with an X. The angular distance between each maximum was calculated from several plots. A total of 71 measurements gave an average angular distance of 33.6°+/−8.5° between helical repeats, resulting in 10.7 repeats per turn. Using the 6.96 nm pitch (Fig. S8) the step in Z per helical repeat was calculated as 0.65 nm. These helical symmetry values were then imposed on the nucleocapsid tomogram and this structure was used as the initial reference volume for refinement using the iterative helical real space reconstruction method. (TIF) Click here for additional data file. Figure S3 Surface spike distribution in the Ebola VLP. Longitudinal Z-slices through the top and middle of the particle are shown, as well as the end-on view (A). The tomogram is shown as a shaded surface at a density threshold that indicates the spikes (B). The volume from one side of the tomogram has been extracted, and a red-blue color scheme shows the depth at which the spikes are located. This region of the envelope has a surface area of 15,651 nm 2 . Selected spikes have been identified by red circles, the single particle reconstruction of the spike is shown at the same scale to the right in a red square for comparison. The same region in (B) is shown in (C) with a solid orange cylinder to provide a visual cue for the viral envelope. Eighty-six individual spikes were counted (white spheres) and have a patchy distribution (D), each spike would occupy an average area of 182 nm 2 , giving an average spacing between spikes of 15.2 nm. The reconstruction of the spike (blue) with the docked KZ52 Fab (purple) has been included to show that there is ample room for antibody attachment. (TIF) Click here for additional data file. Figure S4 Extraction of Ebola nucleocapsid structure for sub-tomographic analysis. The tomogram of a linear region of the Ebola virus was used as the first reference for sub-tomogram analysis (A). When viewed along the helical axis (Y) or from the end perspectives (X,Z) the basic components are visible. The tomographic volume was also cylindrically masked along the X-axis, selecting only the density containing the nucleocapsid, to highlight the components of the nucleocapsid in the tomogram (B). Two-dimensional single particle image analysis was carried out with cryo-images (C) (not tomographic data sets), for comparison to the 3D tomographic data. The average shown in this panel was generated by reference free classification, using the “startnrclasses” program in EMAN [54] . The 6.96 nm helical pitch can be easily seen in the 2D average, but is also visible in the projections of the tomographic volume in (A, B). (TIF) Click here for additional data file. Figure S5 Representative low-magnification images of Ebola virus. Frozen hydrated virus is clearly visible with sections of the filamentous virus over both the support film and across the holes in the quantifoil film. Individual G1 (single genome copy) virus is circled in red, several sections containing a nucleocapsid are indicated by a blue arrowhead, and regions without a nucleocapsid are indicated by a magenta arrowhead. Globular heads are identified by yellow arrowheads. In this image the circles (light grey, 2 µ diameter) are filled with frozen hydrated virus in a thin aqueous layer, and the quantifoil support film appears as darker grey. (TIF) Click here for additional data file. Table S1 Length analysis of “continuous” Ebola virus particles. The length of 2090 EBOV particles were measured using ImageJ [52] . The values in the “model length” column are based on multiples of the G1 mean length. The values in the in the “mean length” column were calculated directly from the data. Only full particles containing a continuously packaged nucleocapsid were measured, all others (linked-nucleocapsid and empty particles) were omitted from this analysis. The terms G1–G22 indicate the number of genomes/viral particle (i.e. G22 = 22 genomes). All measurements are in µm. (TIF) Click here for additional data file. Table S2 Modeling of RNA in the Ebola nucleocapsid. Two previously determined atomic resolution structures of negative stranded RNA viruses (VSV (2GIC.pdb) [58] , and RSV (2WJ8.pdb) [32] ) were used to estimate the EBOV nucleocapsid length and number of nucleotides per nucleoprotein. Images of VSV (A) and RSV (B) are shown as a molecular surface with the protein in orange and the RNA as a green ribbon. From left to right, they show a surface view from the side, a side-on cross section, an end-on view, the RNA density alone in projection, and a rotational average of the projection. The VSV-based estimate, with a saw-tooth pattern of RNA in the helix, gave a nucleocapsid which 614.37 nm long, too short for the measured length of the G1 EBOV (982 nm). The RSV-based model, with a relatively straight/circular pattern of RNA in the helix predicted a nucleocapsid 914.55 nm long, which closely fits the measured length of G1 virions, after allowing ∼34 nm space at each end to accommodate the curve of the envelope containing GP spikes and matrix proteins. The RSV-like model gives 13 nucleotides per nucleocapsid protein which is similar to previous biochemical estimates of 12–15 for Marburg virus [33] , suggesting that the RNA in the EBOV nucleocapsid is arranged in a smooth helical pattern at a diameter of ∼22 nm. (TIF) Click here for additional data file. Movie S1 3-D reconstruction of Ebola virus nucleocapsid. This movie shows the three-dimensional structure of the of the Ebola virus nucleocapsid as shaded surface representation. The surface is set at a density threshold which would include one copy of NP, VP24,VP30, VP35, and the RNA. The nucleocapsid rotates, and then is sliced through the Z-axis to show the internal components of the structure. (MOV) Click here for additional data file. Movie S2 Tomogram of Ebola virus. This movie shows slices in “Z” through a cryo-electron tomogram of a linear region of Ebola virus. The slices which are in the Z-plane pass back and forth through the virus showing various components such as the surface glycoprotein spikes and the nucleocapsid in the interior of the virus. (MOV) Click here for additional data file. Movie S3 Ebola virus spike distribution. This movie shows one surface of a cryo-electron tomogram of an Ebola virus-like particle, generated by expressing the VP40 and GP proteins. The structure rotates showing the distribution of spikes. The locations of individual spikes are identified by white spheres, and the reconstruction is replaced by a cylinder to show the patchy distribution of spikes on the surface of the virus-like particle. (MOV) Click here for additional data file. Movie S4 3-D reconstruction of Ebola virus spike. This movie shows the three-dimensional structure of the of the Ebola virus GP spike. The structure rotates showing views from different angles, and indicates the location of the docked 3CSY.pdb [42] structure with the GP1 and GP2 domains and KZ52 antibody (purple). (MOV) Click here for additional data file.
📊 Figures
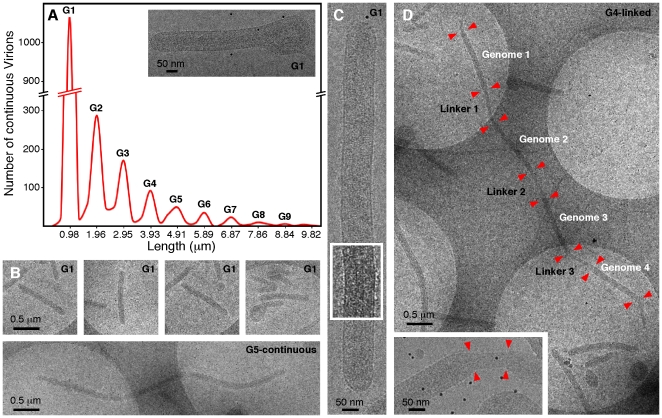
Figure 1
Quantitation of Ebola virus length.
(A) Histogram of virion length, with cryo-EM images showing single, continuous and linked particles. A total of 2090 virions with continuous nucleocapsids (no obvious segmentations) were measured, sho...
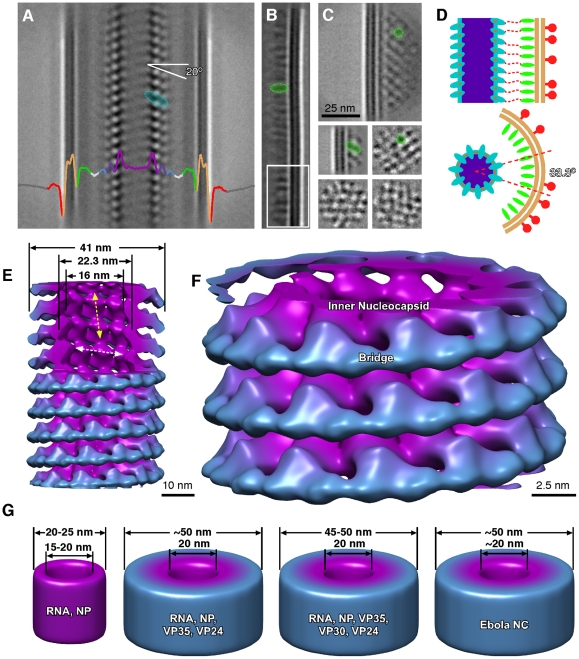
Figure 2
Image processing of Ebola virus.
Linear 2D averaging of EBOV: the envelope and nucleocapsid are prominent features (A). The line trace is colour-coded as follows: red, spike; beige, lipid envelope; green, membrane-associated proteins...
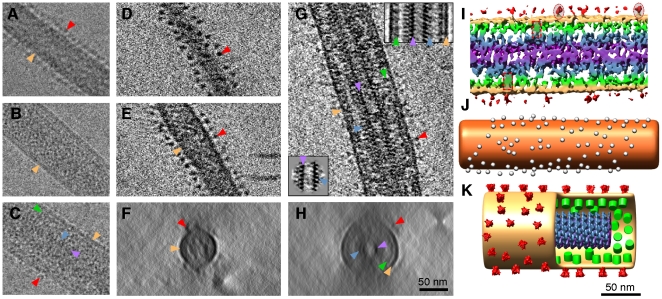
Figure 3
Electron tomography of Ebola virus.
(Au2013C) Cryo-EM images of; (A) VP40-GP VLP, (B) VP40 VLP, and (C) EBOV. (Du2013F) Electron tomogram of VP40-GP VLP showing; (D) a single Xu2013Y slice cutting through the spikes at the top of the VL...
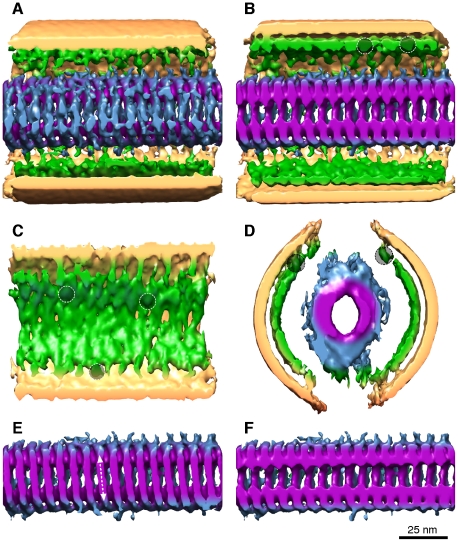
Figure 4
Sub-tomogram averaging of Ebola virus.
(Au2013D) Sections of the density map of the sub-tomogram average are shown from the top sliced just below the envelope (A), the middle of the virus (B), a side view of the virus (C), and an end-on sl...
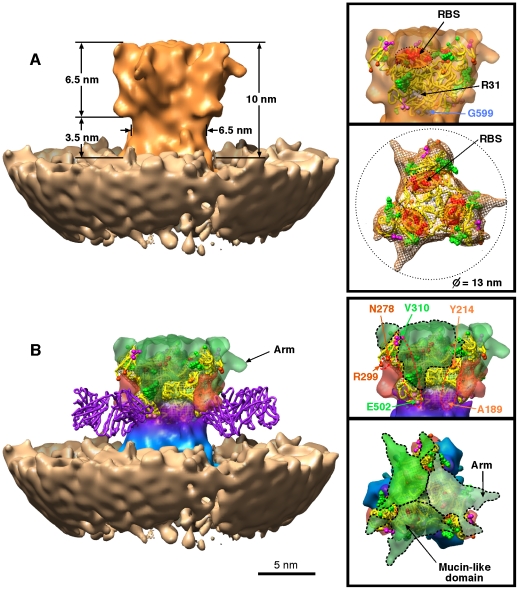
Figure 5
3D structure of the Ebola spike.
The density map of the EBOV GP spike viewed from the side, end-on, and side (with envelope) shows the docked GP1u2013GP2 structure in yellow (PDB entry 3CSY [42] ), glycosylation sites (green), and re...
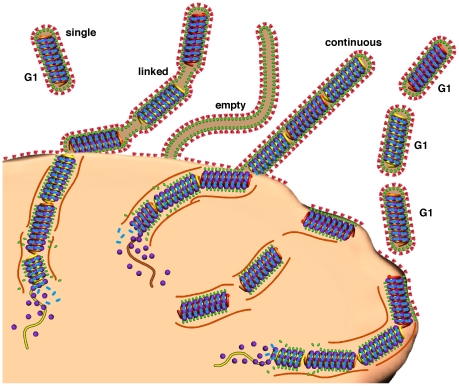
Figure 6
Schematic model of Ebola virus genome packaging.
EBOV appears pleomorphic, but an underlying structural organization is maintained. In the model we show the three basic morphological forms of EBOV particles; empty, linked, and continuous. Single gen...
Figure images are served from the NIH/NLM PubMed Central Open Access Subset or Europe PMC; copyright remains with the publishers and authors.
💬 Discussion
0 commentsNo comments yet. Be the first to start a discussion!
Leave a Comment