Abstract
Neurological manifestations of severe acute respiratory syndrome coronavirus 2 (SARS-CoV-2) infection represent a major issue in long coronavirus disease. How SARS-CoV-2 gains access to the brain and how infection leads to neurological symptoms are not clear because the principal means of viral entry by endocytosis, the angiotensin-converting enzyme 2 receptor, are barely detectable in the brain. We report that human neuronal cells, nonpermissive to infection through the endocytic pathway, can be infected when cocultured with permissive infected epithelial cells. SARS-CoV-2 induces the formation of tunneling nanotubes (TNTs) and exploits this route to spread to uninfected cells. In cellulo correlative fluorescence and cryo-electron tomography reveal that SARS-CoV-2 is associated with TNTs between permissive cells. Furthermore, multiple vesicular structures such as double-membrane vesicles, sites of viral replication, are observed inside TNTs between permissive and nonpermissive cells. Our data highlight a previously unknown mechanism of SARS-CoV-2 spreading, likely used as a route to invade nonpermissive cells and potentiate infection in permissive cells.
🔬 Techniques
🔭 Microscopes
💻 Software
✨ Fluorophores
🧪 Sample Preparation
🔬 Cell Lines
🏭 Microscope Brands
🧪 Reagent Suppliers
📷 Detectors
💻 Software Details
💾 Data Repositories
🏛️ Research Organizations (ROR)
Affiliated research institutions:
📋 Methods
Cell lines and viruses African green monkey kidney Vero
E6 cell and colorectal adenocarcinoma human epithelial (Caco-2) cells were maintained at 37°C at 5% CO 2 in Dulbecco’s minimum essential medium (DMEM) (Sigma-Aldrich) supplemented with 10% fetal bovine serum (FBS) and 1% penicillin/streptomycin. Human neuroblastoma (SH-SY5Y) cells were cultured at 37°C at 5% CO 2 in RPMI 1640 (Euroclone), as well as 10% FBS and 1% penicillin/streptomycin. Mouse catecholaminergic neuronal cell line, CAD, were given by H. Laude (Institut National de la Recherche Agronomique, Jouy-en-Josas, France) and cultured at 37°C at 5% CO 2 in Gibco Opti-MEM (Invitrogen), as well as 10% FBS and 1% penicillin/streptomycin. The strain BetaCoV/France/IDF0372/2020 was supplied by the National Reference Centre for Respiratory Viruses hosted by Institut Pasteur (Paris, France) and headed by S. van der Werf. The human sample from which strain BetaCoV/France/IDF0372/2020 was isolated has been provided by X. Lescure and Y. Yazdanpanah from the Bichat Hospital, Paris, France. Moreover, the strain BetaCoV/France/IDF0372/2020 was supplied through the European Virus Archive goes Global (Evag) platform, a project that has received funding from the European Union’s Horizon 2020 Research and Innovation Programme under grant agreement no. 653316.
Viral infection to identify SARS-CoV-2–permissive cells
To assess which cell lines were permissive to SARS-CoV-2 infection, the different cells were plated on a 96-multiwell plate and infected with an MOI from 10 −1 to 10 −5 in DMEM with 2% FBS. The cell lines used in this assay included Caco-2, CAD, SH-SY5Y, and Vero E6. All the cells were plated at a 60% confluence. The cells were incubated in infection medium for 3 days. At days 2 and 3 after infection, an aliquot of the supernatant from the higher MOI was collected for titration. At day 3 after infection, the monolayers were then fixed with 4% paraformaldehyde (PFA) for 45 min, and viral infection was visualized using an anti-N antibody. IF protocol for ImmunoSpot After 45 min of incubation with 4% PFA, the monolayers were washed with phosphate-buffered saline (PBS) and incubated 5 min with 1× PBS–0.5% Triton X-100 at R.T. (room temperature); the cells were then washed and incubated for 10 min with 1× PBS–50 mM NH 4 Cl. After washing, 30 min of blocking was performed using 1× PBS–2% bovine serum albumin (BSA); the monolayers were incubated with the primary antibody, a polyclonal SARS-CoV anti-N IgG, provided by N. Escriou (Institut Pasteur, Paris) overnight at 4°C. After washing, the cells were then incubated with a goat anti-rabbit Alexa Fluor 488–conjugated antibody for 1 hour. After washing with 1× PBS to remove the unbound antibody, the IF was visualized using the Fluoro-X suite of a C.T.L. ImmunoSpot S6 image analyzer.
Show full methods section
Cell lines and viruses African green monkey kidney Vero
E6 cell and colorectal adenocarcinoma human epithelial (Caco-2) cells were maintained at 37°C at 5% CO 2 in Dulbecco’s minimum essential medium (DMEM) (Sigma-Aldrich) supplemented with 10% fetal bovine serum (FBS) and 1% penicillin/streptomycin. Human neuroblastoma (SH-SY5Y) cells were cultured at 37°C at 5% CO 2 in RPMI 1640 (Euroclone), as well as 10% FBS and 1% penicillin/streptomycin. Mouse catecholaminergic neuronal cell line, CAD, were given by H. Laude (Institut National de la Recherche Agronomique, Jouy-en-Josas, France) and cultured at 37°C at 5% CO 2 in Gibco Opti-MEM (Invitrogen), as well as 10% FBS and 1% penicillin/streptomycin. The strain BetaCoV/France/IDF0372/2020 was supplied by the National Reference Centre for Respiratory Viruses hosted by Institut Pasteur (Paris, France) and headed by S. van der Werf. The human sample from which strain BetaCoV/France/IDF0372/2020 was isolated has been provided by X. Lescure and Y. Yazdanpanah from the Bichat Hospital, Paris, France. Moreover, the strain BetaCoV/France/IDF0372/2020 was supplied through the European Virus Archive goes Global (Evag) platform, a project that has received funding from the European Union’s Horizon 2020 Research and Innovation Programme under grant agreement no. 653316.
Viral infection to identify SARS-CoV-2–permissive cells
To assess which cell lines were permissive to SARS-CoV-2 infection, the different cells were plated on a 96-multiwell plate and infected with an MOI from 10 −1 to 10 −5 in DMEM with 2% FBS. The cell lines used in this assay included Caco-2, CAD, SH-SY5Y, and Vero E6. All the cells were plated at a 60% confluence. The cells were incubated in infection medium for 3 days. At days 2 and 3 after infection, an aliquot of the supernatant from the higher MOI was collected for titration. At day 3 after infection, the monolayers were then fixed with 4% paraformaldehyde (PFA) for 45 min, and viral infection was visualized using an anti-N antibody. IF protocol for ImmunoSpot After 45 min of incubation with 4% PFA, the monolayers were washed with phosphate-buffered saline (PBS) and incubated 5 min with 1× PBS–0.5% Triton X-100 at R.T. (room temperature); the cells were then washed and incubated for 10 min with 1× PBS–50 mM NH 4 Cl. After washing, 30 min of blocking was performed using 1× PBS–2% bovine serum albumin (BSA); the monolayers were incubated with the primary antibody, a polyclonal SARS-CoV anti-N IgG, provided by N. Escriou (Institut Pasteur, Paris) overnight at 4°C. After washing, the cells were then incubated with a goat anti-rabbit Alexa Fluor 488–conjugated antibody for 1 hour. After washing with 1× PBS to remove the unbound antibody, the IF was visualized using the Fluoro-X suite of a C.T.L. ImmunoSpot S6 image analyzer.
Semisolid plaque assay
The aliquots of supernatant collected at day 2 and day 3 were used to assess viral production through a semisolid plaque assay. Each sample underwent 1:10 serial dilutions. A total of 250 μl of each dilution was used to infect a confluent monolayer of Vero E6 cells, in a 24-well multiwell plate, with a total of six wells per sample. Viral absorption was allowed for 1 hour at 37°C, and a semisolid overlay, composed of 1× MEM, 10% FBS, and 0.8% agarose, was then added to the infection (250 μl per well). The cells were incubated at 37°C for 72 hours at 5% CO 2 . Last, the infected monolayers were fixed with 500 μl of 4% PFA for 30 min. Afterward, the PFA was removed, and the monolayers were then stained with crystal violet solution containing 2% PFA to evaluate the cytopathic effect. The reaction was stopped after 15 min, and residual crystal violet was removed through immersion in diluted bleach, followed by washing in water. Focus-forming assay Vero E6 cells were plated in a 96-multiwell plate of 2 × 10 4 cells per well. The monolayers were then infected with serial dilutions (1:10) of samples to be titrated. The infection was allowed at 37°C for 2 hours at 5% CO 2 . Afterward, the infection medium was removed, and a semisolid overlay composed of 1.5% carboxymethyl cellulose and 1× MEM was added to the monolayer. The cells were incubated at 37°C for 36 hours at 5% CO 2 to allow foci formation. The monolayers were then fixed with 4% PFA; after 45 min, they were washed with PBS and incubated for 5 min with 1× PBS–0.5% Triton X-100 at R.T.; the cells were then washed again and incubated for 10 min with 1× PBS–50 mM NH 4 Cl. After washing, the cells were incubated 2 min in 0.05% PBS–Tween 20 and then incubated with the primary antibody, a polyclonal SARS-CoV anti-N IgG, provided by N. Escriou, Institut Pasteur, Paris (or alternatively with a human SARS-CoV-2 anti-S IgG provided by C. Planchais from the group of Hugo Mouquet Institut Pasteur, Paris), overnight at 4°C. After washing, the cells were then incubated with an anti-rabbit (or an anti-human) horseradish peroxidase–conjugated antibody for 1 hour. After washing with 1× PBS to remove the unbound antibody, the foci were visualized using a 3,3′-diaminobenzidine staining solution in PBS with 8% NiCl and washed three times with water to stop the reaction. The foci were then visualized and counted using the BioSpot suite of a C.T.L. ImmunoSpot S6 Image Analyzer.
Lentiviral transduction
In transduction of SH-SY5Y and Vero E6 cells with a lentiviral vector expressing pCMV-mCherry, 600,000 SH-SY5Y cells and 400,000 Vero E6 cells were plated in 60-mm plates. After 24 hours, they were infected with 800 μl of LV-pCMV-mCherry. After 48 hours, cells expressing mCherry have been validated. In transduction of SH-SY5Y cells with a lentiviral vector expressing pCMV-H2B-GFP, 600,000 SH-SY5Y cells were plated in 60-mm plates. After 24 hours, they were infected with 800 μl of LV-pCMV-H2B-GFP. In transduction of SH-SY5Y cells with a lentiviral vector expressing pCMV-H2B-GFP, 600,000 SH-SY5Y cells were plated in 60-mm plates. After 24 hours, they were infected with 800 μl of LV-pCMV-H2B-GFP. SARS-CoV-2 infection of Vero E6 cells for coculture experiments and cryo-EM grids A total of 1,000,0000 of donor Vero E6 cells were infected with an MOI of 0.05 in DMEM without FBS for 2 hours. Afterward, the infection medium was removed and substituted with fresh DMEM with 10% FBS. The cells were left in incubation at 37°C for 48 hours at 5% CO 2 . After that time, cells were trypsinized, centrifuged (1000 rpm for 10 min), counted, and seeded for the different experiments.
Coculture preparation for SARS-CoV-2 transfer experiments and secretion test
A total of 1,000,0000 of donor Vero E6 cells were infected with an MOI of 0.05 in DMEM without FBS for 2 hours. Afterward, the infection medium was removed and substituted with fresh DMEM with 10% FBS. The cells were left in incubation at 37°C for 48 hours at 5% CO 2 . As acceptors were used, the nonpermissive SH-SY5Y cells and permissive Vero E6 cells stably transfected with a lentivirus expressed mCherry, according to the kind of experiment. The infected donors, as well as the acceptors cells, were trypsinized, centrifuged (1000 rpm for 10 min), counted, and cocultured on 24 glass coverslips at 37°C at 5% CO 2 with a 1:1 ratio (50,000 donor–50,000 acceptor). After 24 and 48 hours, cocultures were washed with 0.01% trypsin to remove excess of virus on top of the cell membrane and fixed for 30 min with 4% PFA, and then we proceed processing the cocultures for immunostaining of anti-N and anti-S. After the immunostaining, cells were stained with the HCS CellMask Blue Stain (1:300; Invitrogen) in 1× PBS for 30 min and then mounted. Images were acquired on an LSM 700 confocal microscope (Zeiss) with a 40× objective. After image acquisition, the number of acceptor cells, which had received SARS-CoV-2, identified by the anti-N and/or anti-S immunostaining was quantified. Briefly, after image acquisition, the number of acceptor cells, which had received SARS-CoV-2, identified by the anti-N and/or anti-S immunostaining was semiautomatedly quantified with the open-source software Icy ( http://icy.bioimageanalysis.org/ ). To evaluate the possibility of SARS-CoV-2 transfer from donor to acceptor cells mediated by secretion, the supernatants from SARS-CoV-2–infected Vero E6 cells were collected, centrifuged at 1000 rpm for 10 min to remove floating cells, and added on acceptor cells: SH-SY5Y mCherry. After 24 and 48 hours, acceptor cells were washed with 0.01% trypsin and fixed with 4% PFA at R.T. for 30 min. After image acquisition, acceptor cells were counted for the presence of SARS-CoV-2 signal. Secretion test was performed in parallel to all the coculture experiments performed in this study by following the same protocol. In addition, the supernatants from donor-infected cells were used to assess viral production by focus-forming assay titration protocol. IF labeling Cells were fixed in 4% PFA for 30 min, quenched with 50 mM NH 4 Cl for 15 min, permeabilized with 0.5% Triton X-100 for 5 min in 1× PBS, and blocked with 1× PBS containing 2% BSA (w/v) for 1 hour. Cells were then incubated with primary antibody dissolved in 2% BSA in 1× PBS. The primary antibody used were the following: a rabbit anti-N (1:500; a gift from N. Escriou, Institut Pasteur, Paris) overnight, an anti-human spike (1:100; H2-162; produced by C. Planchais from the group of Hugo Mouquet Institut Pasteur, Paris) overnight, an anti-dsRNA monoclonal antibody J2 (1:50; RNT-SCI-10010200, Jena Bioscience) overnight, an anti-sheep nsp3 (1:200; MRC PPU Reagents) overnight, and anti-rabbit Giantin (1:500; BioLegend) overnight. The day after, cells were thoroughly washed and incubated for 40 min with an anti-rabbit Alexa Fluor 633–conjugated secondary antibody (Invitrogen), an anti-human Alexa Fluor 488–conjugated secondary antibody (Invitrogen), goat anti-mouse Alexa Fluor 633–conjugated secondary antibody (Invitrogen), donkey anti-sheep IgG (H + L) Alexa Fluor 488–conjugated secondary antibody (Invitrogen), and anti-rabbit Alexa Fluor 488–conjugated secondary antibody (Invitrogen) at 1:500 in 2% BSA (w/v) in 1× PBS. Cells were then carefully washed in 1× PBS and labeled with the HCS CellMask Blue Stain (1:300; Invitrogen) in 1× PBS for 30 min and then mounted. For anti-ACE2 antibody (PA5-20046, Thermo Fisher Scientific) immunostaining, cells were fixed in 4% PFA for 10 min, quenched with 50 mM NH 4 Cl for 15 min, and blocked with 1× PBS containing 2% BSA (w/v) for 1 hour. Cells were then incubated with primary antibody overnight dissolved in 2% BSA in 1× PBS. The day after, cells were thoroughly washed and incubated for 40 min with an anti-rabbit Alexa Fluor 488–conjugated secondary antibody (Invitrogen) at 1:500 in 2% BSA (w/v) in 1× PBS. Cells were then carefully washed in 1× PBS and labeled with the HCS CellMask Blue Stain (1:300; Invitrogen) in 1× PBS for 30 min and then mounted. For KDEL (SPA-827, Enzo Life Sciences) and nsp3 immunostaining, cells were fixed in 4% PFA for 30 min, quenched with 50 mM NH 4 Cl for 15 min, blocked, and permeabilized with 1× PBS containing 0.0075% saponin and 0.01% gelatin for 30 min. Cells were then incubated with primary antibody KDEL (1:100) and nsp3 (1:300) overnight and dissolved in 0.0075% saponin and 0.01% gelatin in 1× PBS. The day after, cells were thoroughly washed and incubated for 40 min with an anti-goat anti-mouse Alexa Fluor 633–conjugated secondary antibody (Invitrogen) for KDEL and donkey anti-Sheep IgG (H + L) Alexa Fluor 488–conjugated secondary antibody (Invitrogen) for nsp3. Cells were then carefully washed in 1× PBS and labeled with the HCS CellMask Blue Stain (1:300; Invitrogen) in 1× PBS for 30 min and then mounted. For microtubule and actin staining, cells were prewarmed with PHEM buffer [60 mM Pipes (pH 6.9), 25 mM Hepes, 10 mM EGTA, and 2 mM MgCl 2 in H 2 O] before fixing with 4% PFA and 0.05% glutaraldehyde (GA) in PHEM for 30 min at 37°C. Cells were then incubated in a 50 mM NH 4 Cl solution for 15 min at R.T. Cells were further permeabilized with 0.1% Triton X-100 in 1× PBS for 2 min. After three washes with 1× PBS, cells were blocked using 2% BSA in 1× PBS for 30 min. Cells were then incubated for 1 hour with mouse anti–α-tubulin antibody (T9026, Sigma-Aldrich) diluted 1:500 in 2% BSA in 1× PBS. Washed cells were then incubated with goat anti-mouse Alexa Fluor 488 nm (Invitrogen) diluted 1:500 in blocking solution for 40 min. For F-actin detection, cells were stained with 0.6 μM rhodamine-phalloidin in PBS for 20 min. Coculture preparation for SARS-CoV-2 transfer experiments in the presence of neutralizing antibody The viral stock of 1 × 10 5 to 5 × 10 5 focus-forming units (FFU)/ml used to infect Vero E6 cells was incubated at 37°C for 1 hour at 5% CO 2 with three different concentrations of IgG C3 235 (1, 10, and 100 μg/ml) to determinate the minimal concentration of antibody sufficient to achieve its neutralization. The neutralized viral stock was then used to infect monolayers of Vero E6 cells for 48 hours. Viral production was then assessed by titration of the supernatant by focus-forming assay. Both 100 and 10 μg/ml concentration of antibody were enough to elicit complete neutralization of the viral stock, resulting in no sign of viral production. Therefore, a concentration of 10 μg/ml was chosen as the minimal concentration to investigate direct cell-to-cell transfer of SARS-CoV-2 in Vero E6 cells. Vero E6 donor cells, infected as previously described, were put in coculture, in a 1:1 ratio, with Vero E6 mCherry acceptors and SH-SY5Y mCherry acceptor cells in the presence of a SARS-CoV-2–neutralizing antibody. Briefly, infected donors were trypsinized and counted. They were then diluted at a concentration of 5 × 10 5 cells/ml in DMEM with 5% FBS, containing a concentration of anti–SARS-CoV-2 IgG C3 235 (10 μg/ml; produced by C. Planchais from the group of Hugo Mouquet Institut Pasteur, Paris), which has been proved to be sufficient to elicit complete neutralization for a viral concentration of 1 × 10 5 to 5 × 10 5 FFU/ml. Donor cells were incubated in the presence of the antibody at 37°C for 1 hour at 5% CO 2 . Afterward, donor cells were cocultured at a ratio of 1:1 with Vero E6 mCherry and SH-SY5Y mCherry acceptor cells in DMEM 5% with FBS, with the aforementioned neutralizing antibody (10 μg/ml). The cocultures were incubated at 37°C for 24 and 48 hours at 5% CO 2 . Then, cocultures were fixed in 4% PFA for 30 min and immunostained for the anti-N (protocol described above) and with the HCS CellMask Blue Stain (1:300; Invitrogen) for 30 min. Images were acquired on an LSM 700 confocal microscope (Zeiss) with a 40× objective. After image acquisition, the number of acceptor cells, which had received SARS-CoV-2, identified by the anti-N immunostaining was quantified by the Icy software as before. In parallel, the supernatant of each condition was then collected to assess viral neutralization using focus-forming assay titration protocol. For the secretion test, performed in parallel with the coculture, an aliquot of the supernatant from the donor was incubated with anti–SARS-CoV-2 IgG C3 235 (10 μg/ml) for 1 hour at 37°C, to neutralize the viral particles, present in the supernatant. In parallel, another aliquot was left untreated for comparison. The supernatants were then added on top of acceptors cells. Afterward, we proceed for the analysis as before mentioned. Coculture preparation for SARS-CoV-2 transfer experiments in the presence of remdesivir To determine the minimal concentration of remdesivir (Interchim, B60DF0) sufficient to block SARS-CoV-2 replication, naïve Vero E6 mCherry cells were preincubated for 1 hour at 37°C, with three different concentrations of remdesivir (3, 30, and 40 μM). They were then maintained in the presence of an inhibitor and were infected with SARS-CoV-2 at an MOI of 0.05. After 48 hours, SARS-CoV-2–infected Vero E6 cells were stained using an anti-dsRNA J2 antibody and anti-S antibodies to detect SARS-CoV-2 particles. A total of 30 μM was chosen as the minimal concentration to investigate whether the viral signal observed in the neuronal acceptor cells corresponds to de novo replicated virus. Infected Vero E6 donor cells were placed in coculture with SH-SY5Y mCherry acceptors pretreated at 37°C for 1 hour at 5% CO 2 . The cocultures were maintained in the presence of the inhibitor. After 48 hours, cocultures were fixed and immunostained with anti-S and anti-dsRNA J2 antibodies to detect SARS-CoV-2 particles. For the secretion test, SH-SY5mCherry and Vero E6 mCherry cells were preincubated or not with the remdesivir for 1 hour and then were maintained in the presence of the inhibitor and challenged with the supernatant of infected cells for 48 hours. Images were acquired on an LSM 700 confocal microscope (Zeiss) with a 40× objective. After image acquisition, the number of acceptor cells, which had received SARS-CoV-2, identified by anti-S and J2 immunostaining, was quantified using Icy software as before.
TNT counting
For quantification of TNT-connected cells, Vero E6 cells infected (as described before) and not infected were trypsinized and counted; 50,000 cells were plated on 24 glass coverslips. For quantification of TNT-connected cells between Vero E6 and SH-SY5Y mCherry cells infected or not that were trypsinized and counted, 50,000 cells of Vero E6 and 50,000 cells of SH-SY5Y mCherry cells were plated on 24 glass coverslips. After 24 hours, cells were fixed (15 min at 37°C at 2% PFA, 0.05% GA, and 0.2 M Hepes in 1× PBS and then additionally fixed for 15 min in 4% PFA and 0.2 M Hepes in 1× PBS). Cells were carefully washed in 1× PBS, labeled for 20 min at R.T. with a solution (3.3 μg/μl) of wheat germ agglutinin (WGA) Alexa Fluor 488-nm conjugate (Invitrogen) in 1× PBS, washed again, and mounted. The whole cellular volume was imaged by acquiring 0.45-μm z stacks with an inverted confocal microscope (Zeiss LSM 700) using ZEN software. TNT-connected cells, connected by straight WGA-labeled structures that do not touch the substrate, were manually counted by Icy software using the semiautomatized TNT counting tool as previously described ( 53 , 78 ). The 3D renderings of TNTs were performed using Imaris software.
Cell preparation for cryo-EM Carbon-coated gold
TEM grids (NH2A R2/2, QUANTIFOIL) were glow-discharged at 2 mA and 1.5 × 10 −1 to 1.8 × 10 −1 mbar for 1 min in an ELMO (Cordouan) glow discharge system. Grids were sterilized under ultraviolet three times for 30 min at R.T. and then incubated at 37°C at complete culture medium for 2 hours. A total of 200,000 infected Vero E6 cells (48 hours after infection) were counted and seeded on cryo-EM grids positioned in 35-mm Ibidi μ-Dish (BioValley, France). For coculture, 100,000 infected Vero E6 cells (48 hours after infection) were cocultured with 100,000 SH-SY5Y mCherry on cryo-EM grids in 35-mm Ibidi μ-Dish (BioValley, France). After 24 hours, cells resulted in three to four cells per grid square. Before chemical and cryo-plunging freezing, cells were labeled with WGA–Alexa Fluor 488 (1:300 in PBS) for 5 min at 37°C. For cryo-CLEM, cells were chemically fixed in 2% PFA and 0.05% GA in 0.2 M Hepes for 15 min followed by fixation in 4% PFA in 0.2 M Hepes for 15 min and were kept hydrated in 1× PBS buffer before vitrification. For cryo-CLEM using the anti-S primary antibody, cells were fixed with 4% PFA for 30 min at 37°C, quenched with 50 mM NH 4 Cl for 15 min, and blocked with 1× PBS containing 2% BSA (w/v) for overnight at 4°C. Cells were labeled with an anti-human Alexa Fluor 488–conjugated secondary antibody (Invitrogen) at 1:500 and labeled with the HCS CellMask Blue Stain (1:300; Invitrogen). For cell vitrification, cells were blotted from the back side of the grid for 10 s and rapidly frozen in liquid ethane using a Leica EM GP system as we performed before ( 39 ).
Cryo-ET data acquisition and tomogram reconstruction
The cryo-EM data were collected from different grids at the Nanoimaging Core Facility of the Institut Pasteur using a Thermo Fisher Scientific 300-kV Titan Krios G3 cryo-TEMs equipped with a Gatan energy filter bioquantum/K3.
Cryo-ET software from Thermo Fisher
Scientific was used to acquire the data. Tomograms were acquired using a dose-symmetric tilt scheme ( 79 ); a ±60° tilt range with a tilt step 2 was used to acquire the tilt series. Tilt images were acquired in counting mode with a calibrated physical pixel size of 3.2 Å and total dose over the full tilt series of 3.295 e − /Å 2 and dose rate of 39,739 e − per pixel per second with an exposure time of 1 s. The defocus applied was in a range of −3- to –6-μm defocus. The tomogram showed in Fig. 8D was performed on Thermo Fisher Scientific Glacios 200-kV cryo-TEM equipped with Falcon 3 direct electron detectors. Tilt series were recorded using Cryo-ET software (Thermo Fisher Scientific) in counting mode and an angular range of −60° to +60°, with a calibrated physical pixel size of 3.2 Å and a total dose over the full tilt series of 3.49 e − /Å 2 and dose rate of 42.16 e − per pixel per second and 3.49 e − /Å 2 with 1-s exposure time and 70-μm objective apertures. The defocus applied was in a range of −3-μm defocus. The tomograms were reconstructed using IMOD (eTomo). Final alignments were done using 10-nm fiducial gold particles coated with BSA (BSA Gold Tracer, Electron Microscopy Sciences). Gold beads were manually selected and automatically tracked. The fiducial model was corrected in all cases where the automatic tracking failed. Tomograms were binned two times corresponding to a pixel size of 0.676 nm for the Titan and 0.6368 nm for the Glacios, and SIRT (simultaneous iterative reconstruction technique)–like filter ( 15 ) option in eTomo was applied. For visualization purposes, the reconstructed volumes were processed by a Gaussian filter. The cryo-ET slice in fig. S11D is obtained by a collage of two different cryo-slices of the same tomogram.
Optical resolution of the Titan Krios microscope
The optical resolution limit of an electron microscope of the Titan Krios class is 1.2 Å. This resolution has recently been achieved by two groups ( 58 , 59 ). Nevertheless, because of the nature of cryo-EM, where we have to use a limited electron dose in every image to prevent damage of the structure beyond the resolution we like to achieve, we have to record many copies of the same protein and apply extensive image processing procedures to classify and average different particle projections together to finally end up with a high-resolution structure. This method is called the single-particle analysis and has become a standard procedure in cryo-EM. In cryo-ET of cells, we are dealing with objects that are never alike: Each cell is different. We can therefore not apply any averaging image processing in this case. If one would be interested in resolving the viral spike of SARS-CoV-2 inside the native cell, then a method of subtomographic averaging can be used; however, our biological question in this paper does not allow such an approach. We are therefor left with the resolution of a single low-dose tomogram. Here, the thickness of the sample plays a decisive role. Thicker samples will require more dose to provide enough signal on the detector to still provide an image. While we are tilting to 60°, the sample will additionally get thicker, limiting the signal even more. Hence, for our experiments where the TNTs are of notable thickness, the signal and, thus, resolution in the final tomograms will be limited. Last, the nature of cryo-ET with discrete tilt steps in only one α-tilt direction causes the resolution in a single tomogram to be anisotropic in X , Y , and Z . For estimating the resolution, we can only guess on the basis of the structures we can recognize. A good estimate would be between 1- and 4-nm resolution.
Statistical analysis
All column graphs and statistical analysis were performed using the GraphPad Prism version 7 software. Unpaired t test was applied for comparisons of two conditions presented in Figs. 1 and 5 . For more than two groups, statistical significance was assessed by a one-way analysis of variance (ANOVA) with Tukey correction in Fig. 4C . Quantifications were done blind. Quantitative data were depicted as (±SEM) mean SD. The graph in Fig. 1H shows the percentage of N transfer in coculture at 24 and 48 hours. The mean percentage of N transfer in coculture at 24 and 48 hours is 36.47% ± 3.96 and 62.56% ± 8.28, respectively (* P = 0.0468 for coculture at 48 hours versus coculture at 24 hours; n = 3). The graph in Fig. 1L shows the percentage of S transfer in coculture at 24 and 48 hours. The mean percentage of S transfer in coculture at 24 and 48 hours is 21.84% ± 5.09 and 42.44% ± 4.38, respectively (* P = 0.0374 for coculture at 48 hours versus coculture at 24 hours; n = 3). The graph in Fig. 4C shows the percentage of N transfer in coculture at 24 and 48 hours treated and not with the neutralizing antibody. The mean percentage of N transfer in coculture at 24-hour control is 95.45% ± 4.29, and that of N transfer in coculture at 24 hours plus neutralizing antibody is 42.91 ± 4.55; ** P = 0.0018 for coculture at 24-hour control versus coculture at 24 hours plus neutralizing antibody. The mean percentage of N transfer in coculture at 48-hour control is 96.88% ± 3.12, and that of N transfer in coculture at 48 hours plus neutralizing antibody is 63.90 ± 1.99; * P = 0.0104 for coculture at 48-hour control versus coculture at 48 hours plus neutralizing antibody. P = 0.9914 [not significant (ns)] for coculture at 24-hour control versus coculture at 48-hour control. * P = 0.0122 for coculture at 24-hour control versus coculture at 48 hours plus neutralizing antibody. ** P = 0.0016 for coculture at 24-hour control antibody versus coculture at 48 hours plus neutralizing antibody. * P = 0.0496 for coculture at 24 hours plus neutralizing antibody versus coculture at 48 hours plus neutralizing antibody. The mean percentage of N transfer in secretion at 24-hour control is 100% ± 0, and that of N transfer in coculture at 24 hours plus neutralizing antibody is 0 ± 0; *** P = 0.0005 for coculture at 24-hour control versus coculture at 24 hours plus neutralizing antibody. The mean percentage of N transfer in secretion at 48-hour control is 80% ± 10, and that of N transfer in coculture at 48 hours plus neutralizing antibody is 0 ± 0; *** P = 0.0008 for coculture at 48-hour control versus coculture at 48 hours plus neutralizing antibody. The graph in Fig. 5C shows the percentage of TNT-connected cells between noninfected Vero E6 and SARS-CoV-2–infected cells. The mean percentage of TNT-connected noninfected Vero E6 is 13.95% ± 2.46. The mean percentage of TNT-connected SARS-CoV-2–infected Vero E6 cells is 44.69% ± 1.96 (*** P = 0.0006 for Vero E6 SARS-CoV-2 versus noninfected Vero E6; n = 3). PCC was used to quantify colocalization between anti-S and anti-N. Twenty cells were considered. PCC was calculated using JACoP plugins in Fiji. The length of the TNTs was measured using Fiji software. The TNTs positive for anti-nsp3 puncta have been counted manually using Fiji software. The graph in fig. S5C shows the percentage of S transfer in 48-hour coculture (control and treated with the inhibitor). The mean percentage of S transfer in coculture control is 46.2% ± 1.7, and that of S transfer in coculture plus inhibitor is 15.3% ± 2.1 (** P = 0.0075 for coculture plus inhibitor versus coculture control). The mean percentage of J2 transfer in coculture control is 43.2 ± 2.6, and that of J2 transfer in coculture plus inhibitor is 17.2% ± 0.2 (* P = 0.0101 for coculture plus inhibitor versus coculture control). The graph in fig. S7C shows the percentage of TNT-connected cells between noninfected Vero E6 and SH-SY5Y cells and TNT-connected cells between noninfected Vero E6 and SH-SY5Y cells. The mean percentage of TNT-connected Vero E6 and noninfected SH-SY5Y cells is 35% ± 2.02. The mean percentage of TNT-connected infected Vero E6 and SH-SY5Y cells is 61.75% ± 6.27 (* P = 0.0154 for coculture SARS-CoV-2–infected versus coculture noninfected; n = 3). The graph in fig. S9 shows the percentage of N transfer in coculture at 48 hours of treated or not with neutralizing antibody. The mean percentage of N transfer in coculture control is 57.01% ± 3.95, and that of N transfer in coculture plus neutralizing antibody is 50.92 ± 3.55 [ P = 0.3154 (ns) for coculture control versus coculture plus neutralizing antibody; n = 3].
IF protocol for ImmunoSpot After 45 min of incubation with 4% PFA, the monolayers were washed with phosphate-buffered saline (PBS) and incubated 5 min with 1× PBS–0.5% Triton X-100 at R.T. (room temperature); the cells were then washed and incubated for 10 min with 1× PBS–50 mM NH 4 Cl. After washing, 30 min of blocking was performed using 1× PBS–2% bovine serum albumin (BSA); the monolayers were incubated with the primary antibody, a polyclonal SARS-CoV anti-N IgG, provided by N. Escriou (Institut Pasteur, Paris) overnight at 4°C. After washing, the cells were then incubated with a goat anti-rabbit Alexa Fluor 488–conjugated antibody for 1 hour. After washing with 1× PBS to remove the unbound antibody, the IF was visualized using the Fluoro-X suite of a C.T.L. ImmunoSpot S6 image analyzer.
Supplementary Materials This PDF file includes: Figs. S1 to S13 Click here for additional data file. Other Supplementary Material for this manuscript includes the following: Movies S1 to S7 Click here for additional data file.
Other Supplementary Material for this manuscript includes the following: Movies S1 to S7 Click here for additional data file.
📊 Figures
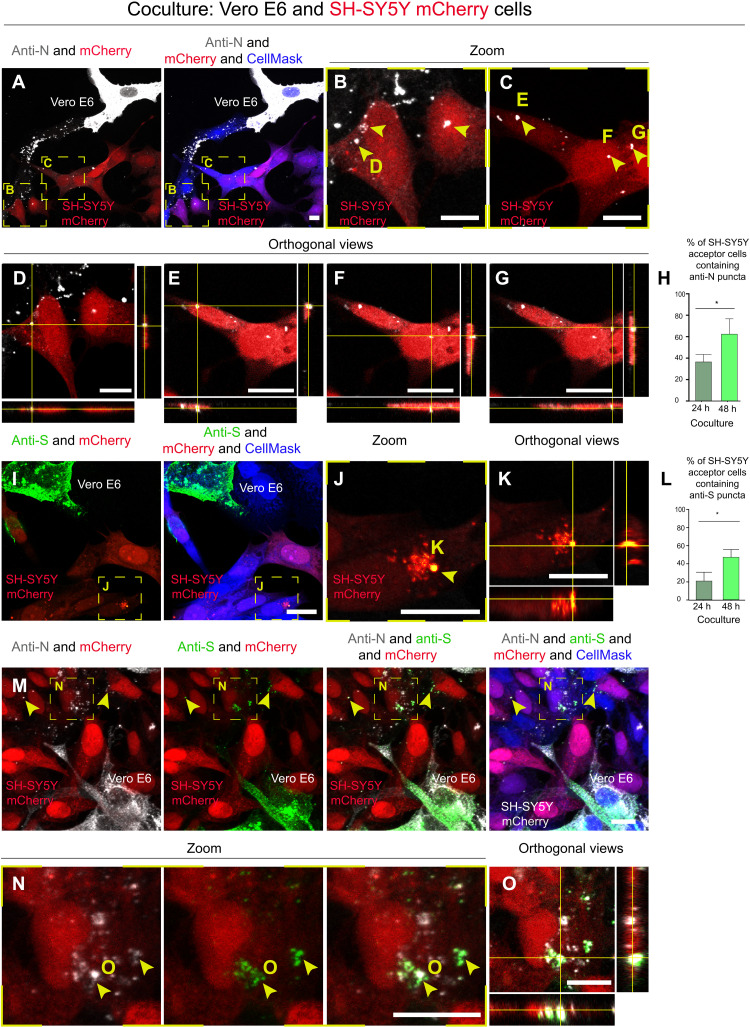
Fig. 1.
SARS-CoV-2 can reach SH-SY5Y neuronal cells from Vero E6 permissive cells.
Infected Vero E6 cells (donor cells) were cocultured with SH-SY5Y neuronal cells previously stably transfected with a vector that expresses mCherry (acceptor cells). Coculture was fixed at 24 and 48 h...
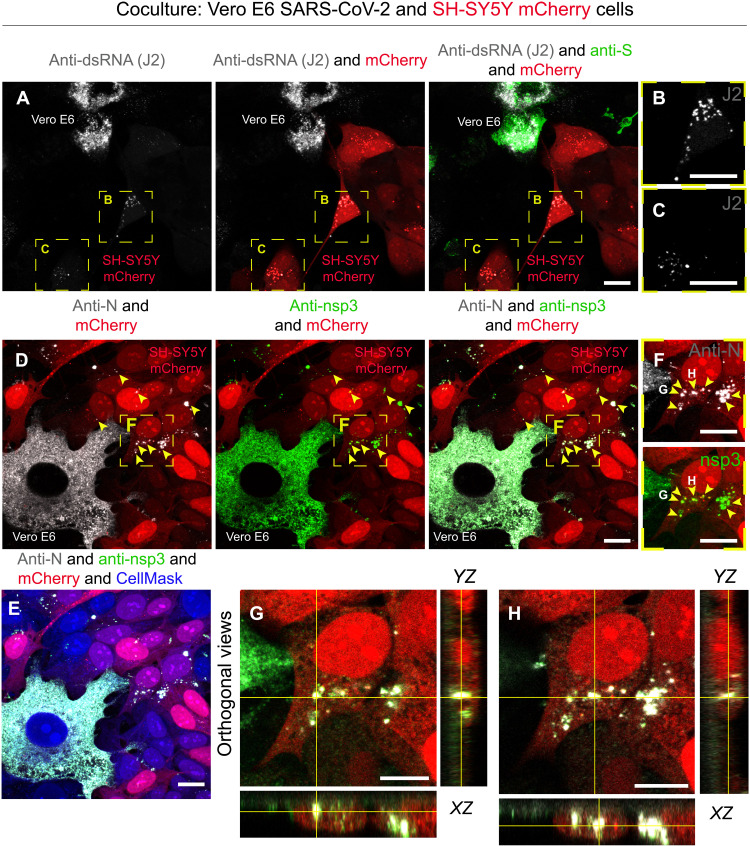
Fig. 2.
Anti-dsRNA antibody J2 and the nonstructural protein 3 are detected in SH-SY5Y cells cocultured with SARS-CoV-2u2013infected Vero E6 cells.
( A ) SARS-CoV-2u2013infected Vero E6 cells (donor cells) were cocultured for 48 hours with SH-SY5Y mCherry acceptor cells. Confocal micrographs showing the staining with J2 antibody are used to detec...
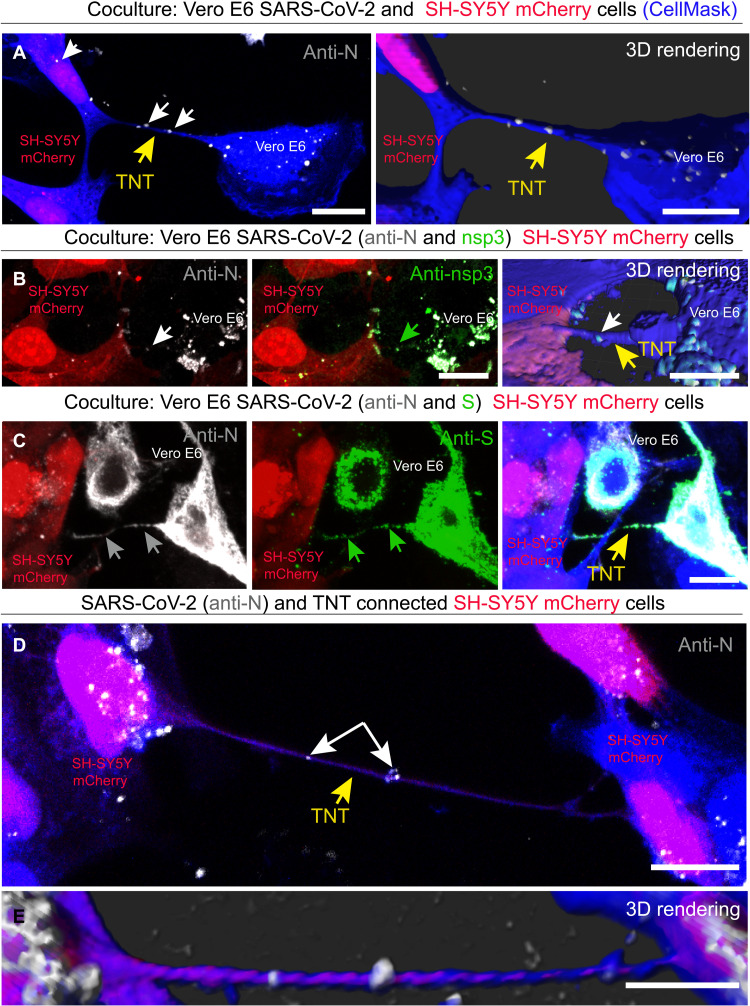
Fig. 3.
SARS-CoV-2 spread through TNTs from infected Vero E6 to noninfected SH-SY5Y mCherry cells.
( A ) SARS-CoV-2u2013infected Vero E6 cells were cocultured with SH-SY5Y mCherry cells. Coculture was fixed at 48 hours and stained with the anti-N antibody to detect the virus. Two-dimensional (2D) c...
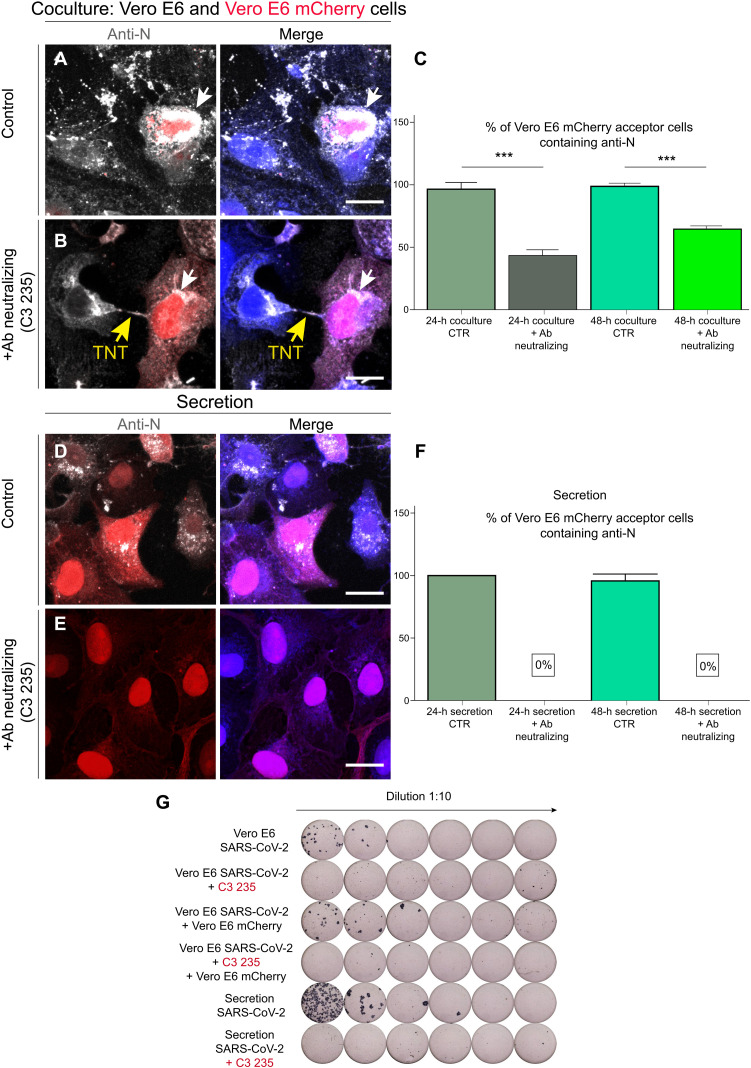
Fig. 4.
SARS-CoV-2 viral particles spread between permissive cells through TNTs.
( A ) Donor infected Vero E6 cells were put in coculture at 1:1 ratio with Vero E6 mCherry acceptors under control conditions (without neutralizing antibody) and (B) under neutralizing conditions. ( B...
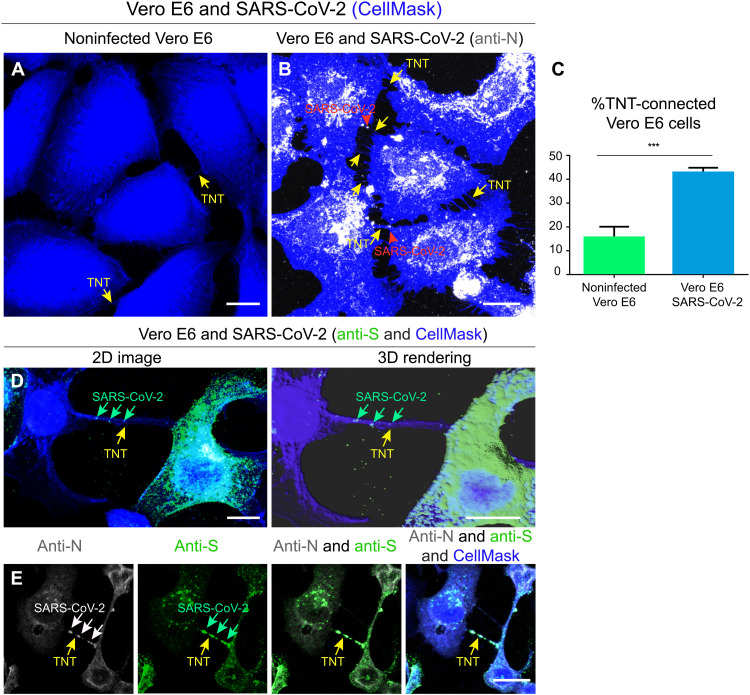
Fig. 5.
SARS-CoV-2 infection increases the number of TNTs between infected Vero E6 cells.
( A ) Confocal micrograph showing TNTs between noninfected Vero E6 cells. ( B ) Confocal micrograph showing TNTs between SARS-CoV-2u2013infected Vero E6 cells. Anti-N immunostaining is performed to de...
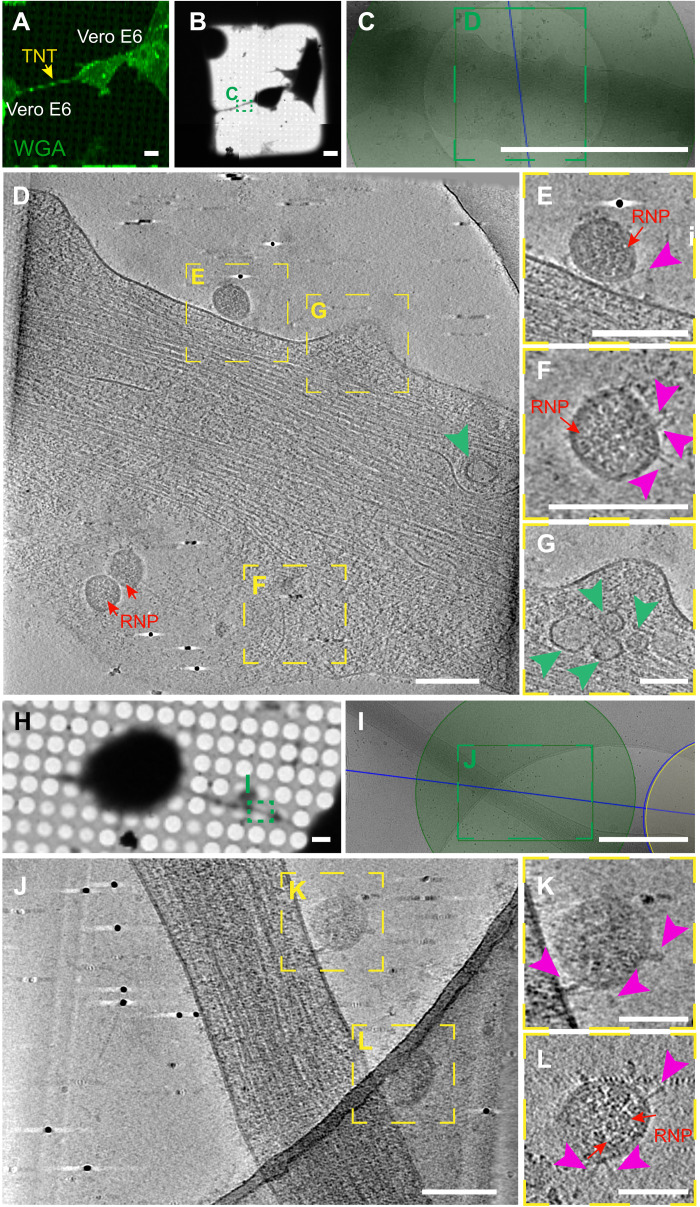
Fig. 6.
Cryo-CLEM reveal SARS-CoV-2 on TNTs between infected Vero E6 cells.
( A ) TNT-connected SARS-CoV-2u2013infected Vero E6 cells stained with wheat germ agglutinin (WGA) (green) and acquired by confocal microscopy (A), with low ( B ) and intermediate ( C ) magnification ...
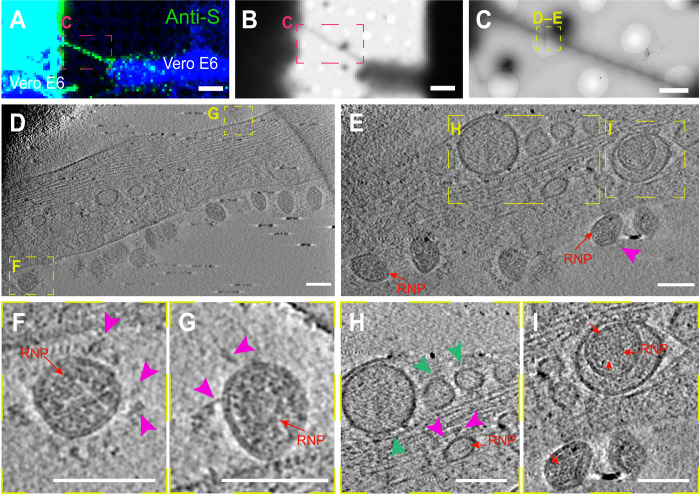
Fig. 7.
Correlative IF cryo-EM reveals SARS-CoV-2 localization in TNTs.
( A to H ) Cryo-EM grids were prepared using infected Vero E6 cells stained with anti-S antibody. (A) Confocal micrograph showing TNT connecting infected Vero E6 cells stained with anti-S antibody (gr...
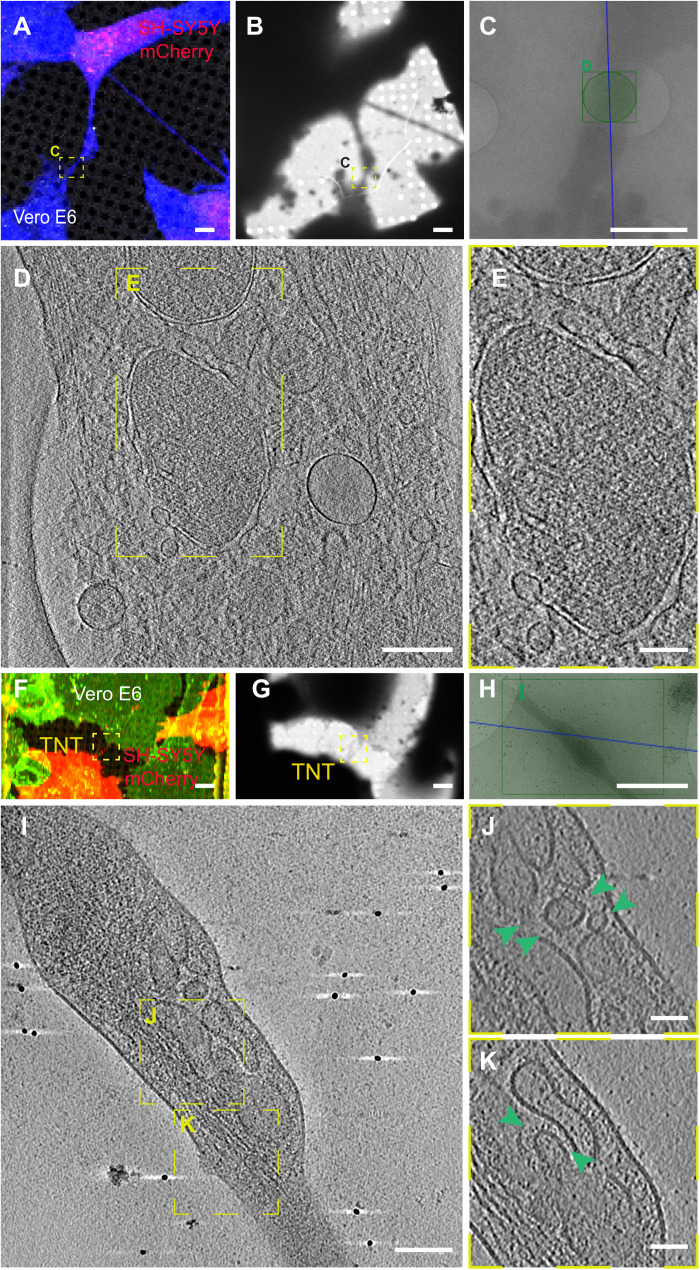
Fig. 8.
Ultrastructural analysis reveals SARS-CoV-2 compartments inside TNTs between permissive Vero E6 cells and nonpermissive SH-SY5Y neuronal cells.
( A ) Confocal micrographs showing a TNT connecting SARS-CoV-2u2013infected Vero E6 cells and SH-SY5Y mCherry cells stained with CellMask Blue. ( B ) Low and ( C ) intermediate magnification of an ele...
Figure images are served from the NIH/NLM PubMed Central Open Access Subset or Europe PMC; copyright remains with the publishers and authors.
💬 Discussion
0 commentsNo comments yet. Be the first to start a discussion!
Leave a Comment