Abstract
We present a method to robustly discriminate clustered from randomly distributed molecules detected with techniques based on single-molecule localization microscopy, such as PALM and STORM. The approach is based on deliberate variation of labeling density, such as titration of fluorescent antibody, combined with quantitative cluster analysis, and it thereby circumvents the problem of cluster artifacts generated by overcounting of blinking fluorophores. The method was used to analyze nanocluster formation in resting and activated immune cells.
🔬 Techniques
🔭 Microscopes
💻 Software
✨ Fluorophores
🧪 Sample Preparation
🔬 Cell Lines
🏭 Microscope Brands
🧪 Reagent Suppliers
🔴 Lasers
📷 Detectors
💻 Software Details
🏛️ Research Organizations (ROR)
Affiliated research institutions:
📋 Methods
Cell culture, DNA constructs, antibodies and reagents Jurkat E6-1 T cells and Chinese Hamster Ovary (CHO) cells were from the American Type Culture Collection. Lck-deficient JCaM1.6 T cells were from the European Collection of Authenticated Cell Cultures. All cell lines were regularly tested to exclude Mycoplasma contamination. Jurkat cell lines were cultured in RPMI 1640 medium (Sigma-Aldrich), CHO cells in DMEM/HAM’s F-12 medium (Lonza); media were supplemented with 10% fetal bovine serum (FBS), 2 mM L-glutamine, 1,000 U ml -1 penicillin/streptomycin (all from Sigma-Aldrich) and cells were grown in a humidified atmosphere at 37 °C and 5% CO 2 . For microscopy, we used an imaging buffer consisting of HBSS (Lonza) supplemented with 2% FBS. Fluorescent proteins (mEOS3.2, mGFP) were fused to the C-terminus of Lck 21 or to the N-terminus of the GPI-anchor signal of the human folate receptor 22 . Fusion proteins were obtained by site-specifically inserting the PCR amplified sequence of the respective fluorescent protein into the retroviral expression vector construct pBMN-Z-Lck. Stable cell lines were generated by retroviral infections based on protocols from G. Nolan (Stanford University). Positive cells were enriched via a fluorescence assisted cell sorter (FACSAria; BD Biosciences). Fura-2-AM was from Molecular Probes. Cholesterol-PEG-KK114 was provided by A. Honigmann (Max Planck Institute of Molecular Cell Biology and Genetics, Dresden). Lck-specific antibody (BioLegend; clone Lck-01; catalog number 628301), LFA-1 (CD11)-specific antibody (BioLegend; clone TS2/4; catalog number 350602) and GFP-Trap (ChromoTek) were labeled with Alexa Fluor (AF) 647-NHS (Molecular Probes) following the supplier’s instructions and purified with Zeba desalting columns (Thermo Fisher Scientific). AF647-labeled antibody (clone X22) against clathrin heavy chain (anti-clathrin-HC-AF647) was purchased from Novus Biologicals (catalog number NB300-613AF647). CD3ε-specific antibody (clone OKT3; catalog number SAB4700041), fibronectin for surface coating and all other chemicals were obtained from Sigma-Aldrich if not noted otherwise. The biotinylated murine GFP-antibody (clone 9F9.F9; catalog number NB110-40670) was purchased from Novus Biologicals, AF647-conjugated goat anti-mouse secondary antibody was from Thermo Fisher Scientific (catalog number A-21235).
Show full methods section
Cell culture, DNA constructs, antibodies and reagents Jurkat E6-1 T cells and Chinese Hamster Ovary (CHO) cells were from the American Type Culture Collection. Lck-deficient JCaM1.6 T cells were from the European Collection of Authenticated Cell Cultures. All cell lines were regularly tested to exclude Mycoplasma contamination. Jurkat cell lines were cultured in RPMI 1640 medium (Sigma-Aldrich), CHO cells in DMEM/HAM’s F-12 medium (Lonza); media were supplemented with 10% fetal bovine serum (FBS), 2 mM L-glutamine, 1,000 U ml -1 penicillin/streptomycin (all from Sigma-Aldrich) and cells were grown in a humidified atmosphere at 37 °C and 5% CO 2 . For microscopy, we used an imaging buffer consisting of HBSS (Lonza) supplemented with 2% FBS. Fluorescent proteins (mEOS3.2, mGFP) were fused to the C-terminus of Lck 21 or to the N-terminus of the GPI-anchor signal of the human folate receptor 22 . Fusion proteins were obtained by site-specifically inserting the PCR amplified sequence of the respective fluorescent protein into the retroviral expression vector construct pBMN-Z-Lck. Stable cell lines were generated by retroviral infections based on protocols from G. Nolan (Stanford University). Positive cells were enriched via a fluorescence assisted cell sorter (FACSAria; BD Biosciences). Fura-2-AM was from Molecular Probes. Cholesterol-PEG-KK114 was provided by A. Honigmann (Max Planck Institute of Molecular Cell Biology and Genetics, Dresden). Lck-specific antibody (BioLegend; clone Lck-01; catalog number 628301), LFA-1 (CD11)-specific antibody (BioLegend; clone TS2/4; catalog number 350602) and GFP-Trap (ChromoTek) were labeled with Alexa Fluor (AF) 647-NHS (Molecular Probes) following the supplier’s instructions and purified with Zeba desalting columns (Thermo Fisher Scientific). AF647-labeled antibody (clone X22) against clathrin heavy chain (anti-clathrin-HC-AF647) was purchased from Novus Biologicals (catalog number NB300-613AF647). CD3ε-specific antibody (clone OKT3; catalog number SAB4700041), fibronectin for surface coating and all other chemicals were obtained from Sigma-Aldrich if not noted otherwise. The biotinylated murine GFP-antibody (clone 9F9.F9; catalog number NB110-40670) was purchased from Novus Biologicals, AF647-conjugated goat anti-mouse secondary antibody was from Thermo Fisher Scientific (catalog number A-21235).
Sample preparation
For imaging, cells were seeded on surface-coated LabTek chamber slides in imaging buffer at 37 °C for 5-10 min. Surfaces were prepared by incubating slides with 50 μg ml -1 fibronectin for 30 min at RT. To activate Jurkat cells, slides were coated with 10 μg ml -1 anti-CD3ε for 2 hrs at 37 °C. For experiments under activating conditions, cells were incubated on anti-CD3ε-coated glass slides for 10 min at 37 °C. Cells were fixed with 4% paraformaldehyde (PFA) for 10 min at RT. For antibody staining, cells were permeabilized with 0.1% (wt/vol) Triton X-100 for 10 min at RT and unspecific binding sites were blocked by incubation with blocking buffer consisting of HBSS containing 5% BSA (wt/vol) for 30 min at RT. Samples were incubated with antibodies diluted in blocking buffer at varying concentrations for 2 hrs at RT. Finally, cells were washed with HBSS and fixed again with 4% PFA for 10 min at RT to avoid unbinding of antibodies during dSTORM measurements 23 . Soft Lithography Microstructured surfaces were made following a protocol adapted from Schwarzenbacher et al. 24 . Polydimethylsiloxan- (PDMS-) based polymers with 200 nm pillars (EV Group) were incubated with 50 μg ml -1 streptavidin in PBS for 15 min and dried with N 2 . Immediately after drying, the stamp was placed onto a plasma-cleaned glass coverslip (Menzel Gläser, Cover Slips #1) and incubated for 60 min. After removal of the stamp, the coverslip was incubated with biotinylated mouse IgG for 15 min at a concentration of 10 μg ml -1 in PBS with 1% BSA (wt/vol) and washed extensively with PBS. Finally, AF647-conjugated goat anti-mouse antibody was titrated at different concentrations, incubated for 15 min and washed with PBS. All steps were performed at RT.
Microscopy setup
All experiments were performed on a modified Zeiss Axiovert 200 inverted microscope equipped with a 100 × oil-immersion objective (Zeiss Apochromat NA1.46). The setup was equipped with a 640 nm diode laser (Toptica iBeam smart 200 mW), a 532 nm diode-pumped solid state (DPSS) laser (Spectra physics Millennia 6s) and a near UV light 405 nm ion laser (Coherent Innova 90C). Intensity modulation and timings were controlled either directly or with an acousto-optic modulator (AOM) using custom-written Labview software. Laser lines were overlaid with an OBIS Galaxy beam combiner (Coherent). Emission light was filtered using appropriate filter sets (Chroma) and recorded on an IXON DU 897-DV EM-CCD camera (Andor). Multi-color imaging was performed using an emission light splitter (Optosplit; Cairn Research) adapted to the spectral characteristics of the used fluorophores. Total internal reflection fluorescence (TIRF) illumination was achieved by shifting the excitation beam in parallel to the optical axis with a mirror mounted on a motorized movable table. For ratiometric Fura-2 imaging, we used a polychromatic Xenon light source combined with a monochromator (polychrome V; TILL photonics) that provided light at 340 nm and 380 nm. Ratiometric Ca 2+ measurements T cell activation was quantified with Fura-2-AM. Cells were incubated with 5 μg ml -1 Fura-2-AM in supplemented RPMI medium for 15 min at RT, washed twice in imaging buffer and kept on ice until imaging. For each experiment, cells were resuspended in imaging buffer at 5×10 7 cells/ml and 5 μl were deposited close to the surface of an imaging chamber, which was mounted on the microscope at RT. Image acquisition began immediately, recording 1,000 frames at 1 Hz. Image stacks were processed and analyzed using ImageJ.
Quantitative antibody binding assay
In order to quantify the degree of antibody binding, we labeled fixed and permeabilized cells labeled with different concentrations of AF647-conjugated antibodies. Antibody binding was measured as mean fluorescence per pixel under TIRF illumination using the 640 nm laser line. For each dilution step 15-20 cells were imaged. Average background-corrected fluorescence values were fitted to the equation [AB] = [B] · [A max ] / (K d + [B]) assuming first order binding, where [AB] denotes the surface density of bound antibody, [B] is the antibody concentration in solution, [A max ] stands for the fitted total surface density of antibody binding sites and K d is the dissociation constant.
Superresolution microscopy and image reconstruction
PALM experiments were carried out in imaging buffer. For excitation of mEOS3.2 we used the 532 nm laser line. The 405 nm laser constantly illuminated the sample in order to continuously switch new molecules. For dSTORM measurements, we used previously published switching buffer conditions optimized for AF647 23 : PBS (pH 7.4) was supplemented with 10% glucose, 0.5 mg ml -1 glucose oxidase, 40 μg ml -1 catalase and 50 mM cysteamine. In dSTORM experiments with AF647, the majority of fluorophores was first transferred into a non-fluorescent dark state using high power 640 nm laser illumination. Then, single molecules were imaged at 640 nm excitation at lower power, keeping the 405 nm laser continuously on in order to switch molecules back to a fluorescent state. Both PALM and dSTORM images were recorded as stacks of 10,000 frames at 100 Hz. Stroboscopic illumination protocols were applied with 3 ms illumination time and 7 ms delay between consecutive images. Single molecule signal localization and image reconstruction was carried out with the open-source ImageJ plugin ThunderSTORM 25 . Stringent post-processing parameters were chosen to discard signals with low localization precision. On average, we obtained localization errors of σ = 20 nm for AF647 and σ = 30 nm for mEOS3.2. Merging of localizations was performed with a grouping radius adjusted to the average localization precision of the respective fluorophores. If not specified otherwise, we used 50 frames off-time. No drift correction was applied. Ripley’s K analysis 26 was carried out using custom-written Matlab code.
Quantitative cluster analysis
Clusters were identified using custom-written Matlab code ( Supplementary Software ). Each localization within a region of interest was represented by a 2D Gaussian function with fixed σ = 35 nm, centered at the recorded position. By summing up the Gaussian peaks, localizations in close proximity to each other resulted in higher peaks than well separated localizations ( Supplementary Fig. 2a ). Binary cluster masks were obtained by applying a threshold (thr = 2.5) that was chosen after visual inspection of cluster masks at different thresholds ( Supplementary Fig. 2c ). The cluster masks were then used to classify localizations as clustered or not-clustered. To reduce the overestimation of cluster sizes, 2D Gaussians were set to zero beyond a radius of 2σ ( Supplementary Fig. 2b ). Finally, the total cluster area (A in ) within the region of interest (A), as well as the number of localizations inside (# in ) and outside of clusters (# out ) was determined. This allowed us to calculate the density of localizations per cluster area (ρ = # in /A in ) and the relative clustered area per image (η = A in /A). Simulation of randomly distributed molecules Molecules were distributed randomly as xy coordinates on a 12,800 × 12,800 nm sized image. Each molecule was assumed to yield multiple localizations due to blinking with an average of seven observations per molecule drawn from an exponential distribution. Localizations were scattered around the xy position of each molecule, following a 2D Gaussian probability distribution defined by σ = 40 nm. To account for variations in the labeling density, we simulated different numbers of molecules over a broad range, keeping all other parameters constant. Random noise consisting of 300 randomly distributed single localizations was also included in each image. In Supplementary Figure 3 , we varied the blinking statistics and the analysis threshold. In Supplementary Figure 4a and b , we tested the effect of residual diffusion of molecules during image acquisition. To simulate single molecule trajectories, we assumed a diffusion coefficient D = 1.1 × 10 -5 μm² s -1 (determined experimentally for Lck-mEOS3.2 in fixed JCaM1.6 cells, not shown) as well as a specified image acquisition rate and total number of recorded frames. Localizations were then randomly distributed along each trajectory, using the blinking statistics and the localization errors as above. Finally, in Supplementary Figure 4c and d we included the indicated small fractions of molecules with different blinking statistics of 100 localizations per molecule on average (exponentially distributed). Determination of the standard curve for randomly distributed localizations and ρ 0 We simulated data for randomly distributed molecules under different conditions (variations in blinking statistics and thresholds, see Supplementary Figure 3 ). Each data set could be fitted well with a polynomial of the form ρ = ρ 0 (1 + α · η b ) with constant α = 1.4 and b = 4; ρ 0 turned out to depend on various imaging and analysis parameters. We normalized the data sets with respect to ρ 0 , yielding the average reference curve for randomly distributed localizations ρ/ρ 0 = 1 + 1.4 · η 4 . Clustered distributions could also be fitted well with this polynomial, albeit with different values for α and b. We hence used such fits for determining ρ 0 in all simulations and experiments, which ultimately allowed for plotting ρ/ρ 0 versus η. Simulation of clustered molecules To simulate clusters, molecules were placed randomly according to a uniform distribution within circles around cluster centers, which themselves were distributed uniformly within the field of view. The number of molecules per cluster was varied following a normal distribution with a standard deviation of 33% of the mean number of molecules per cluster. Additionally, we added molecules that were uniformly distributed over the whole field of view (25% of the total number of clustered molecules), in order to account for unspecific binders or monomeric blinking molecules. All simulated molecules followed the same blinking statistics (average of seven localizations per molecule). Random noise consisting of 300 uniformly distributed single localizations was further included in each image. In order to account for variations in the labeling density, we simulated different numbers of molecules per cluster over a broad range, keeping all other parameters constant. Simulation of pentamers Pentamers were simulated as randomly distributed 5-mer centers. Each pentamer center was filled with n molecules following a binomial distribution with the probability p. Hence, p corresponds to the labeling efficiency in a titration experiment. As in the other simulations, each molecule was assumed to yield multiple localizations due to blinking with an average of seven observations per molecule drawn from an exponential distribution. Random noise consisting of 300 randomly distributed single localizations was also included in each image. Additionally, we added different amounts of molecules that were uniformly distributed over the whole field of view, in order to account for unspecific binders or monomeric blinking molecules. For all simulations of small oligomers, the total number of molecules was kept constant (50 μm -2 ), only p was varied.
📊 Figures
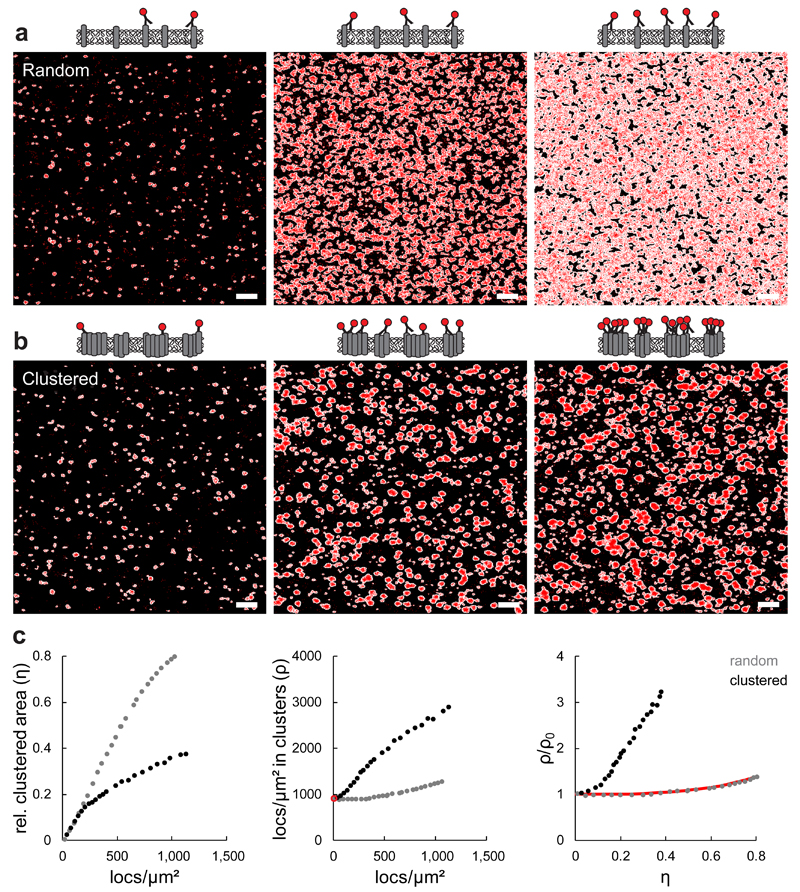
Figure 1
Effect of label density variation on randomly distributed versus clustered molecules.
( a, b ) Simulations of increasing numbers of randomly distributed ( a ) and clustered molecules ( b ), each yielding an average of seven localizations per molecule (red); the calculated cluster masks...
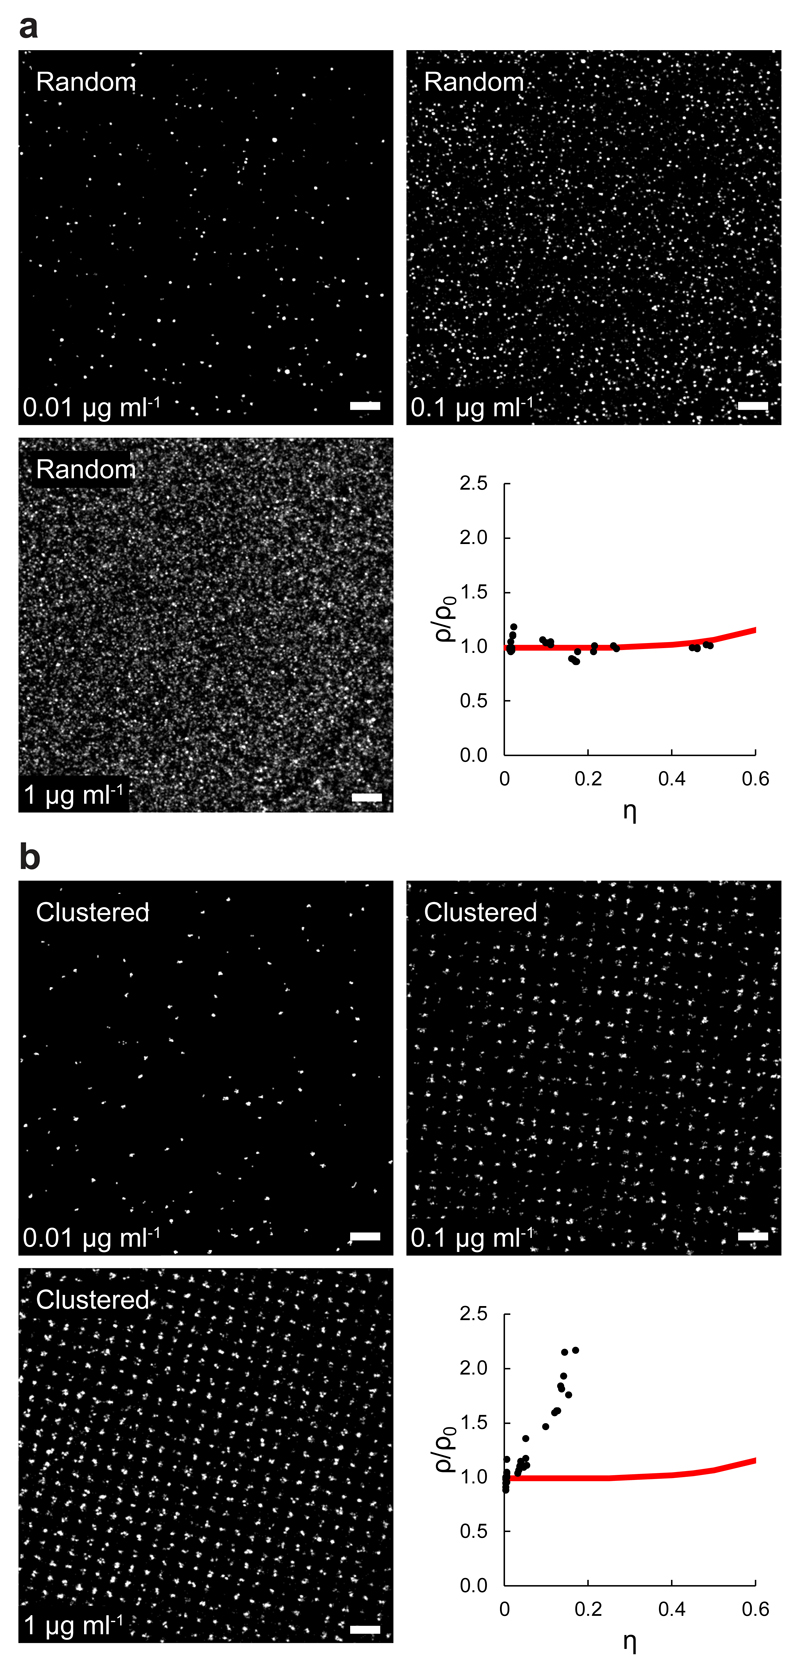
Figure 2
Label density variation of randomly distributed and clustered proteins on synthetic surfaces.
Streptavidin was adsorbed to glass surfaces either randomly ( a ) or as 200 nm-sized clusters via microcontact printing ( b ), and incubated with biotinylated murine IgG. The images show a titration s...
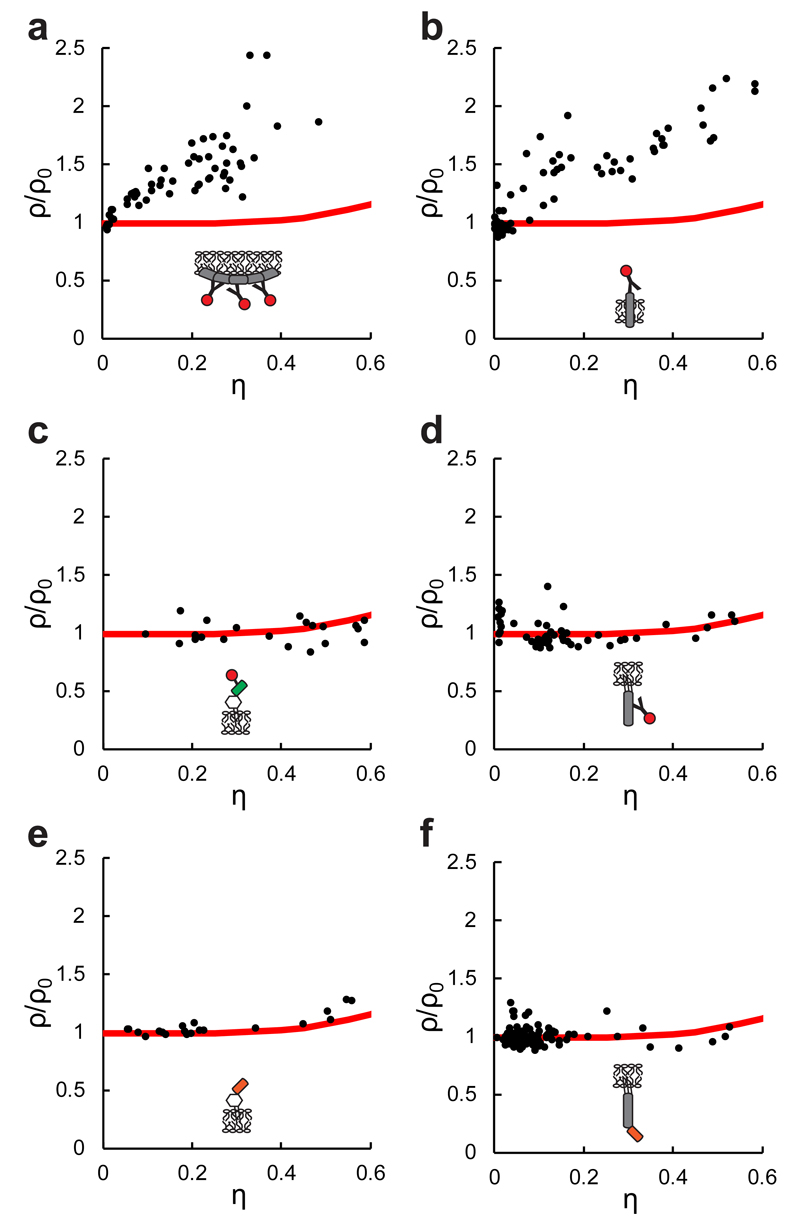
Figure 3
Cluster analysis of different proteins in the cellular plasma membrane.
Label density variation for different membrane proteins yielded characteristic normalized u03c1/u03b7 curves for each protein. ( a-d ) Cells were stained at different label concentrations and imaged v...
Figure images are served from the NIH/NLM PubMed Central Open Access Subset or Europe PMC; copyright remains with the publishers and authors.
💬 Discussion
0 commentsNo comments yet. Be the first to start a discussion!
Leave a Comment