Abstract
Lamella micromachining by focused ion beam milling at cryogenic temperature (cryo-FIB) has matured into a preparation method widely used for cellular cryo-electron tomography. Due to the limited ablation rates of low Ga + ion beam currents required to maintain the structural integrity of vitreous specimens, common preparation protocols are time-consuming and labor intensive. The improved stability of new-generation cryo-FIB instruments now enables automated operations. Here, we present an open-source software tool, SerialFIB, for creating automated and customizable cryo-FIB preparation protocols. The software encompasses a graphical user interface for easy execution of routine lamellae preparations, a scripting module compatible with available Python packages, and interfaces with three-dimensional correlative light and electron microscopy (CLEM) tools. SerialFIB enables the streamlining of advanced cryo-FIB protocols such as multi-modal imaging, CLEM-guided lamella preparation and in situ lamella lift-out procedures. Our software therefore provides a foundation for further development of advanced cryogenic imaging and sample preparation protocols.
🔬 Techniques
🔭 Microscopes
🧬 Organisms
💻 Software
✨ Fluorophores
🧪 Sample Preparation
🔬 Cell Lines
🏭 Microscope Brands
🧪 Reagent Suppliers
📷 Detectors
💻 Software Details
💻 Code & Software
💾 Data Repositories
🏷️ Research Resource Identifiers (RRIDs)
Verified research resources used in this paper:
🏛️ Research Organizations (ROR)
Affiliated research institutions:
📋 Methods
Key resources table
Reagent type (species) or resource Designation Source or reference Identifiers Additional information Cell line( Homo sapiens ) HeLa Kyoto Hyman Lab, MPI-CBG RRID: CVCL_1922 Cell line( H. sapiens ) Sum159 Walter and Farese Lab, Harvard T.H. Chan School of Public Health RRID: CVCL_5423 Strain, strain background ( Saccharomyces cerevisiae ) Ede1-eGFP Wilfling lab, MPI for Biophysics FWY0153 MATα, his3-Δ200, leu2-3,2-112, lys2- 801, trp1-1(am), ura3-52, yap1801Δ::kanMX4, yap1802Δ::hphNT1, apl3Δ::HIS3MX6, Ede1::EGFP::TRP1, atg15Δ::natNT2, atg19Δ::URA3 Strain, strain background ( Emiliania huxleyi ) Eh1 Vardi Lab, Weizmann Institute of Science Isolated in June 2018 at Espegrend, Norway Strain, strain background ( Chlamydomonas reinhardtii ) mat3-4 Chlamydomonas Resource Center, University of Minnesota, MN CC-3994 Strain, strain background ( C. reinhardtii ) CW15 Chlamydomonas Resource Center, University of Minnesota, MN CC-400 Reference cell-wall deficient WT strain of Chlamydomonas Genetic reagent ( Drosophila melanogaster ) sqh-mCherry Blooming ton Drosophila Stock Center FLYB: FBst0059024 FlyBase genotype: w*; P{sqh-mCherry.M}3 Other BODIPY 558/568C12 Thermo Fisher Scientific D3835 Lipid droplet live stain (1:2000) Other Mito Tracker Green(490/516) Thermo Fisher Scientific M7514 Mitochondria live stain (1:2000) Other Carboxylate-Modified Microspheres, 1.0 µm, crimson fluorescent (625/645) Thermo Fisher scientific F8816 Fluorescence bead fiducials for 3D correlation (1:30) Software, algorithm SerialFIB https://github.com/sklumpe/SerialFIB (copy archived at swh:1:rev:0eaaaf66afa2d803440cea18af85c444df10478f , Klumpe, 2021 ) This study Software, algorithm AutoScript4 Thermo Fisher Scientific https://www.thermofisher.com/de/de/home/electron-microscopy/products/software-em-3d-vis/autoscript-4-software.html Software, algorithm LAS X Leica Microsystems https://www.leica-microsystems.com/products/microscope-software/p/leica-las-x-ls/ Software, algorithm Fiji https://imagej.net/software/fiji/ Software, algorithm 3DCT https://3dct.semper.space/index.html Software, algorithm SerialEM https://bio3d.colorado.edu/SerialEM/ Software, algorithm Warp http://www.warpem.com/warp/ Software, algorithm TOMOMAN https://github.com/williamnwan/TOMOMAN Software, algorithm MotionCorr2 https://emcore.ucsf.edu/ucsf-software Software, algorithm NovaCTF Turoňová et al., 2017b Software, algorithm CTFFIND4 https://grigoriefflab.umassmed.edu/ctffind4 Software, algorithm IMOD https://bio3d.colorado.edu/imod Software, algorithm pyTOM https://pytom.sites.uu.nl/ Software, algorithm RELION https://www3.mrc-lmb.cam.ac.uk/relion/index.php/Main_Page Software, algorithm STOPGAP Wan, 2020 Software, algorithm UCSF ChimeraX https://www.rbvi.ucsf.edu/chimerax/ Other Cryo-Gripper Kleindiek Nanotechnik https://www.nanotechnik.com/cryoliftout.html Mammalian cell culture and cryo-grid preparation HeLa Kyoto cells were cultured in DMEM (Thermo Fisher Scientific), supplemented with 10% (v/v) fetal bovine Serum (FBS; Biochrom) and 100 mg/mL penicillin-streptomycin (Thermo Fisher Scientific). Sum159 cells were cultured in DMEM/F12, glutaMAX media (Life Technology) supplemented with 5% FBS, 1 μg/mL hydrocortisone (Sigma), 5 µg/mL insulin (Cell Applications), 10 mM HEPES (pH 7.4), and 100 mg/mL penicillin-streptomycin (Thermo Fisher Scientific). Cells were maintained in TC-25 flasks (Thermo Fisher Scientific) at 37°C under 5% CO 2 . Both lines tested negative for Mycoplasma by PCR (Eurofins Genomics). For EM grid seeding, cells at 60–70% confluence were treated with 0.05% trypsin-EDTA (Fisher Scientific) for 2 min at 37°C, resuspended in 1 mL media, passed through a 35 µm mesh Cell Strainer Snap Cap (Corning), and counted. 200,000 cells were seeded into a 35 mm ibidi dish (ibidi) containing up to eight micropatterned EM grids and 2 mL media, to reach an average surface density of 2 × 10 4 cells/cm 2 . Gold or titanium grids, 200 mesh, with 12-nm-thick holey R1/4 and R1.2/20 SiO 2 film (Quantifoil) were used for the experiments. Grids were passivated, micropatterned, and fibronectin-treated according to Toro-Nahuelpan et al., 2020 . Grids were incubated for 2 hr with HeLa cells or 1 hr with Sum159 cells at 37°C under 5% CO 2 , and then transferred to a new dish with media for further incubation. Grids were plunge-frozen into liquid ethane at –185°C 4–18 hr post-transfer, depending on the desired cell density per square. Plunge-freezing was performed with a Leica GP EM at 37°C and 75% humidity, and 1 s blot time for all grid types. For correlative experiments, grids were incubated with MitoTracker Green FM (Thermo Fisher Scientific) and BODIPY 558/568 (Thermo Fisher Scientific) at 1:2000 dilutions for 20 min prior to plunge freezing. With the grid mounted on the plunger, 4 µL Crimson Microspheres, 1.0 µm in diameter (Thermo Fisher Scientific), diluted 1:30 in PBS, were applied to the grid from the side containing cells.
Show full methods section
Key resources table
Reagent type (species) or resource Designation Source or reference Identifiers Additional information Cell line( Homo sapiens ) HeLa Kyoto Hyman Lab, MPI-CBG RRID: CVCL_1922 Cell line( H. sapiens ) Sum159 Walter and Farese Lab, Harvard T.H. Chan School of Public Health RRID: CVCL_5423 Strain, strain background ( Saccharomyces cerevisiae ) Ede1-eGFP Wilfling lab, MPI for Biophysics FWY0153 MATα, his3-Δ200, leu2-3,2-112, lys2- 801, trp1-1(am), ura3-52, yap1801Δ::kanMX4, yap1802Δ::hphNT1, apl3Δ::HIS3MX6, Ede1::EGFP::TRP1, atg15Δ::natNT2, atg19Δ::URA3 Strain, strain background ( Emiliania huxleyi ) Eh1 Vardi Lab, Weizmann Institute of Science Isolated in June 2018 at Espegrend, Norway Strain, strain background ( Chlamydomonas reinhardtii ) mat3-4 Chlamydomonas Resource Center, University of Minnesota, MN CC-3994 Strain, strain background ( C. reinhardtii ) CW15 Chlamydomonas Resource Center, University of Minnesota, MN CC-400 Reference cell-wall deficient WT strain of Chlamydomonas Genetic reagent ( Drosophila melanogaster ) sqh-mCherry Blooming ton Drosophila Stock Center FLYB: FBst0059024 FlyBase genotype: w*; P{sqh-mCherry.M}3 Other BODIPY 558/568C12 Thermo Fisher Scientific D3835 Lipid droplet live stain (1:2000) Other Mito Tracker Green(490/516) Thermo Fisher Scientific M7514 Mitochondria live stain (1:2000) Other Carboxylate-Modified Microspheres, 1.0 µm, crimson fluorescent (625/645) Thermo Fisher scientific F8816 Fluorescence bead fiducials for 3D correlation (1:30) Software, algorithm SerialFIB https://github.com/sklumpe/SerialFIB (copy archived at swh:1:rev:0eaaaf66afa2d803440cea18af85c444df10478f , Klumpe, 2021 ) This study Software, algorithm AutoScript4 Thermo Fisher Scientific https://www.thermofisher.com/de/de/home/electron-microscopy/products/software-em-3d-vis/autoscript-4-software.html Software, algorithm LAS X Leica Microsystems https://www.leica-microsystems.com/products/microscope-software/p/leica-las-x-ls/ Software, algorithm Fiji https://imagej.net/software/fiji/ Software, algorithm 3DCT https://3dct.semper.space/index.html Software, algorithm SerialEM https://bio3d.colorado.edu/SerialEM/ Software, algorithm Warp http://www.warpem.com/warp/ Software, algorithm TOMOMAN https://github.com/williamnwan/TOMOMAN Software, algorithm MotionCorr2 https://emcore.ucsf.edu/ucsf-software Software, algorithm NovaCTF Turoňová et al., 2017b Software, algorithm CTFFIND4 https://grigoriefflab.umassmed.edu/ctffind4 Software, algorithm IMOD https://bio3d.colorado.edu/imod Software, algorithm pyTOM https://pytom.sites.uu.nl/ Software, algorithm RELION https://www3.mrc-lmb.cam.ac.uk/relion/index.php/Main_Page Software, algorithm STOPGAP Wan, 2020 Software, algorithm UCSF ChimeraX https://www.rbvi.ucsf.edu/chimerax/ Other Cryo-Gripper Kleindiek Nanotechnik https://www.nanotechnik.com/cryoliftout.html Mammalian cell culture and cryo-grid preparation HeLa Kyoto cells were cultured in DMEM (Thermo Fisher Scientific), supplemented with 10% (v/v) fetal bovine Serum (FBS; Biochrom) and 100 mg/mL penicillin-streptomycin (Thermo Fisher Scientific). Sum159 cells were cultured in DMEM/F12, glutaMAX media (Life Technology) supplemented with 5% FBS, 1 μg/mL hydrocortisone (Sigma), 5 µg/mL insulin (Cell Applications), 10 mM HEPES (pH 7.4), and 100 mg/mL penicillin-streptomycin (Thermo Fisher Scientific). Cells were maintained in TC-25 flasks (Thermo Fisher Scientific) at 37°C under 5% CO 2 . Both lines tested negative for Mycoplasma by PCR (Eurofins Genomics). For EM grid seeding, cells at 60–70% confluence were treated with 0.05% trypsin-EDTA (Fisher Scientific) for 2 min at 37°C, resuspended in 1 mL media, passed through a 35 µm mesh Cell Strainer Snap Cap (Corning), and counted. 200,000 cells were seeded into a 35 mm ibidi dish (ibidi) containing up to eight micropatterned EM grids and 2 mL media, to reach an average surface density of 2 × 10 4 cells/cm 2 . Gold or titanium grids, 200 mesh, with 12-nm-thick holey R1/4 and R1.2/20 SiO 2 film (Quantifoil) were used for the experiments. Grids were passivated, micropatterned, and fibronectin-treated according to Toro-Nahuelpan et al., 2020 . Grids were incubated for 2 hr with HeLa cells or 1 hr with Sum159 cells at 37°C under 5% CO 2 , and then transferred to a new dish with media for further incubation. Grids were plunge-frozen into liquid ethane at –185°C 4–18 hr post-transfer, depending on the desired cell density per square. Plunge-freezing was performed with a Leica GP EM at 37°C and 75% humidity, and 1 s blot time for all grid types. For correlative experiments, grids were incubated with MitoTracker Green FM (Thermo Fisher Scientific) and BODIPY 558/568 (Thermo Fisher Scientific) at 1:2000 dilutions for 20 min prior to plunge freezing. With the grid mounted on the plunger, 4 µL Crimson Microspheres, 1.0 µm in diameter (Thermo Fisher Scientific), diluted 1:30 in PBS, were applied to the grid from the side containing cells.
Coccolithophore cryo-grid preparation
E. huxleyi strain Eh1 was isolated at the Espegrend Marine Research Field Station, Norway, and provided by Prof. Assaf Vardi from the Weizmann Institute of Science. Cells were grown in artificial seawater, supplemented with f/2 nutrient recipe to late exponential phase, under 16 hr/8 hr light/dark cycles at 18°C. In order to induce calcification, the external mineral coccolith shell was removed by treating with 20 mM EDTA at pH 8. The de-calcified cells were moved to a calcium-depleted medium (100 μM Ca 2+ ) for 12 hr. Then Ca 2+ was supplemented to the normal seawater level of 10 mM. This lag time in a calcium-depleted medium allowed the cells to resume mineralization in a synchronized fashion upon Ca 2+ repletion. Cells were centrifuged 3 hr after re-calcification at 2000 × g for 3 min to increase their concentration for plunge freezing. A volume of 4 µL cell suspension at a concentration of 3.07–3.5 × 10 7 cells/ml was directly applied to glow-discharged holey carbon R2/1 Cu 200 mesh grids (Quantifoil). After 5 s back-side blotting, plunge-freezing was carried out with a Leica GP EM at 18°C and 90% humidity.
Budding yeast cryo-grid preparation
The yeast strain used was S. cerevisiae ∆YAP1801 ∆YAP1802 ∆APL3 EDE1-eGFP ∆ATG15 ∆ATG19. Yeast cultures were inoculated from overnight cultures started from colonies and grown in YPD media at 30°C to an OD 600 of 0.8. For grid preparation, 4 µL of cell suspension was applied to holey carbon R2/1 Cu grids (Quantifoil) and plunge-frozen on a Vitrobot Mark IV (Thermo Fisher Scientific) at blot force of 10, blotting time of 10 s, temperature 30°C, and humidity of 90%.
Chlamydomonas cryo-grid preparation
C. reinhardtii mat3-4 and CW15 strains were grown with 100 rpm agitation in Tris-Acetate-phosphate Medium (TAP Medium) at room temperature and normal atmosphere under continuous illumination (40 µE white light). Log phase cultures were centrifuged at 2000 × g for 2 min to concentrate the cells 10 times and 4 µL was directly applied to a glow-discharged holey carbon R2/1 Cu 200 mesh grid (Quantifoil). Plunge-freezing was performed using a VitroBot Mark 4 (Thermo Fisher Scientific) with Teflon sheets on both sides and blotting from the back. Blotting time was 10 s with a blotting force of 10 at 90% humidity.
Cryo-FIB lamella preparation
Lamellae were prepared as described in Schaffer et al., 2017 on a dedicated Aquilos dual-beam (FIB-SEM) microscope equipped with a cryo-transfer system and a cryo-stage (Thermo Fisher Scientific). The AutoScript 4 software is commercially available from Thermo Fisher Scientific. Cryo-grids with plunge-frozen cells were clipped into autogrids modified with a cut-out for FIB milling, mounted on a shuttle with a 45° pre-tilt (Thermo Fisher Scientific), and transferred into the dual-beam microscope. During FIB operation, samples were kept in high vacuum ( 13 µm for Sum159, and 25.9 µm × 6.2 µm × > 16 µm for HeLa. C. reinhardtii cells were imaged at 3 kV and 13 pA with a dwell time of 0.25 µs, line integration of 64, at a pixel size of 3.4 nm, and 6144 × 4,096 resolution, corresponding to a dose of 1.12 e/Å 2 per image, using the ETD, as well as T1 and T2 in-lens detectors. A stage potential was applied in the OptiPlan mode. Milling was performed at 30 kV and 0.3 nA for 60 s with slices of 50 nm. For volume image analysis, the SEM stack was cropped to the size of the milled area using Fiji ( Schindelin et al., 2012 ). Curtaining from ion beam milling was reduced by wavelet decomposition and Gaussian blurring of the vertical component (sigma = 6) using pywt ( Spehner et al., 2020 ). Charging was compensated by Gaussian blurring (sigma = 35) and subsequent image erosion in two steps to create a mask for image subtraction. The script to perform these tasks is available on the GitHub repository (see ‘Data availability’). Image contrast was further enhanced by limited adaptive histogram equalization in Fiji (CLAHE, Zuiderveld, 2014 ) with a slope of 3 pixels resulting in restoration of details. Images were aligned using the SIFT algorithm in Fiji ( Schindelin et al., 2012 ) and stretched in Y by a factor of 1/sin 52° to compensate for foreshortening due to the angle between ion and electron beams. Segmentations were prepared manually in Amira 2020.2 (Thermo Fischer Scientific). For point-based registration between FIB-SEM and cryo-FLM volumes, centroids of segmented lipid droplets and beads were extracted by connected-component labeling in MATLAB (MathWorks), and by iterative 1D and 2D Gaussian fitting in 3DCT as described ( Arnold et al., 2016 ), respectively. Points were matched in 3DCT using a 2D projection of the segmentation. To avoid local minima, the affine transform relating FLM points to FIB-SEM points was fitted multiple times in Python using (1) the RANSAC approach implemented in OpenCV; (2) L-BFGS-B-based local minimization with different starting positions generated by the TEASER algorithm ( Heng et al., 2020 ); and (3) basin-hopping coupled with L-BFGS-B-based local minimization. The FLM volumes were transformed according to the affine transform and superposed with the FIB-SEM volume in Amira for visualization. Python scripts for the affine registration and volume transformation are available on GitHub (see ‘Data availability’). Cryo-FLM volumes for the HeLa cells were acquired with a voxel size of 110 × 110 × 342 nm prior to volume imaging.
Fly husbandry
D. melanogaster w[*]; P{w[+ mC]=sqh-mCherry.M}3 (FlyBase ID: FBst0059024; Martin et al., 2008 ), expressing an mCherry-tagged Sqh protein (myosin regulatory light chain) under the control of the sqh endogenous promoter, were obtained from the Bloomington Drosophila Stock Center (BL-59024) and maintained at 22°C on standard cornmeal agar. Flies were transferred into a fresh vial supplemented with yeast paste 24 h prior to dissection of egg chambers for HPF. HPF and cryo-FIB lift-out D. melanogaster egg chambers were dissected from ovaries in Schneider’s medium and HPF (HPM010, Abrafluid) in the 100 µm cavity of gold-coated copper Type A carriers (Engineering office M. Wohlwend) using Schneider’s medium containing 20% Ficoll (70 kDa) as filling medium. HPF carriers were soaked in hexadecene and blotted on filter paper prior to freezing. Cryo-planing of approximately 40 µm of the surface was performed in a cryo-microtome (EM UC6/FC6 cryo-microtome, Leica Microsystems) using a 45° diamond trimming knife with a clearance angle of 6° (DiAtome). The sample was glued to a custom 3D-printed shuttle after the Leica design ( Kuba et al., 2021 ) using cryo-glue (2:3 ethanol:isopropanol mixture) for cryo-confocal imaging with a Leica TCS SP8 equipped with Leica EM cryo-CLEM stage. Imaging was performed using a HC PL APO ×50/0.9 DRY objective in fluorescence mode using a 552 nm excitation laser at 17% total laser strength and 488 nm excitation at 6.8% total laser strength, corresponding to roughly 0.94 mW and 0.38 mW, respectively (based on measured laser intensity values). Detection channels were 650–751 for mCherry and 495–545 nm for autofluorescence using HyD detectors at a pinhole size of 2 Airy units. Z-stacks of 38 µm from the surface were collected using a step size of 1 µm. Fluorescence signal decreased significantly with imaging depth. Targeting of positions for automated trench milling was based on the surface topology of the sample produced by the cryo-planing. Positions were chosen based on registration with cryo-FLM data in 3DCT, which allowed the identification of regions within the egg chamber. For lift-out experiments, an Aquilos dual-beam FIB-SEM microscope (Thermo Fisher Scientific) was equipped with a Kleindiek MM3A-EM micromanipulator and a cryo-gripper head (Kleindiek Nanotechnik) cooled by copper wires attached to the microscope anti-contaminator. Standard 45° pre-tilt shuttles were used for accommodating both HPF carrier and Auto-Grid clipped receiver grid on an Aquilos stage that was modified by removing ~2 mm of material of the stage using a file to allow the cryo-gripper to reach the sample surface. OmniProbe 4-post Cu half-grids were used as receiver grids (Plano EM). After specimen loading, platinum GIS deposition was performed for 10 s at 27°C with the GIS needle distance at a stage working distance of 10.6 mm. Samples were sputter coated with platinum in the chamber (10 mA, 15 s). For all trench milling steps and SerialFIB session setup, drift suppression using the SEM was applied to compensate positive charges brought in by FIB milling. The stage was rotated by 180° relative to loading position and tilted to 7° to orient the sample surface perpendicular to the FIB. Trench milling was performed with ‘regular cross-section patterns’ at 30 kV, 1 nA creating a C-shape using SerialFIB ( Figure 5 ). The milling included two patterns of 40 µm × 15 µm symmetrically arranged around a 20 µm block. Together with a third pattern, 10 µm × 40 µm was generated at an offset of 15 µm to the left and perpendicular to the previous two, yielding a 20 µm × 20 µm block for lift-out. Milling time per position was 30 min. In total, five positions were prepared, resulting in a milling preparation time of 2.5 hr. Undercuts were performed manually by tilting the stage to 43° and employing ‘cleaning cross-section’ patterns of 1 µm height, 22 µm width, and 15 µm depth at ~7 µm distance from the sample surface. Lift-out was performed with the microgripper oriented parallel to the FIB angle and perpendicular to the sample surface. The produced sample chunks were approached by the gripper. After contact of both tweezer arms with the sample, the chunk was milled loose from the bulk material with ‘regular cross-section patterns’ at 1 nA with a pattern of 20 µm in length, 1 µm in width until extraction from the bulk was possible. Subsequently, the microgripper was raised until it was ~400 µm above the sample surface. The stage was moved down by ~15 mm into safe distance from the gripper and subsequently moved to the receiver grid position while keeping the Z-height locked. Then, the stage was lifted to the appropriate Z-height of the receiver grid. The microgripper was moved to the post of the TEM half-grid until achieving contact of the sample. ‘Regular cross-section’ patterns at height of 2 µm and width of 6 µm were used to attach the sample to the post by re-deposition of the post material onto the sample. Subsequently, the gripper was opened, releasing the chunk that has been welded to the pin, and moved to a safe position. This is achieved by lifting the gripper until it is 400 µm above the sample surface and then moving the stage down by 15 mm, making enough room to safely move it to the park position. This procedure can be performed for all four pins. Finally, deposition of platinum GIS for 3 × 30 s in 3 min intervals at a stage working distance of 9 mm was used to strengthen the sample attachment to the pin. Lamella production was done manually with sequentially reduced FIB currents of 3 nA to 5 µm lamella thickness, 1 nA to 4 µm, 0.5 nA to 3 µm, 0.3 nA to 2 µm, and 0.1 nA to 1 µm using ‘regular cross-sections’ patterns. Subsequent fine milling was performed using ‘regular patterns’ at 0.1 nA to 600 nm and 50 pA to 200 nm. The FIB divergence was compensated by over- and under-tilts of 1° ( Schaffer et al., 2017 ). The lamella was milled until contrast started fading in SEM imaging at 3 kV, 13 pA.
Cryo-electron tomography
Cryo-ET data was acquired on a Titan Krios (Thermo Fisher Scientific) at 300 kV, equipped with a K2 Summit direct detection camera (Gatan) operating in dose fractionation mode and a Quantum post-column energy filter (Gatan). Autogrids containing lamellae were loaded such that the axis of the pre-tilt introduced by FIB milling was aligned perpendicular to the tilt axis of the microscope. At an EFTEM magnification of 42,000 and a resulting pixel size of 3.37 Å or 3.52 Å, up to 10 tilt series were collected on a single lamella in low-dose mode using SerialEM ( Mastronarde, 2005 ). Starting from the lamella pre-tilt, images were acquired at 2.5–4.5 µm underfocus, in 2° increments between ±62° using a dose-symmetric tilt scheme ( Hagen et al., 2017 ). The total dose was around 130 e - /Å 2 with a constant electron dose per tilt image. Tilt series of E. huxleyi , C. reinhardtii, and S. cerevisiae were collected with a 70 µm objective aperture. Tomograms of Sum159 and HeLa cells were acquired with a Volta phase plate (VPP, Thermo Fisher Scientific) with prior conditioning for 6 min.
Tomogram reconstruction
Data were preprocessed in Warp using movie frame alignment to compensate for beam-induced movement, CTF estimation, and tilt stack sorting ( Tegunov and Cramer, 2019 ) or TOMOMAN ( Wan, 2021 ), employing MotionCorr2 ( Zheng et al., 2017 ), NovaCTF ( Turoňová et al., 2017a ), and CTFFIND4 ( Rohou and Grigorieff, 2015 ). In etomo (IMOD software package; Mastronarde and Held, 2017 ), four times binned tilt images (movie sums) were aligned using patch tracking and tomograms reconstructed via weighted back projection.
Subtomogram analysis
Coordinates of ribosomes in Sum159 cells were determined in 4× binned tomograms by template matching utilizing the pyTOM toolbox ( Hrabe et al., 2012 ), using a down-sampled human 60S large ribosomal subunit (Gaussian filter with sigma 2, EMDB-2938) as a template and a spherical mask with 337 Å diameter. After manual selection, 4378 and 3380 ribosomal particles were localized in tomograms from standard on-grid FIB-milled lamellae (four tomograms) and lamellae prepared after FIB-SEM volume imaging (two tomograms), respectively. Subtomograms and corresponding CTF models were reconstructed in Warp with a box size of 140 px, a pixel size of 3.37 Å, and assuming a 350 Å particle diameter for normalization. Subtomogram alignment and averaging was performed in RELION (version 3.0.7, Zivanov et al., 2018 ). Particles from both datasets were pooled to generate an initial average via 3D classification into one class with the human 80S ribosome (EMDB-2938), low-pass-filtered to 60 Å, as reference. The resulting average was 3D-refined. Then, particles were regrouped based on their origin, that is, from standard FIB-milled lamellae or from lamellae prepared after FIB-SEM volume imaging. Both particle groups were refined separately starting from the alignments of the pooled average and its density as reference. Resolutions of the two final reconstructions were calculated via Fourier shell correlation (FSC) of two half-maps, and the reconstructions were filtered in the RELION postprocessing to their respective resolution (24 Å at 0.143 FSC; Figure 6 ). Figure 6.
Fourier shell correlation
(FSC) curves for ribosome subtomogram averages from ( A ) Sum159 cells, ( B ) Sum 159 cells after focused ion beam-scanning electron microscopy (FIB-SEM) volume imaging, and from ( C ) a D . melanogaster egg chamber. FSC threshold at 0.143 indicated by gray dotted line. Drosophila ribosomal particle positions were determined in 4× binned tomograms by template matching in STOPGAP using a down-sampled reference from a previously determined structure of the D. melanogaster ribosome (EMD-5591). In total, 20,284 ribosomal particles from eight tomograms were picked. Particles were extracted with a box size of 64 px, at a pixel size of 7.04 Å. Subsequent subtomogram alignment and averaging was performed in STOPGAP ( Wan et al., 2020 ). The resolution was calculated via Fourier shell cross-correlation of half-maps to be 24.0 Å (0.5 FSC) and 20.8 Å (0.143 FSC) ( Figure 6 ). Subtomogram averages were visualized with the UCSF ChimeraX package ( Pettersen et al., 2021 ). Python packages Implementations were done in Python3. Packages used in this work were numpy ( Harris et al., 2020 ), scipy ( Virtanen et al., 2020 ), scikit-image ( van der Walt et al., 2014 ), open-cv ( Bradski, 2000 ), tiffile ( Gohlke, 2021 ), psutil ( Rodola, 2020 ), ( PyQt5, 2021 ), pickle ( Van Rossum, 2020 ), and matplotlib ( Price-Whelan et al., 2018 ).
Additional files Supplementary file 1. Selected parameters for milling of micro-expansion joints, lamella rough, and fine milling of five different cell types. Supplementary file 2. Correlated lipid droplet positions post-milling and best-fitting fluorescence plane position in the y-direction of the focused ion beam (FIB) image relative to the observed lamella position. Transparent reporting form
📊 Figures
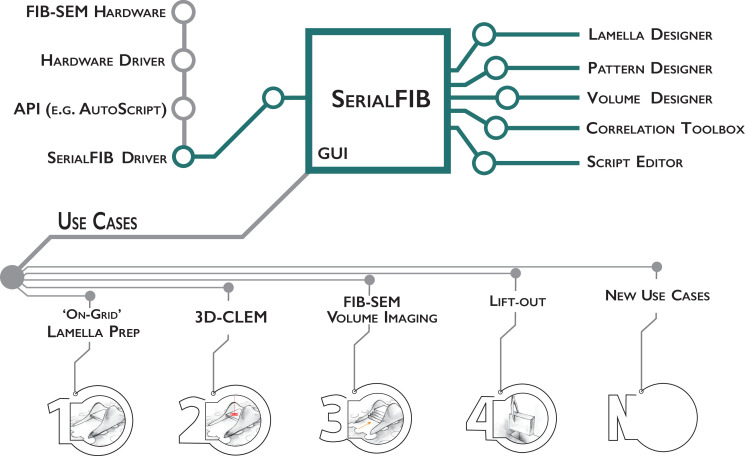
Figure 1.
Software architecture, modules, and use cases of SerialFIB.
Developments presented in this work are highlighted in green. The graphical user interface (GUI) is largely decoupled from instrument operations, which are controlled by the developed SerialFIB driver...
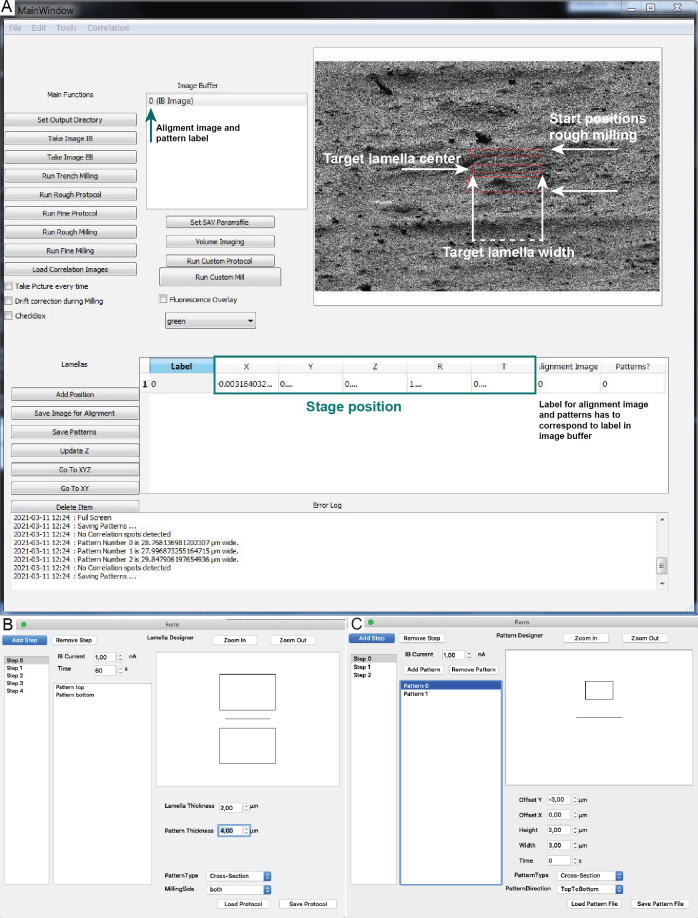
Figure 1u2014figure supplement 1.
Graphical user interface (GUI) for automated cryo-focused ion beam (cryo-FIB) protocols.
( A ) The GUI displays buttons for the main functions (imaging and several FIB milling procedures; left), the image buffer where reference images are selected and displayed in the alignment window to ...
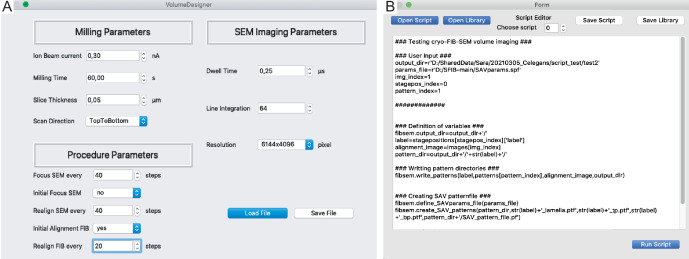
Figure 1u2014figure supplement 2.
SerialFIB interface for volume imaging and Script Editor.
( A ) In the Volume Designer, FIB-SEM volume imaging workflows can be constructed with user-definable FIB milling and SEM imaging parameters. ( B ) The Script Editor offers a scriptable interface for ...
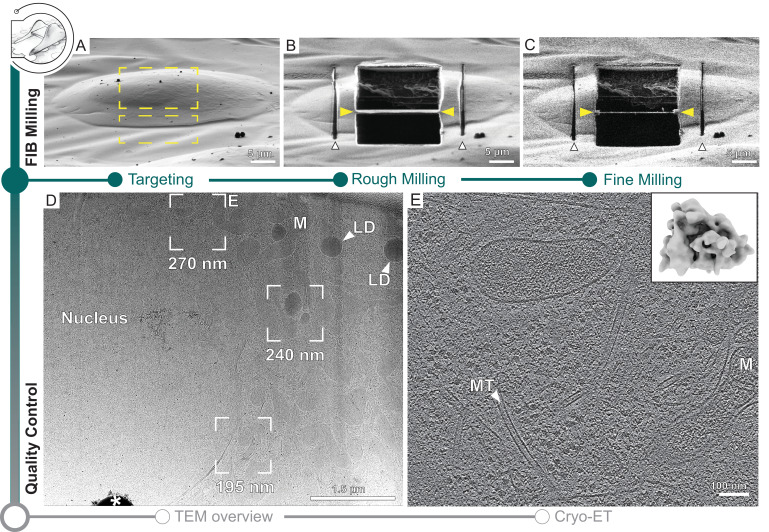
Figure 2.
Automated on-grid lamella preparation of Sum159 breast cancer cells.
( A ) Focused ion beam (FIB) image of a cell prior to lamella preparation. Yellow rectangles indicate milling patterns where material is subsequently removed. ( B ) Micro-expansion joints (white arrow...
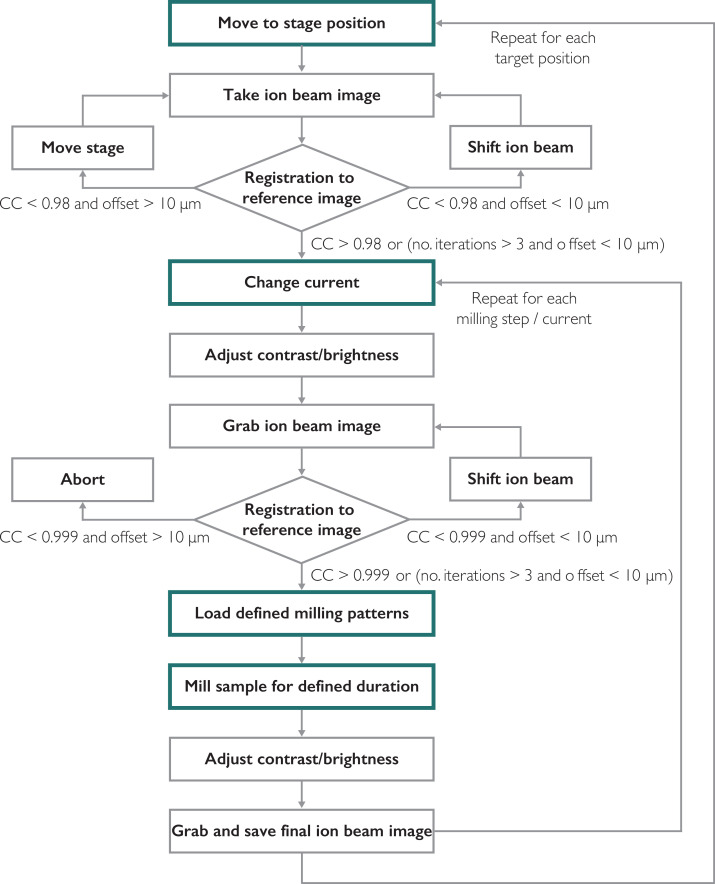
Figure 2u2014figure supplement 1.
Functions executed by SerialFIB for preparation of on-grid lamellae.
Main steps of the milling procedure are highlighted in green boxes. Gray boxes indicate subsequent steps performed by the software. Rhombus boxes indicate decision points for the image-based alignment...
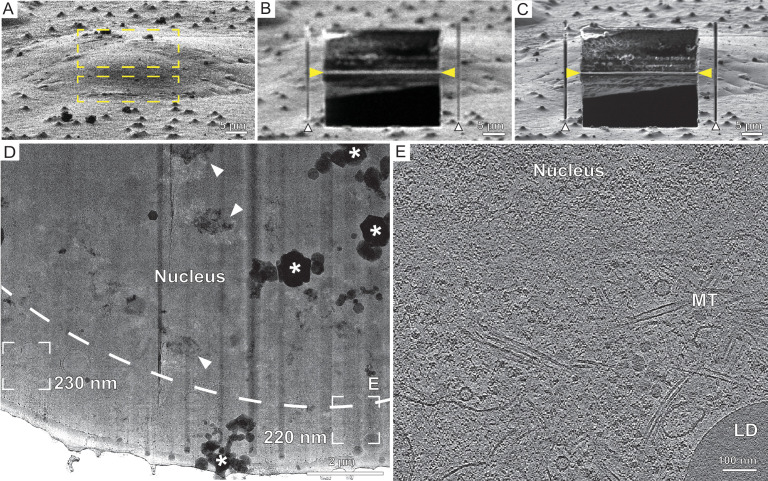
Figure 2u2014figure supplement 2.
Automated on-grid lamella preparation of HeLa cells.
( A ) Focused ion beam (FIB) image of a cell prior to lamella preparation. Yellow rectangles indicate milling patterns where material is subsequently removed. ( B ) Micro-expansion joints (white arrow...
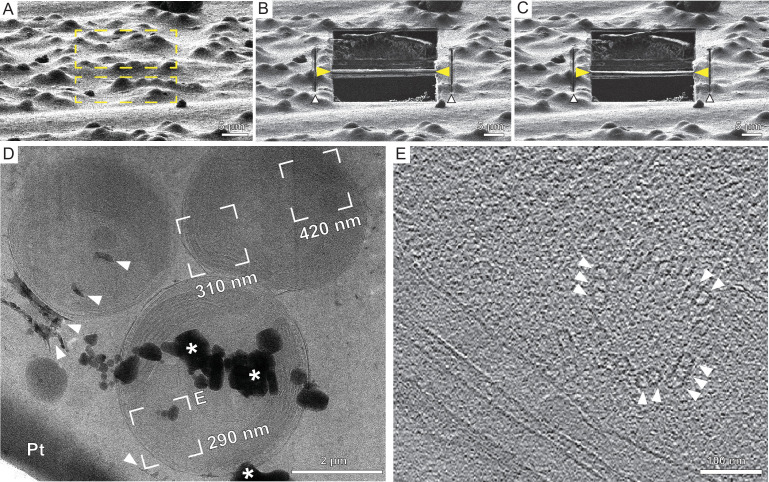
Figure 2u2014figure supplement 3.
Automated on-grid lamella preparation of E . huxleyi cells.
( A ) Focused ion beam (FIB) image of an agglomeration of cells prior to lamella preparation. Yellow rectangles indicate milling patterns where material is subsequently removed. ( B ) Micro-expansion ...
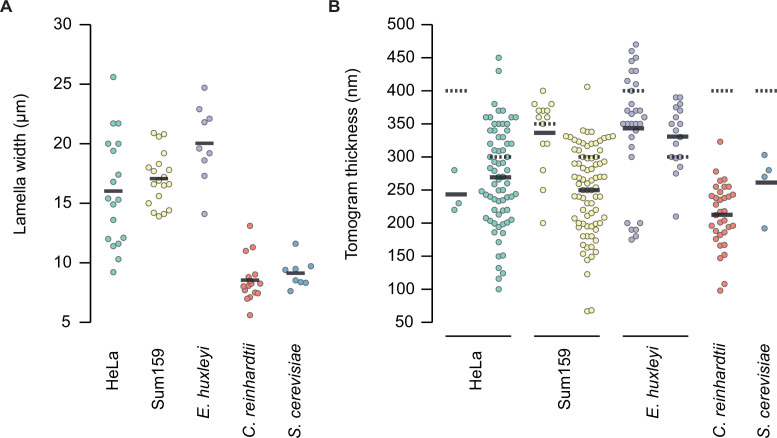
Figure 2u2014figure supplement 4.
Width ( A ) and thickness ( B ) of successfully prepared lamellae from five eukaryotic cell types.
Multiple tomograms were collected per lamella. Thicknesses were measured per tomogram. Solid line indicates the mean thickness; dotted line indicates the target thickness. Data represents lamellae pre...
Figure 2u2014video 1.
Tomographic volume of a Sum159 breast cancer cell related to Figure 2E depicting the cytosol with microtubules (MT) and a mitochondrion (Mito) next to the nucleus.
Figure 2u2014video 2.
Tomographic volume of a HeLa cell related to Figure 2u2014figure supplement 2E depicting the nuclear periphery, and the cytosol with microtubules (MT) and a lipid droplet (LD).
Figure 2u2014video 3.
Tomographic volume of E. huxleyi cells related to Figure 2u2014figure supplement 3E depicting the cytosol with the basal body of a cilium.
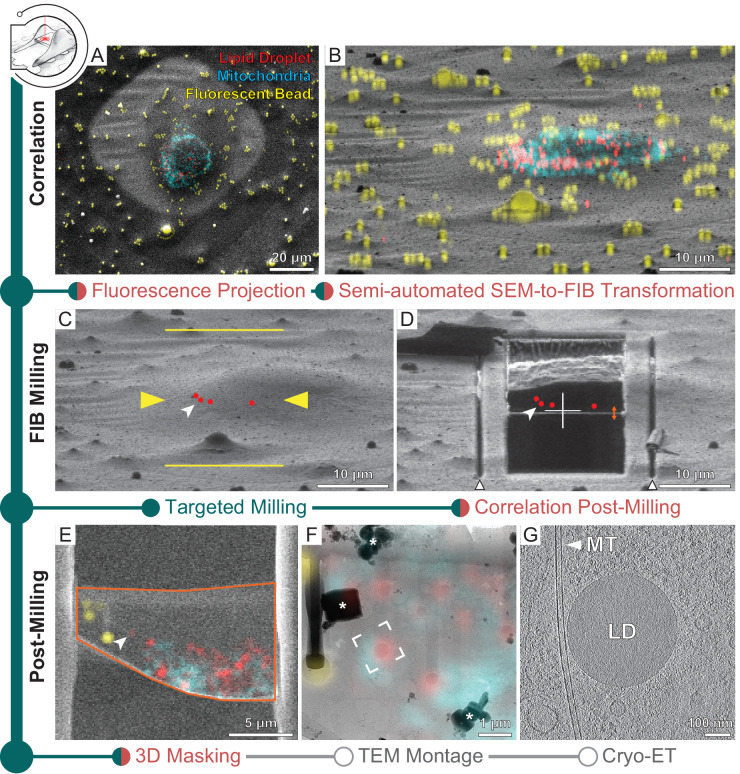
Figure 3.
Three-dimensional correlative light and electron microscopy (3D-CLEM)-targeted lamella preparation of HeLa cells.
Green modules represent tasks performed with SerialFIB; orange, with 3D Correlation Toolbox (3DCT). ( A ) Scanning electron microscopy (SEM) and ( B ) focused ion beam (FIB) images of a cell. Overlaid...
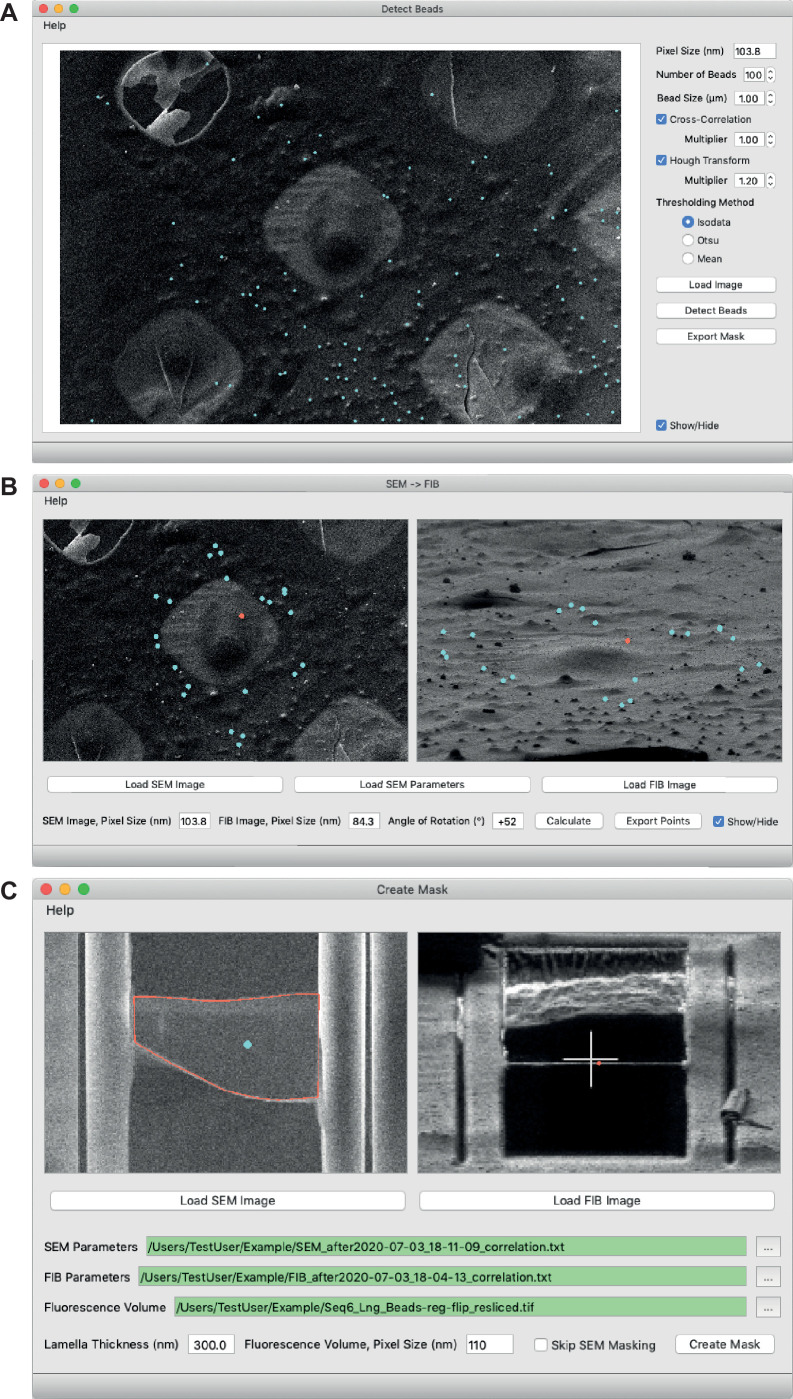
Figure 3u2014figure supplement 1.
New 3D Correlation Toolbox (3DCT) features.
( A ) Semi-automated detection of beads in scanning electron microscopy (SEM) images. Different methods for detection are available. Blue dots indicate beads found. ( B ) Rotation of fiducials from SE...
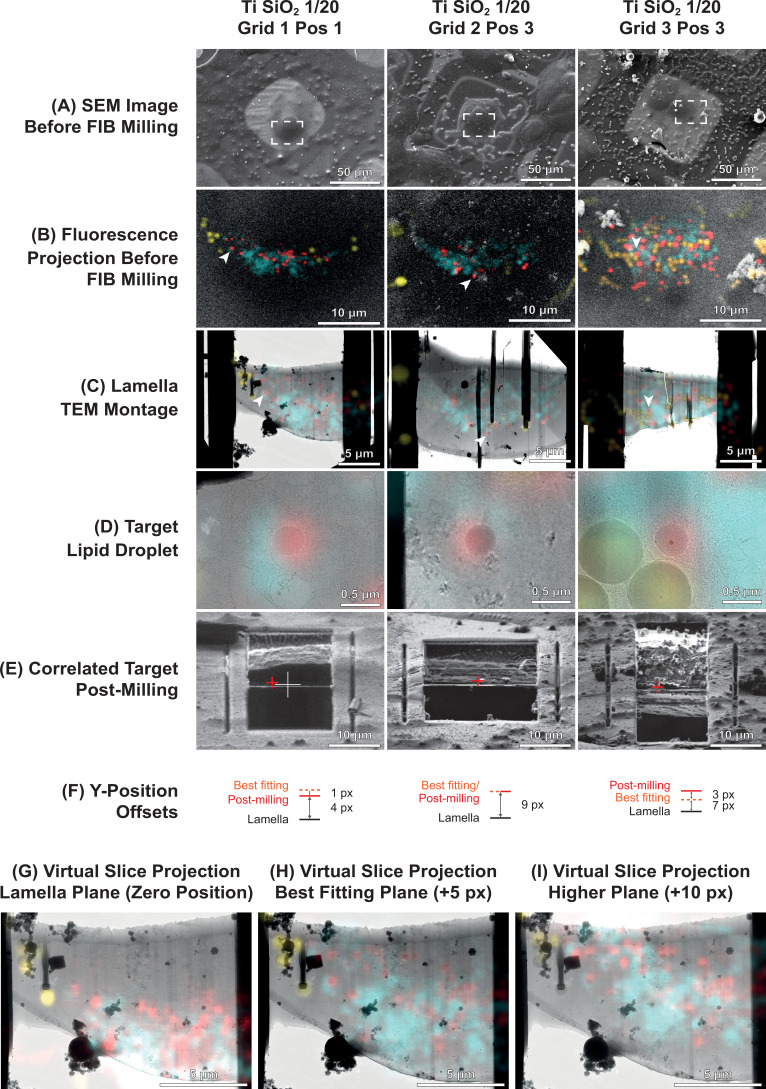
Figure 3u2014figure supplement 2.
Examples of successful 3D-targeted milling of lipid droplets.
( A ) Scanning electron microscopy (SEM) images before focused ion beam (FIB) milling. ( B ) Cryo-fluorescence light microscopy (cryo-FLM) volumes projected onto SEM images before FIB milling in the a...
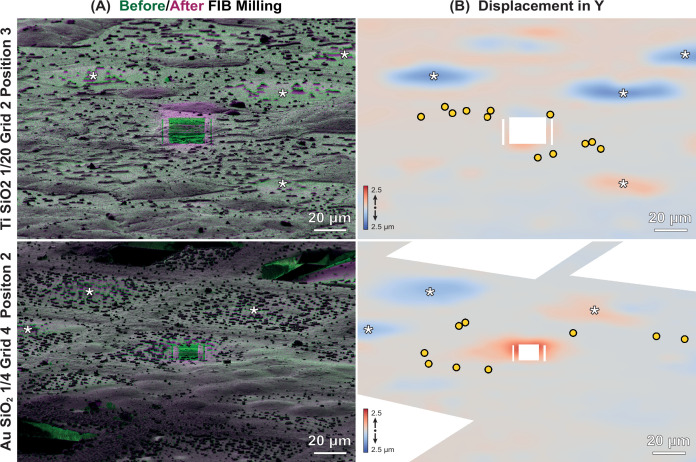
Figure 3u2014figure supplement 3.
Local deformations of specimens.
( A ) Overlay of representative focused ion beam (FIB) images of HeLa cells on Ti SiO 2 1/20 (top) or Au SiO 2 1/4 (bottom), before (green), and after milling (magenta). Grid and position numbering co...
Figure 3u2014video 1.
Tomographic volume of a HeLa cell related to Figure 3G depicting the cytosol with microtubules (MT), a lipid droplet (LD), and a multivesicular body (MVB).
* denotes ice reflections originating from incomplete vitrification.
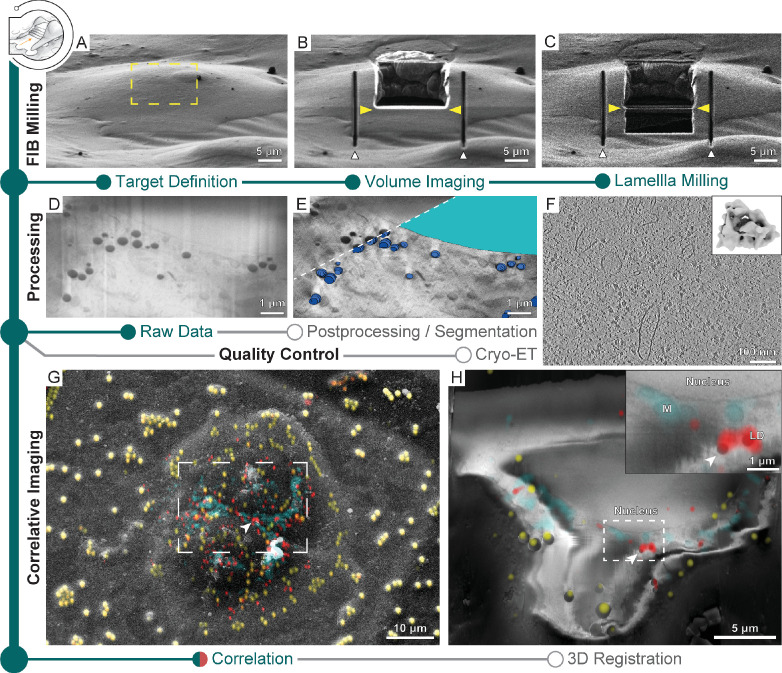
Figure 4.
Multi-modal 3D cryogenic imaging by focused ion beam-scanning electron microscopy (FIB-SEM) volume imaging and cryo-electron tomography (cryo-ET).
Green modules represent tasks performed with SerialFIB; orange, with 3D Correlation Toolbox (3DCT). Gray modules represent tasks performed externally. ( A ) Focused ion beam (FIB) image of a Sum159 br...
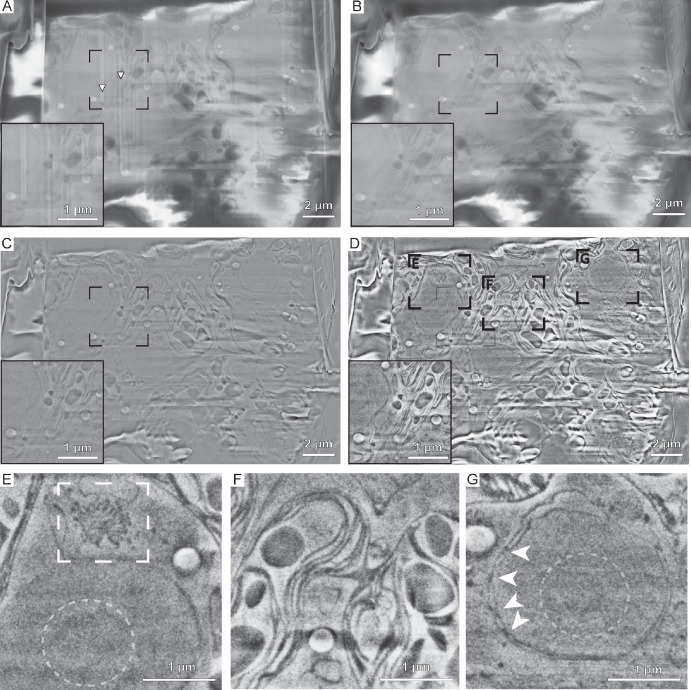
Figure 4u2014figure supplement 1.
Serial focused ion beam-scanning electron microscopy (FIB-SEM) volume imaging of C. reinhardtii and subsequent image processing adapted from Spehner et al., 2020 .
( A ) Raw data. Arrowheads indicate curtaining artifacts from ion beam milling. ( B ) De-striped image using wavelet decomposition to eighth level, Coiflets family 3 and Gaussian blurring (sigma = 6) ...
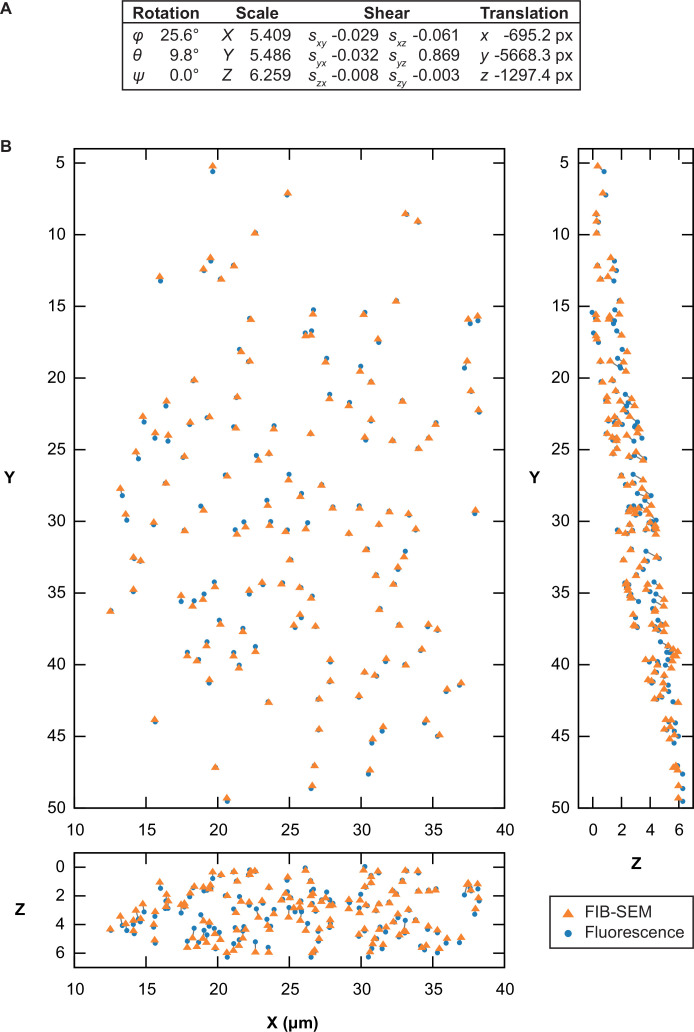
Figure 4u2014figure supplement 2.
Point-based affine 3D registration between focused ion beam-scanning electron microscopy (FIB-SEM) and fluorescence volumes.
Registration in 3D Correlation Toolbox (3DCT) based on the unweighted centroids of lipid droplets and beads manually segmented in the FIB-SEM data, and centers of their fluorescence signal from Gaussi...
Figure 4u2014video 1.
Cryo-focused ion beam-scanning electron microscopy (cryo-FIB-SEM) volume of a Sum159 cell depicting raw and postprocessed data with segmentations of lipid droplets (blue) and the nucleus (cyan).
Figure 4u2014video 2.
Tomographic volume of a Sum159 breast cancer cell related to Figure 4F depicting the cytosol with two vault structures and a vesicle (V).
Figure 4u2014video 3.
Focused ion beam-scanning electron microscopy (FIB-SEM) volume of HeLa cells in Figure 4H , superposed with lipid droplet and bead segmentations and fluorescence volumes transformed.
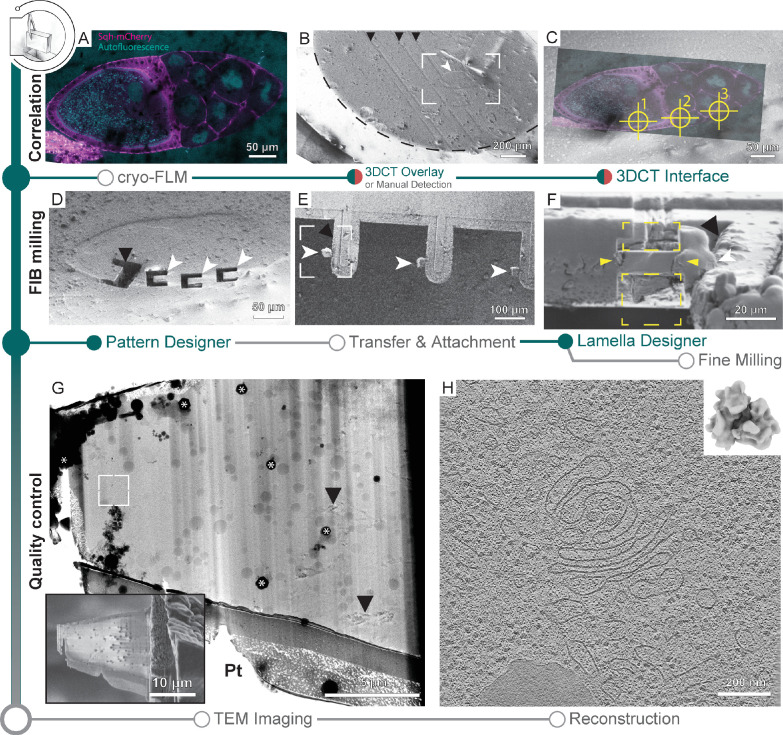
Figure 5.
Cryo-focused ion beam (cryo-FIB) lift-out from high-pressure frozen (HPF) D . melanogaster egg chambers.
( A ) Cryo-fluorescence light microscopy (cryo-FLM) image of an egg chamber expressing Sqh-mCherry (magenta). Autofluorescence (cyan) indicates oocyte and nurse cell nuclei. The anterior of the egg ch...
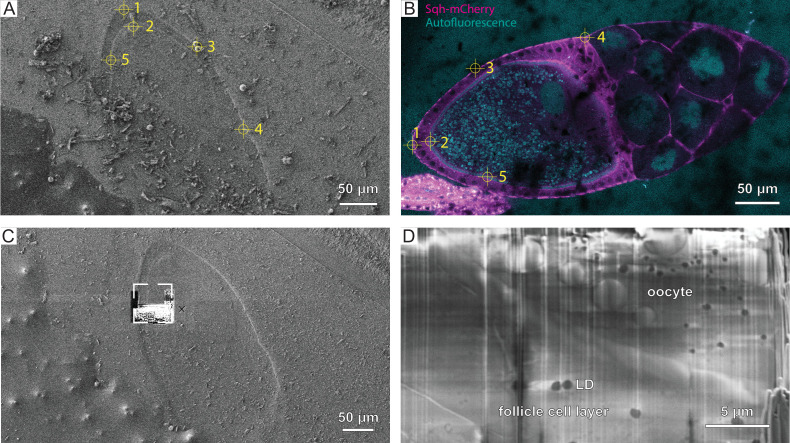
Figure 5u2014figure supplement 1.
Correlation for cryo-focused ion beam (cryo-FIB) lift-out from high-pressure frozen (HPF) D . melanogaster egg chamber.
( A ) FIB and ( B ) cryo-fluorescence light microscopy (cryo-FLM) image (anterior to the right) used for correlation. Crosshair and numbering indicate features used for registration of the two imaging...
Figure 5u2014video 1.
Tomographic volume from a D. melanogaster lift-out lamellae related to Figure 5H depicting the cytosol with a lipid droplet (LD) and a Golgi apparatus.
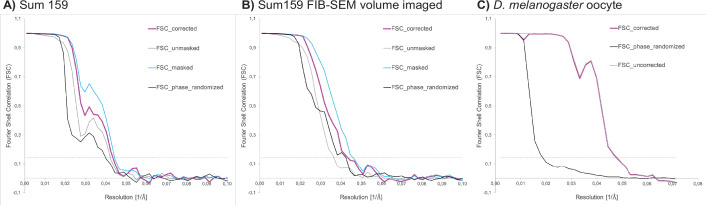
Figure 6.
Fourier shell correlation (FSC) curves for ribosome subtomogram averages from ( A ) Sum159 cells, ( B ) Sum 159 cells after focused ion beam-scanning electron microscopy (FIB-SEM) volume imaging, and from ( C ) a D . melanogaster egg chamber.
FSC threshold at 0.143 indicated by gray dotted line.
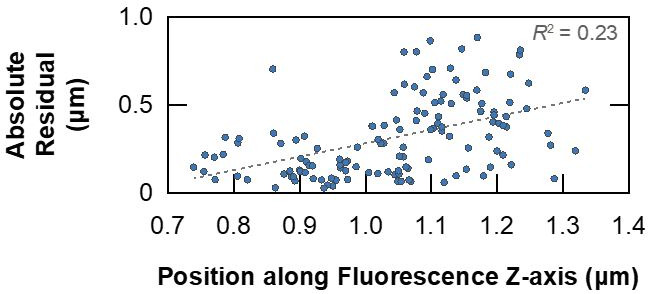
Author response image 1.
Absolute residuals from the point-based affine 3D registration between FIB-SEM and fluorescence volumes of HeLa cells presented in Figure 4u2014figure supplement 2, plotted against their z-position in the fluorescence volume for each point.
Correlation between residual error and imaging depth is weak in this instance, as reflected in the squared Pearson correlation coefficient.
Figure images are served from the NIH/NLM PubMed Central Open Access Subset or Europe PMC; copyright remains with the publishers and authors.
💬 Discussion
0 commentsNo comments yet. Be the first to start a discussion!
Leave a Comment