Abstract
Chemical synapses between axons and dendrites mediate neuronal intercellular communication. Here, we describe a synapse between axons and primary cilia: the axo-ciliary synapse. Using enhanced focused ion beam-scanning electron microscopy on samples with optimally preserved ultrastructure, we discovered synapses between brainstem serotonergic axons and the primary cilia of hippocampal CA1 pyramidal neurons. Functionally, these cilia are enriched in a ciliary-restricted serotonin receptor, the 5-hydroxytryptamine receptor 6 (5-HTR6). Using a cilia-targeted serotonin sensor, we show that opto- and chemogenetic stimulation of serotonergic axons releases serotonin onto cilia. Ciliary 5-HTR6 stimulation activates a non-canonical Gαq/11-RhoA pathway, which modulates nuclear actin and increases histone acetylation and chromatin accessibility. Ablation of this pathway reduces chromatin accessibility in CA1 pyramidal neurons. As a signaling apparatus with proximity to the nucleus, axo-ciliary synapses short circuit neurotransmission to alter the postsynaptic neuron's epigenetic state.
🔬 Techniques
🔭 Microscopes
🧬 Organisms
💻 Software
✨ Fluorophores
🧪 Sample Preparation
🔬 Cell Lines
🏭 Microscope Brands
🧪 Reagent Suppliers
📷 Detectors
🔎 Objectives
💻 Software Details
💾 Data Repositories
🏷️ Research Resource Identifiers (RRIDs)
Verified research resources used in this paper:
🏛️ Research Organizations (ROR)
Affiliated research institutions:
📋 Methods
RESOURCE AVAILABILITY
Lead contact Further information and requests for resources and reagents should be directed to and will be fulfilled by the lead contact, David Clapham ( claphamd@hhmi.org ).
Materials availability
Plasmids generated in this study have been deposited to Addgene: pB-Tet-On-HTR6-RhoA sensor (ID: 189614), pB-Tet-On-Arl13b-RhoA sensor (ID: 189613), pAAV-Syn1-GRAB-HTR6-cilia (ID: 189615), pAAV-TPH2-Cre (ID: 189616), pAAV-TRE-HTR6-SNAPf-TRIP (ID: 189617). Sharing of the RPE-1 cells are limited by terms set by ATCC (American Type Culture Collection). Sharing of HEK239A cell lines are restricted by MTA.
Data and code availability
All data reported in this paper will be shared by the lead contact upon request. This paper does not report original code. Any additional information required to reanalyze the data reported in this paper is available from the lead contact upon request.
EXPERIMENTAL MODEL AND SUBJECT DETAILS Mammalian cell culture hTERT
RPE-1 cells (ATCC CRL-4000, female) and HEK293A cells (female, gift from Dr. Asuka Inoue, Tohoku University, Japan; Schrage et al., 2015 ) were plated at ~20,000 cells/cm 2 on #1.5 12 mm coverslips in 24-wells, 1-chamber 35 mm glass-bottom dishes, or 4-chamber 35 mm glass-bottom dishes (all #1.5 cover glass, Cellvis) in 10% serum containing media (RPE-1: DMEM:F12 media, ATCC 30-2006; HEK293A: DMEM, low glucose, GlutaMax, pyruvate, Thermo Fisher Scientific #10567014; Day 0) at 37°C in 5% CO 2 . For HEK293A cells, dishes were coated with Matrigel (Corning Life Sciences) before plating. The next day (day 1), the cells were serum deprived with 0% FBS media with 100 ng/ml doxycycline to induce GRAB-HTR6-cilia, HTR6-RhoA, or Arl13b-RhoA expression. For HEK293A cells, 1 μM H-89 was also added to induce ciliogenesis. After 24 h of serum deprivation (day 2), GRAB-HTR6-cilia cells were labeled with 250 nM Janelia Fluor 552 (JF552) dye for 2 h. Cells were rinsed and placed back in serum-free media without doxycycline or H-89. Experiments were conducted at 48 to 96 h after serum deprivation (day 3 to 5). For plasma membrane serotonin sensor experiments (GRAB-HTR6-PM), HEK293T cells were cultured in DMEM (Gibco) supplemented with 10% (v/v) FBS (Gibco) and 1% penicillin-streptomycin (Gibco) at 37°C in 5% CO 2 . HEK293T cells were plated on 96-well or 24-well plates and transfected with a mixture of plasmids and PEI (300 ng plasmids and 900 ng PEI for each well in 96-well plates or 1 μg plasmids and 3 μg PEI for each well in 24-well plates) when the cells were grown to ~70% confluence. The medium was replaced after 4-6 h, and cells were used for imaging 24 h after transfection. For stable cell line creation, RPE-1 cells or HEK293A cells were transfected with the piggyBac hyperactive transposase vector (VectorBuilder) and HTR6-RhoA sensor, Arl13b-RhoA sensor or GRAB-HTR6-cilia vector concurrently with Lipofectomine 3000 (Thermo Fisher Scientific) at a 1:2.5 ratio and grown in 10% Tet-free FBS (Gemini) containing media. The cells were then selected by blasticidin at 10 μg/ml to create Tet-on HT6-RhoA sensor stable cells.
Show full methods section
RESOURCE AVAILABILITY
Lead contact Further information and requests for resources and reagents should be directed to and will be fulfilled by the lead contact, David Clapham ( claphamd@hhmi.org ).
Materials availability
Plasmids generated in this study have been deposited to Addgene: pB-Tet-On-HTR6-RhoA sensor (ID: 189614), pB-Tet-On-Arl13b-RhoA sensor (ID: 189613), pAAV-Syn1-GRAB-HTR6-cilia (ID: 189615), pAAV-TPH2-Cre (ID: 189616), pAAV-TRE-HTR6-SNAPf-TRIP (ID: 189617). Sharing of the RPE-1 cells are limited by terms set by ATCC (American Type Culture Collection). Sharing of HEK239A cell lines are restricted by MTA.
Data and code availability
All data reported in this paper will be shared by the lead contact upon request. This paper does not report original code. Any additional information required to reanalyze the data reported in this paper is available from the lead contact upon request.
EXPERIMENTAL MODEL AND SUBJECT DETAILS Mammalian cell culture hTERT
RPE-1 cells (ATCC CRL-4000, female) and HEK293A cells (female, gift from Dr. Asuka Inoue, Tohoku University, Japan; Schrage et al., 2015 ) were plated at ~20,000 cells/cm 2 on #1.5 12 mm coverslips in 24-wells, 1-chamber 35 mm glass-bottom dishes, or 4-chamber 35 mm glass-bottom dishes (all #1.5 cover glass, Cellvis) in 10% serum containing media (RPE-1: DMEM:F12 media, ATCC 30-2006; HEK293A: DMEM, low glucose, GlutaMax, pyruvate, Thermo Fisher Scientific #10567014; Day 0) at 37°C in 5% CO 2 . For HEK293A cells, dishes were coated with Matrigel (Corning Life Sciences) before plating. The next day (day 1), the cells were serum deprived with 0% FBS media with 100 ng/ml doxycycline to induce GRAB-HTR6-cilia, HTR6-RhoA, or Arl13b-RhoA expression. For HEK293A cells, 1 μM H-89 was also added to induce ciliogenesis. After 24 h of serum deprivation (day 2), GRAB-HTR6-cilia cells were labeled with 250 nM Janelia Fluor 552 (JF552) dye for 2 h. Cells were rinsed and placed back in serum-free media without doxycycline or H-89. Experiments were conducted at 48 to 96 h after serum deprivation (day 3 to 5). For plasma membrane serotonin sensor experiments (GRAB-HTR6-PM), HEK293T cells were cultured in DMEM (Gibco) supplemented with 10% (v/v) FBS (Gibco) and 1% penicillin-streptomycin (Gibco) at 37°C in 5% CO 2 . HEK293T cells were plated on 96-well or 24-well plates and transfected with a mixture of plasmids and PEI (300 ng plasmids and 900 ng PEI for each well in 96-well plates or 1 μg plasmids and 3 μg PEI for each well in 24-well plates) when the cells were grown to ~70% confluence. The medium was replaced after 4-6 h, and cells were used for imaging 24 h after transfection. For stable cell line creation, RPE-1 cells or HEK293A cells were transfected with the piggyBac hyperactive transposase vector (VectorBuilder) and HTR6-RhoA sensor, Arl13b-RhoA sensor or GRAB-HTR6-cilia vector concurrently with Lipofectomine 3000 (Thermo Fisher Scientific) at a 1:2.5 ratio and grown in 10% Tet-free FBS (Gemini) containing media. The cells were then selected by blasticidin at 10 μg/ml to create Tet-on HT6-RhoA sensor stable cells.
Primary hippocampal and raphe neuron culture
Hippocampi and midbrains were dissected from P0 Sprague-Dawley rat pups of both sexes. Rat maintenance and care followed policies advocated by NRC and PHS publications and approved by the Institutional Animal Care and Use Committee (IACUC), Janelia Research Campus. Tissues were digested with papain and gently triturated and filtered through a 40 μm filter. Neurons were electroporated (Lonza 4D-nucleofactor) with Tet-On Arl13b-RhoA (hippocampal neurons) or Tph2 -Cre (tryptophan hydroxylase 2-Cre, midbrain neurons) and plated in poly-D-lysine coated dishes and cultured in NbActiv4 (BrainBits) at 37°C and 5% CO 2 . A week after plating, the neuronal cultures were fed with B-27 plus neuronal culture system (Thermo Fisher Scientific). AAV transduction (Syn1-GRAB-HTR6-cilia, FLEX-on hM3DGq-DREADD, FLEX-on farnesylated SNAP, or FLEX-on tdTomato) were applied at DIV10. 100 ng/ml doxycycline was added at DIV 6 or DIV14 and removed the next day for Arl13b-RhoA experiments. Images were collected between DIV 9 and DIV 28 (Alr13b-RhoA, hippocampal culture only) or DIV21-35 (hippocampal and midbrain co-culture). JF552-STL (SNAP-labeled neurons) was applied the day prior to imaging (100 nM, 2 h).
Animals
Mice used in the study were between P14 (juvenile) and 4-months old (adult; see Figure Legends for the age/sex of each experiment). C57BL/6 and C57BL/6J mice were obtained from Charles River Laboratories and the Jackson Laboratory, respectively. Htr6 -EGFP knock-in mice were generated at the Institut Clinique de la Souris (Illkirch-Graffenstaden, France). Htr6 KO mice were generated at the Phenomin consortium (Institut Clinique de la Souris, Illkirch-Graffenstaden, France) by using CRISPR-Cas9. Htr6 exon 3 and 4 were targeted using two pairs of guide RNAs on each side of the targeted region. Both Htr6 -EGFP and Htr6 KO mice were on the C57BL/6 genetic background. All animal work was approved by the Boston Children’s Hospital Institutional Animal Care and Use Committee (IACUC 16-03-3138R), the Janelia Institutional Animal Care and Use Committee (IACUC 16–146 and 19-181), or the animal use and care guidelines of Montpellier University (France, authorization D34-172-4). No restrictions were imposed on food and water. Mice were housed under regular light:dark cycles and standard caging environments. For doxycycline induction experiments, mice were fed with doxycycline-containing food (2000 ppm, Animal Specialties and Provisions, modified from LabDiet 5053) for 1 week. Comparable results were obtained in both males and females ( Figures 2 , S1 , and S3 ). Littermates of the same sex were randomly assigned to experimental groups. METHOD DETAILS Synthesis of PA-O-5-hydroxytryptamine (photoactivatable serotonin) N -Boc serotonin ( S1 , 60 mg, 217 μmol, 3.5 eq) and coumarin bromide ( S2 , 30 mg, 62.2 μmol, 1 eq) were dissolved in CH 3 CN (4 mL). K 2 CO 3 (potassium carbonate, 60 mg, 435 μmol, 2 eq) was added and the reaction was stirred at room temperature for 15 h. The reaction was concentrated under reduced pressure, the residue dissolved in EtOAc, then washed with water and saturated NaCl (aq), dried over MgSO 4 , and concentrated under reduced pressure. The material was purified using flash chromatography on silica gel (0–50% EtOAc/hexanes, linear gradient), which afforded 35 mg (83%) of compound S3 as a pale-yellow solid. Compound S3 (30 mg, 44.3 μmol) was dissolved in CH 2 Cl 2 (2 mL). Trifluoroacetic acid (TFA; 0.4 mL) was added and the reaction was stirred at room temperature for 2 h while shielded from light. Toluene (5 mL) was added, and the mixture was concentrated under reduced pressure. The residue was purified by reverse-phase HPLC using a gradient of CH 3 CN/H 2 O containing 0.1% v/v TFA as additive. 1H NMR (400 MHz, 1:1 CD3OD, CD3CN) δ 7.71 (s, 1H), 7.64 (d, J = 8.9 Hz, 1H), 7.31 (d, J = 8.9 Hz, 1H), 7.16 (d, J = 2.4 Hz, 1H), 7.13 (s, 1H), 6.93 (dd, J = 8.8, 2.5 Hz, 1H), 6.65 (dd, J = 9.0, 2.7 Hz, 1H), 6.52 (d, J = 2.6 Hz, 1H), 6.32 (s, 1H), 5.30 (s, 2H), 4.24 (s, 4H), 3.15 (t, J = 7.3 Hz, 2H), 3.01 (t, J = 7.3 Hz, 2H). HRMS (ESI) calculated for C 24 H 24 N 3 O 7 [M+H]+ 466.1609, was 466.1615. Design and cloning of RhoA and 5-HT sensors The piggyBac Tet-On HTR6-RhoA sensor was generated based on the published mScarlet-I based RhoA sensor ( Bindels et al., 2017 ). The mScarlet-I:sGFP2:RhoA and the cpPKN1 fragments were synthesized (Genscript) and cloned into piggyBac Tet-On vector Xlone HTR6-HaloTag ( Deo et al., 2019 ). The Xlone-Ar13b-RhoA sensor was subcloned by replacing HTR6 with ARL13B (VectorBuilder). To make GRAB-HTR6-PM, cpEGFP and linkers were PCR-amplified from GRAB NE ( Feng et al., 2019 ), and the cDNA encoding human 5-HTR6 was PCR-amplified from HTR6-Tango (a gift from Bryan Roth, Addgene 66414; RRID:Addgene_66414; Kroeze et al., 2015 ). Then, the chimeric GRAB sensor was cloned into the pDisplay vector (Invitrogen). Similar to other sensors based on the same platform, the N-terminus of this construct has an IgK leader sequence that serves as a plasma membrane targeting signal to further enhance the plasma membrane expression (see Methods S1 for full amino acid sequence). In addition, an IRES-mCherry-CAAX was added at the C-terminus to serve as a reference of membrane marker to calibrate the expression levels. GRAB-HTR6-cilia was made by cloning the GRAB-HTR6-PM (excluding the IgK leader sequence and IRES-mCherry-CAAX) with a 3xGGGGS-HaloTag at the C-terminus onto the Xlone backbone by VectorBuilder. The wild-type 5-HTR6 localized well to cilia ( Barbeito et al., 2021 ; Berbari et al., 2008 ) without the artificial IgK leader sequence. Since the sensor inherits the properties of 5-HTR6, it can still traffic well onto the ciliary membrane. Molecular Biology of AAV vectors Tph2 -Cre vector was generated by replacing GFP in Tph2 -GFP( Wan et al., 2016 ; gift from Dr. Björklund) with the Cre-recombinase in Syn1-EBFP-Cre AAV (gift from Hongkui Zeng, Addgene plasmid # 51507; RRID:Addgene_51507). pAAV-Syn-FLEX-rc[ChrimsonR-tdTomato] was a gift from Edward Boyden (Addgene plasmid # 62723; RRID:Addgene_62723). pAAV[FLEX-ON]-CAG-Farnesylated-SNAPtag AAV plasmid was made by VectorBuilder, Inc. pAAV-FLEX-ON-tdTomato was a gift from Edward Boyden (Addgene plasmid # 28306; RRID:Addgene_28306). pAAV-EF1a-DIO-hM3D(Gq)-mCherry was a gift from Bryan Roth (Addgene plasmid # 50460; RRID:Addgene_50460). pAAV-TRE-HTR6-SNAPf-TRIP and pAAV-Syn-Tet3G were made by VectorBuilder. Syn-Tet3G and TRE-HTR6-SNAPf-TRIP were packaged in AAV2/rh10 capsid, and the other viral vectors were packaged in the AAV2/PHP.eB capsid. All above viral vectors were made by the HHMI Viral Tools (Janelia). AAV phSyn1(S)-FLEX-tdTomato-T2A-SypEGFP-WPRE was a gift from Hongkui Zeng (Addgene viral prep # 51509-AAV1; http://n2t.net/addgene:51509 ; RRID:Addgene_51509). Intracranial injections of AAVs 8-week-old adult mice were anesthetized with 2.5%-3.0% isoflurane with an O 2 rate of 1L/min and mounted on a stereotaxic frame. The body temperature was maintained at 37°C using a heating pad. Mice were given buprenorphine (0.1 mg/kg) subcutaneously at 5 mg/kg of body weight. After shaving, a drill was used to create a small craniotomy hole (~1 mm). For CA1 pyramidal neuron layer injections, 200 nL of AAV mixture composed of AAV-rh10-Syn-Tet3G and AAV-rh10-TRE-HTR6-TRIP (1:2 ratio, 5×10 12 vg/ml and 10 13 vg/ml, respectively) were bilaterally injected at anteroposterior −2.25 mm relative to Bregma, mediolateral ±2 mm relative to Bregma; dorsoventral −1.43 mm relative to the skull surface at a rate of 50 nL/minute using a Nanoject II Injector (Drummond Scientific, USA) followed by 5 additional minutes to allow diffusion. For median raphe B8 injections, 750 nL of AAV mixture composed of AAV-php.eB- Tph2 -Cre and AAV-2/1-phSyn1-FLEX-tdTomato-T2A-SypEGFP (1:2 ratio, 5×10 12 vg/ml and 10 13 vg/ml, respectively) were injected at anteroposterior −4.4 mm relative to Bregma, mediolateral 0 mm relative to Bregma; dorsoventral −4.4 mm relative to the skull surface at a rate of 75 nL/minute using a Nanoject II Injector (Drummond Scientific, USA) followed by 5 additional minutes to allow diffusion. Upon recovery, mice were given Ketaprofen (5 mg/kg, subcutaneous) and placed back in the home cage. Ketoprofen (5 mg/kg, sub-cutaneous) was given once a day for additional two days post-surgery.
Immunofluorescence and imaging
For cultured cells, #1.5 coverslips were first fixed in 4% paraformaldehyde (PFA) in PBS overnight at 4°C. Samples were then rinsed in PBS for 5 min x 3. After permeabilization with 0.3% Triton-X in PBS for 30 min, samples were blocked with 5% normal goat serum (NGS) in PBS for 1 h. 5% NGS was then replaced with primary antibody containing solution in 1% BSA in PBS with 2 mM sodium azide overnight at 4°C. After rinsing in PBS for 5 min x 3, samples were stained with secondary antibody and Hoescht 33342 for 2 h. For Trio staining, the samples were stained according to the Alexa tyramide amplification system with the SuperBoost protocol (Thermo Fisher Scientific). Samples were then rinsed in PBS for 5 min x 2 /Milli-Q water 5 min x 1 and mounted on Vectashield Vibrance (Vector Laboratories) or Prolong Fade Glass (Thermo Fisher Scientific). For mouse brain samples, mice were deeply anesthetized with isoflurane inhalation or ketamine/xylazine (200 mg/kg ketamine and 20 mg/kg xylazine) intra-peritoneal injection and intracardially perfused with 4% PFA in phosphate-buffered saline (PBS). The brains were removed and post-fixed in 4% PFA in PBS overnight at 4°C. Samples were then rinsed in PBS x3, 15 min each. Serial sections of 50 μm or 200 μm were obtained on a vibratome. For 50 μm mouse brain sections, fixed slices were incubated at room temperature in 0.3% Triton-X in PBS overnight, followed by 5 h in blocking buffer (BlockAid, Thermo Fisher Scientific), overnight in primary antibody, and again overnight in secondary antibody and Hoechst 33342 (2 μg/ml). Both primary and secondary antibodies were diluted in the same blocking buffer (BlockAid, Thermo Fisher Scientific). The stained sections were then rinsed in PBS 15 x 2 times/300 mOsm glycerol 15 min x 1 and mounted in ProLong Fade Glass or SlowFade Glass (Thermo Fisher Scientific). Between antibodies, slices were washed x3, 15 min each with PBS. For 200 μm mouse brain sections, slices were first treated with the epoxide-crosslinker as in the SHIELD protocol (Life Canvas Technology, Park et al., 2018 ). Afterwards, sections were incubated in 2% Triton-X in PBS with 2 mM sodium azide for 3 days for permeabilization. Sections were then incubated in primary and secondary antibodies for 2 days at room temperature, respectively. After washing, sections were mounted in SlowFade Glass (Thermo Fisher Scientific). The following primary antibodies were used: rabbit anti-GFP (Chromotek PABG1, 1:1000), guinea-pig anti-SERT (synaptic systems 340004, 1:200), mouse anti-ADCY3 (Encor Biotechnology MCA-1A12, 1:1000), rabbit anti-PCP4 (Millipore Sigma, HPA005792, 1:500), chicken anti-rootletin (Millipore Sigma, ABN1686, 1:1000), rabbit anti-ADD1 (Abcam EP734Y, #ab40760, 1:250), rabbit anti-synaptophysin (Cell Signaling, #36406, 1:100), rabbit anti-synaptophysin (Thermo Fisher Scientific, MA5-14532, 1:200), rabbit anti-Trio GEFD2 (custom antibody, gift from Dr. Susanne Schmidt, 1:500), rabbit anti-H4K5ac (Thermo Fisher Scientific MA5-32009, 1:250), mouse anti-panH4ac (Thermo Fisher Scientific MA3-066, 1:250), rabbit anti-H3K27ac (Abcam ab177178, 1:7000). The following secondary antibodies and dyes were used: Alexa Fluor Plus 488 goat anti-rabbit (1:1000, Thermo Fisher Scientific), CF488A donkey anti-guinea pig (1:1000, Biotium), Alexa Fluor Plus 555 goat anti-rabbit (1:1000, Thermo Fisher Scientific), CF555 goat anti-mouse IgG 1 (1:1000, Thermo Fisher Scientific), CF633 goat anti-mouse IgG 1 (1:1000, Biotium), CF633 donkey anti-rabbit IgG 1 (1:1000, Biotium), Hoescht 33342 (10 μg/ml, Thermo Fisher Scientific), SuperBoost goat anti-rabbit polyHRP (ready-to-use 1x concentration, Thermo Fisher Scientific). Confocal imaging was done either on a Zeiss 880/980 Laser Scanning Confocal Microscope (LSM) or Leica Stellaris with FLIM. The Zeiss systems are equipped with a Plan-Apochromat 63x/1.4 oil, 40x/1.2 multi-immersion LD LCI Plan-Apochromat, and 20x/0.8 air Plan-Apochromat objective; ZEN Black and Blue software. Hoechst 3342 was excited by 405 nm laser light and the spectral detector set to 409-481 nm. Alexa 488/CF488 was excited by 488 nm laser light and the spectral detector set to 490-545 nm. Alexa 555 was excited by 561 nm laser light and the spectral detector set to 570-642 nm. ATTO-590 was excited by 594 nm laser light (Airyscan only). CF633 was excited with 633 nm light and the spectral detector set to 642-755 nm. The spectral detector was only used for non-Airyscan confocal scanning imaging sessions. The Leica Stellaris is equipped with a 20x air HC PL APO 20x/0.75 CS2 and HC PL APO 63x/1.4 oil-immersion objectives; Las X software. Alexa 488 was excited at 499 nm and imaged with the HyD X2 detector set to a 504 - 548 nm window. CF555 was excited at 553 nm and imaged with the HyDS3 detector set to a 558 - 633 nm window. CF633 was excited at 629 nm and imaged with the HyDX4 detector set to a 637 - 750 nm window. All detectors were set in photon counting mode, and the pulsed white light laser was set at 80 MHz. With the CF633 channel, the average photon arrival time was used to separate autofluorescence background (peak at 0.3 ns) and CF633 signal (peak at 2.3 ns). Adaptive deconvolution was performed using Leica Lightning processing with smoothing set to “very low” and without cutoff or auto-contrast.
Electron microscopy of CA1 pyramidal neuron cilia
Conventional chemical fixation protocol
Mice were anesthetized with ketamine/xylazine (200 mg/kg ketamine and 20 mg/kg xylazine) intra-peritoneal injection and perfused with a solution of 2% PFA and 2% glutaraldehyde in 0.1 M sodium cacodylate buffer, 0.2 mM CaCl 2 . The brain samples were dissected and post-fixed in the perfusion solution overnight at 4°C. After rinsing with 0.1M sodium cacodylate buffer, 300 μm serial sections were obtained on a vibratome. The tissue was then immersed in 1% osmium tetroxide and 1.5% potassium ferricyanide in a 0.1 M cacodylate buffer for 1 h. After rinsing in 0.1 M sodium cacodylate buffer, the sections were further stained with 1% osmium tetroxide in water for 1 h, followed by 2% uranyl acetate in maleate buffer (pH = 5.15) overnight at 4°C. The tissue was then washed in water, dehydrated with graded ethanol, and embedded in Epon812 resin. Epon-812 flat-embedded mouse hippocampal CA1 samples were first mounted on an aluminum stub. The sample surface was polished on an ultramicrotome, followed by carbon coating (20 nm). The samples were then imaged on the Zeiss Crossbeam 540 at 5-6 nm pixel size with 15-20 nm milling using ATLAS 5 software (Zeiss). Hybrid protocol 2 - 3-month-old male C57/BL6 mice were deeply anesthetized and transcardially perfused with 30 mL of 3% PFA (60 mM NaCl, 130 mM glycerol, 10 mM sodium phosphate buffer). The brain was carefully dissected from the skull and post-fixed with 50 mL of 3% PFA (30 mM NaCl, 70 mM glycerol, 30 mM PIPES buffer, 10 mM betaine, 2 mM CaCl 2 , 2 mM MgSO 4 ) at room temperature for 2 h. The brain sample was then rinsed in a 400 mOsM buffer (65 mM NaCl, 100 mM glycerol, 30 mM PIPES buffer, 10 mM betaine, 2 mM CaCl 2 , and 2 mM MgSO 4 ) for 0.5 h, followed by vibratome sectioning (coronal sections, 100 μm thickness) using a Leica VT1000S vibratome in the same buffer. 100 μm sections were then fixed in 1% PFA, 2% glutaraldehyde solution (30 mM NaCl, 70 mM glycerol, 30 mM PIPES buffer, 10 mM betaine, 2 mM CaCl 2 , 2 mM MgSO 4 , 75 mM sucrose) overnight at 4°C. Sections were then washed using the 400 mOsM rinsing buffer (see above). Round samples of the hippocampus were created from the 100 μm coronal sections using a 2 mm biopsy punch (Miltex). The 2 mm samples were dipped in 1-Hexadecene, placed in a 100 μm aluminum carrier, covered with a flat carrier and high-pressure frozen using a Wohlwend compact high-pressure freezer (Wohlwend GmbH, Switzerland). Samples were then freeze-substituted in 0.5% osmium tetroxide, 20 mM 3-amino-1,2,4-triazole or 20 mM imidazole, 0.1% uranyl acetate, 4% water in acetone, using a Leica AFS2 system. Specimens were further dehydrated in 100% acetone and embedded in Durcupan resin. Two datasets were acquired using the hybrid protocol, stained with either osmium-imidazole or osmium-3-amino-1,2,4-triazole. The samples were mounted on a copper post and trimmed to the Region of Interest (ROI), guided by X-ray tomography data obtained by a Zeiss Versa XRM-510. The samples were coated with a thin layer of 10-to 20-nm gold and 50-to 100-nm carbon and imaged by a customized Zeiss Merlin FIB-SEM or NVision40 FIB-SEM system using 8 nm pixel size with 2 or 4 nm of milling depth. After alignment using a Scale Invariant Feature Transform (SIFT) based algorithm ( Lowe, 2004 ), the stacks were binned by a factor of 2 or 4 along z to form a final isotropic volume of 35 μm x 35 μm x 40 μm and 50 μm x 50 μm x 44 μm with 8 nm x 8 nm x 8 nm voxels. The electron microscopy datasets generated above were manually segmented using VAST (Volume Annotation and Segmentation Tool, Berger et al., 2018 ). Segmented results were exported as obj files, and rendered using 3ds Max 2021 (Autodesk, Inc.). For synaptic vesicles in Figure 2E , the centroids of segmented vesicles were calculated in 3D, and 40 nm spheres were generated as 40 nm spheres in 3ds Max. The hybrid protocol was developed for this work, which were used to generate two enhanced FIB-SEM datasets in the CA1 area to examine primary cilia. Prior to the completion of this manuscript, these datasets have been shared with others to examine lipid droplets ( Ioannou et al., 2019 ), myelin distribution along large axons ( Gao et al., 2019 ), and mitochondrial morphology ( Delgado et al., 2019 ).
Characterization of the GRAB-HTR6-PM sensor
For dose-dependent curve and selectivity tests, HEK293T cells expressing the GRAB-HTR6-PM sensor were imaged by the Opera Phenix high-content screening system. Before imaging, the culture medium was replaced with 100 μL Tyrode’s solution consisting of (in mM): 150 NaCl, 4 KCl, 2 MgCl 2 , 2 CaCl 2 , 10 HEPES and 10 glucose (pH 7.4). For imaging, a 40x/1.1-NA water-immersion objective, a 488-nm laser combined with a 525/50-nm emission filter for excitation and collection of the GFP fluorescence signal, and a 561-nm laser combined with a 600/30-nm emission filter for the collection of the mCherry fluorescence signal were used. The same field of views (FOVs) were imaged without or with 5-HT (at various concentrations, in Tyrode’s solution), respectively. The fluorescence signal of the GRAB-HTR6-PM sensor was calibrated using the ratio of GFP to mCherry. For kinetics measurement, we used an inverted Ti-E A1 confocal microscope (Nikon) equipped with a 40x/1.35 numerical aperture oil-immersion objective, a 488-nm laser and a 561-nm laser. GFP and mCherry fluorescence was collected using a 525/50-nm emission filter and a 595/50-nm emission filter, respectively. HEK293T cells were bathed in a chamber containing Tyrode’s solution. To measure the sensor kinetics, a glass pipette was positioned close to the sensor-expressing cells and the fluorescence signals were measured using confocal high-speed line scanning mode (scanning speed 1024 Hz). For on kinetics, 100 μM 5-HT was puffed from the pipette. For off kinetics, 100 μM HTR6 antagonist SB 271046 was puffed onto cells bathed in 1 μM 5-HT. The basal fluorescent intensity of GRAB-HTR6-PM before 5-HT applications was used as F 0 for calculating the ‘on’ response, while the fluorescence intensity under 1 μM 5-HT was set as F 0 for calculating the ‘off’ response. Measurements of the GRAB-HTR6-cilia sensor GRAB-HTR6-cilia titration curve Serum deprived, JF552 labeled RPE-1 cells stably expressing GRAB-HTR6-cilia were imaged in a HEPES-buffered imaging media (140 mM NaCl, 20 mM HEPES, 2.5 mM KCl, 1.8 mM CaCl 2 , 1.0 mM MgCl 2 , pH = 7.4, mOsm = 300; Live Cell Imaging Solution, Thermo Fisher Scientific A14291DJ) using a 20x air Plan-Apochromat objective (Zeiss, NA = 0.8) with FAST Airyscan on a Zeiss 880 confocal microscope at 37°C. GFP and JF552 were excited with 488 nm and 561 nm lasers, respectively. Keeping the same field of view, z stacks were acquired at different concentrations of 5-HT diluted in the same imaging buffer.
GRAB-HTR6-cilia with optogenetic stimulation
Hippocampal neurons expressing GRAB-HTR6-cilia and serotonergic neurons expressing ChrimsonR-tdTomato, farnesylated SNAP-Tag:JF552, or tdTomato were imaged with a 40x multi-immersion LD LCI Plan-Apochromat objective (Zeiss, NA = 1.2; silicone oil was used as the immersion media) on a Zeiss LSM 880 microscope in artificial cerebral spinal fluid (NaCl 124 mM, KCl 2.5 mM, NaH 2 PO 4 1.2 mM, NaHCO 3 24 mM, HEPES 5 mM, glucose 12.5 mM, MgSO 4 2mM, CaCl 2 2mM, Ting et al., 2018 ) at 37°C. Two-channel FAST Airyscan images were first imaged to characterize the axociliary synapses using 488 nm or 561 nm excitations for GFP and red fluorophores, respectively. GRAB-HTR6-cilia was then imaged at 1 Hz using the 488 nm laser with z-stacks. After 30 s, the 594 nm laser line was used to photostimulate at the same 1 Hz frequency (2 mW, 25 μm x 25 μm square, repetition = 1, pixel dwell time = 0.55 μs). A total of 120 z-stacks were acquired per cilium (120 s). Airyscan stacks were processed using Zen Black (auto-strength, 3D; Zeiss).
GRAB-HTR6-cilia with chemogenetic stimulation
Hippocampal neurons expressing GRAB-HTR6-cilia and serotonergic neurons expressing hM3Dq or farnesylated SNAP-Tag:JF552 were imaged with a 40x multi-immersion LD LCI Plan-Apochromat objective (Zeiss, NA = 1.2; silicone oil was used as the immersion media) on a Zeiss LSM 880 microscope in artificial cerebral spinal fluid (NaCl 124 mM, KCl 2.5 mM, NaH 2 PO 4 1.2 mM, NaHCO 3 24 mM, HEPES 5 mM, glucose 12.5 mM, MgSO 4 2mM, CaCl 2 2mM, Ting et al., 2018 ) at 37°C. Two-channel FAST Airyscan images were first imaged to characterize the axociliary synapses using 488 nm, 561 nm, or 594 nm excitations for GFP, JF552, and mCherry, respectively. GRAB-HTR6-cilia were then imaged at every 5 s using the 488 nm laser with z-stacks. After 1 min, 10 nM DCZ was directly added to the imaging media. A total of 60 z-stacks were acquired per cilium (3 min).
HTR6-RhoA FRET measurements
Images were collected using silicone-oil immersion media with a 40x multi-immersion LD LCI Plan-Apochromat objective (Zeiss, NA = 1.2; silicone oil immersion media) on a Zeiss LSM 880 microscope. Single apical cilia were imaged at zoom 10 with 4 Airy units (146 μm pinhole), 212 x 212 frame size, 0.1 μm pixel size, 0.93 μs pixel dwell time, 16-bit bidirectional scanning, and 4 optical sections (1.8 μm) to cover the entire length of the cilium. The resulting temporal resolution was 0.25 s. The donor fluorophore, sGFP2 was excited by the 488 nm laser. Donor emission from mScarlet-I was collected with the spectral detector set to 490-550 nm. Acceptor-sensitized emission was collected with the spectral detector set to 570-650 nm. For uncaging experiments, the following uncaging parameters were used on a 5 μm radius circle adjacent to the ciliary tip: repeat each stack x10 using the same pixel dwell time as during scanning. Two experiment blocks (400 time frames each) were used to acquire data with and without uncaging. Uncaging started at frame 20 in the first block, with no uncaging during the second block. Ciliary-RhoA FLIM measurements 3D z-stacks covering entire cilia were collected at 5 min intervals using an 40x oil immersion Plan-Apochromat objective (Leica, NA = 1.3) on a Leica SP8 Falcon microscope at 2x the Nyquist limit and 1 Airy disc. Donor sGFP fluorescence was excited by a pulsed (40 MHz) white light laser tuned at 488 nm, and emitted photons between 490 nm and 550 nm were collected with line repetition = 8. ATAC-see staining in brain sections Transposase-mixture solution (hyperactive Tn5 transposase with ATTO-590 conjugated oligos) were prepared as described previously ( Chen et al., 2016 ). 50 μm thick, PFA-fixed CA1 coronal sections from 4-month-old C57BL/6 wild-type, Htr6 KO, non-doxycycline-treated control, and doxycycline-treated HTR6-TRIP mice were obtained using the same method as described above. A 3 mm punch of the CA1 area was created using a biopsy punch on the 50 μm thick sections (Electron Microscopy Sciences). These punches were permeabilized in 0.3% Triton/PBS overnight at RT followed by 0.1% Triton, 0.1% Tween-20, and 0.01% digitonin in 10 mM Tris-HCL, 1 mM NaCl, 1.5 mM MgCl 2 buffer (ATAC-RSB, or ATAC-Resuspension buffer) for 2 hrs. The samples were then rinsed in 0.1% Tween-20 in ATAC-RSB for 3 times and incubated in the transposase-mixture solution (100 nM Tn5 transposase, 10 mM Tris-HCl pH 7.5, 5 mM MgCl 2 , 33% PBS, 0.01% digitonin, 0.1% Tween-20, 8% PEG8000) for 2 h at 37°C on a shaker. After incubation, the samples were washed x 3 for 15 min at 55 °C with 1 × PBS containing 0.01% SDS and 50 mM EDTA, followed by regular PBS at room temperature for 15 min. The samples were subsequently stained with Hoechst 33342 (10 ug/ml) for 2 h, rinsed in PBS 15, and mounted in Slow Fade Glass (Thermo Fisher Scientific). Non-doxycycline-treated control and doxycycline-treated HTR6-TRIP samples were also stained with ADCY3 and CF633.
QUANTIFICATION AND STATISTICAL ANALYSIS
Quantification and statistical analyses of GRAB-HTR6 and ciliary RhoA
FRET/FLIM were described above in their respective sections. Details of experiments, including sample size and statistics can be found in the text, figures, or figure legends. Two mice per condition were used in Figures 6 , 7 , S3C , S3D , S6 , and S7 . Except for Figures 3E , S3C , S3D , and S6 , all statistical tests were done using estimation statistics ( Ho et al., 2019 ). Estimation statistics focuses on the effect size and its precision. In all estimation statistics plots, the effect size, or the mean difference, is presented as a bootstrap sampling distribution with 5000 bootstrap samples. In most cases, conventional p-values using nonparametric tests were also provided. No method was used to predetermine sample size, which represents data collected spanning different sessions. Blinding was not performed. Formal randomization techniques were not used. Quantification of cilia trajectory in the brain 3D stacks of ADCY3-stained cilia images were projected along the z axis using maximum intensity projections and analyzed with the OrientationJ plug-in in ImageJ/Fiji using a gaussian gradient ( Püspöki et al., 2016 ; Rezakhaniha et al., 2012 ). The algorithm computes the structure tensor for each pixel in the image using a sliding gaussian analysis window. A local window size of 2 and 20 pixels are used for visualization and weighted histogram calculation, respectively. Gaussian fitting of the weighted histogram was performed and plotted in Graphpad Prism (v9.2). Quantification of cilia and serotonergic axon, synaptophysin vesicle apposition and nuclear adducin puncta Linear Unmixing 3D stacks of Hoechst-stained nuclei, SERT-stained serotonergic axons (CF488), synaptophysin-stained presynaptic terminals (Alexa Fluor Plus 555), and ADCY3-stained cilia (CF633) images were acquired using FAST Airyscan. The red and far-red channel Airyscan data (41 nm x 41 nm x 189 nm voxel size, 3D Airyscan processing with Auto Filter) were unmixed via a custom MATLAB script. Nucleus, cilia, axon and synaptophysin segmentation The multichannel volumes acquired were resampled to generated isotropic voxel sizes of 189 nm. The nucleus, cilia, and axon signals were segmented using Otsu’s methods to threshold, followed by dilation and erosion operations to join fragmented structures, and finally filtered to remove small discrete objects with no biological relevance. Nuclei that were not part of the pyramidal neuron cell layer were removed by dilating the dense collection of nuclei, and subsequently retaining just the largest connected object (corresponding to pyramidal neuron cell layer). Only nuclei and associated cilia with the pyramidal neuron cell layer were included for downstream analysis steps. The central axes of segmented cilia and axon masks were computed (skeletonized), which also served to separate and identify distinct cilia. The cilia near the imaged volume boundaries or those which were associated with non-pyramidal neuron cell layer nuclei were excluded from further analyses. The synaptophysin and ADD1 puncta positions were determined by detecting their local signal maxima using a 3D Laplacian-of-Gaussian filter described previously ( Aguet et al., 2016 ). Nucleus centers were determined by eroding the segmented nuclei masks, followed by calculating the distance transformation and thresholded to separate touching nuclei. The centroids of these discrete eroded nuclei were used to define the centers of search for ADD1 puncta with varying radii between 1 - 8 μm. Axon-cilia and SERT+ synaptophysin-cilia distance 3D distance transformations of the nuclei, skeletonized axon, and synaptophysin masks were calculated and multiplied by the skeletonized cilia masks. The resulting mask encoded the distance information for the respective transformation mask in the medial axes of the cilia. As serotonergic varicosities are between 1 and 3 μm ( Alvarez et al., 1998 ), we used 2 μm between skeletonized cilia and skeletonized axons as the cutoff for axon-contacting and non-axon-contacting cilia. Subsequently, synaptophysin puncta within 1 μm of skeletonized serotonergic axon central axes are considered associated with serotonergic axons (SERT-positive). For the visualization of the distance-encoded cilia, the cilia central axes were dilated using a sphere morphological structural kernel with a radius of 1 pixel. The resulting volumes were then projected to only visualize the distance information using a custom lookup table ( Figure 2C ). Furthermore, the total cilia length and the corresponding distance to the closest axon was plotted as a 2D density scatter plot using MATLAB ( Chung, 2021 ) with a marker size set to 10 and a “jet” colormap ( Figure S3C ). Violin plots of cilium length for contacting and non-contacting cilia ( Figure S3D ) were generated using PlotsOfData ( Postma and Goedhart, 2019 ). Statistical comparison of the two groups were done in GraphPad Prism. Permutation tests to compare these two distributions were performed using Mlxtend in Python ( Raschka, 2018 ).
Quantification of ciliary 5-HTR6
Confocal datasets collected on Leica Stellaris (0.053 μm x 0.053 μm x 0.311 μm) were first downsampled to achieve isotropic voxels (0.311 μm). ADCY3 signals were first used to create ciliary masks by Otsu threshold method followed by dilation by 1 pixel. These masks were applied to the 5-HTR6_CF633 channel (2.3 ns) to calculate the integrated intensity of ciliary 5-HTR6_CF633. Total integrated intensity of 5_HTR6_CF633 was calculated by first thresholding using photon count 20 as the cutoff. The integrated ciliary 5-HTR6_CF633 intensity was then divided by the total 5-HTR6-CF633 integrated intensity to obtain the proportion of 5-HTR6 in the cilia.
Quantification of GRAB-HTR6 sensor measurements Plasma membrane-located GRAB-HTR6-PM sensor
Images collected by the Opera Phenix high-content screening system from cultured HEK293T cells were processed using ImageJ (1.53c) software (NIH) and analyzed using custom-written MATLAB (R2020b) codes. The fluorescence response (ΔF/F 0 ) was calculated using the formula (F–F 0 )/F 0 , in which F 0 is the baseline fluorescence signal after subtracting the background. The dose-response curve was plotted using OriginPro (2020b). On and off kinetics were calculated based on the exponential-function fitting in OriginPro (2020b). For specificity analysis, the fluorescence responses (ΔF/F 0 ) to different chemicals were corrected by subtracting the response to vehicle. Titration curve of GRAB-HTR6-cilia sensor The two channel images were first aligned using Zen Blue (Zeiss). Cilia were segmented using CiliaQ based on the JF552 channel ( Hansen et al., 2021 ). Per cilium GFP mean fluorescent intensities were then calculated for different concentrations. The fluorescence response (ΔF/F 0 ) was calculated using the formula (F–F 0 )/F 0 , in which F 0 is the baseline fluorescence signal after subtracting the background. The dose-response curve was plotted using Graphpad Prism 9.2. GRAB-HTR6-cilia with optogenetic stimulation The 4D stacks (xyzt) were projected onto single planes (xyt) by maximum intensity projection in Fiji/ImageJ. Cilia were segmented using CiliaQ ( Hansen et al., 2021 ). The first 10 time points, which often showed significant quenching, were discarded. A 1-μm circle at the contact site (ChrimsonR and non-ChrimsonR contacting cilia controls) or at the site at which the cilium is closest to a serotonergic axon (ChrimsonR non-contacting cilia) was used as the region of interest (ROI) to calculate mean intensity values over time after background substraction, which were then filtered with a 0.2 Hz low pass filter. The average intensity of the 10 time points prior to photostimulation was used as the baseline fluorescence intensity, or F 0 . The maximum, or peak ΔF/F 0 during photostimulation was used for statistical comparisons in different conditions using estimation statistics ( Ho et al., 2019 ). Low pass filtering, baseline fluorescence intensity calculations, and estimation statistics were done in a custom Python code. Traces of the time course were plotted using PlotTwist ( Goedhart, 2020 ). GRAB-HTR6-cilia with chemogenetic stimulation The 4D stacks (xyzt) were projected onto single planes (xyt) by maximum intensity projection in Fiji/ImageJ, and downsampled temporally by a factor of 2 to obtain one stack per 10 s (30 total stacks). Airyscan stacks were processed using Zen Black (auto-strength, 3D; Zeiss). Cilia were segmented using CiliaQ ( Hansen et al., 2021 ). A 1-μm circle at the contact site (hM3Dq or SNAP:JF522) or at the site at which the cilium is closest to a serotonergic axon (non-contacting hM3Dq) was used as the region of interest (ROI) to calculate mean intensity values over time after background substraction (ImageJ/Fiji). The average intensity of the first 5 time points prior to ligand application was used as the baseline fluorescence intensity, or F 0 . The average ΔF/F 0 during ligand stimulation was used for statistical comparisons in different conditions using estimation statistics ( Ho et al., 2019 ). Fluorescence intensity calculation, average ΔF/F 0 and estimation statistics were done using a custom Python code. Traces of the time course were plotted using PlotTwist ( Goedhart, 2020 ). HTR6-RhoA FRET analysis The 4D stacks (xyzt) were first projected onto single planes (xyt) by maximum intensity projection in Fiji/ImageJ. Datasets with bidirectional scanning artefacts (i.e., misalignment between two scanning directions in alternating lines), significant movement, and/or focus drifts were excluded. The donor channel was used to create a mask to segment the cilia (“cilia mask”) by using the “subtract background with smoothing paraboloid” command followed by Otsu thresholding in Fiji/ImageJ. The donor and sensitized emission intensity values were individually subtracted by using the mean intensity from an acellular area outside the cilium. These background-subtracted images were then masked using the cilia mask to isolate/segment cilia-specific signals. The FRET ratio was calculated by dividing the segmented sensitized emission by segmented donor emission. For direct ligand application experiments, FRET recordings were digitized at 4 Hz and filtered at 1 Hz with a low pass Fourier transform digital filter implemented in Origin (OriginLab Corporation). For uncaging experiments, the FRET data was processed with temporal averaging by a factor of 2. Change of the mean FRET ratio of the entire cilium was plotted using the Z plot function in Fiji/ImageJ and imported into Excel spreadsheets. The changes were visualized using PlotTwist ( Goedhart, 2020 ). ΔF/F 0 was calculated by using the mean FRET ratio at the beginning of the experiments as the baseline (frame 1 to 25 for direct ligand application, and 1 to 30 for uncaging experiments). Statistical testing of RhoA spikes were done in Prism 8 (GraphPad).
Ciliary-RhoA FLIM analysis
To calculate the fluorescence lifetime of unquenched and quenched donor, large populations of cells expressing the RhoA sensor were imaged, and fluorescence lifetimes were calculated by the n-exponential reconvolution fitting algorithm (2 exponential components) with pixel binning by a factor of 2 (Leica LAS X FLIM/FCS software v3.5). The fluorescence lifetime of quenched and unquenched donor was determined to be 1.3 and 2.7 ns, respectively. These numbers were then used for all subsequent fittings. To calculate representative RhoA sensor sGFP fluorescence lifetime per cilium, “FLIM Image Fit” was performed in the Leica LAS X FLIM/FCS software suite. The resulting datasets were rendered in 3D for visualization and exported as two-channel stacks, encoding photon counts and fluorescence lifetime, respectively. Subsequent imaging analyses were done in Python. For each stack, the channel encoding counts were used to segment cilia (Otsu and Yen thresholding were used for HEK cells and neurons, respectively). The segmented cilia were then used as masks to extract ciliary voxels from the FLIM channel. Voxels with less than 50 counts were discarded. An alpha distribution was fitted to the histogram of the FLIM channel, as it provided the best fitting among all 80 different statistical distributions tested. The peak of the alpha distribution was used as the mode, or the representative FLIM of a given cilium. Statistical comparisons of cilia from different cell types and states, and after stimulation were performed using estimation statistics ( Ho et al., 2019 ).
Quantification of histone acetylation and ATAC-see
Airyscan stacks (0.035 μm x 0.035 μm x 0.15 μm) were first downsampled to get isotropic voxels (0.15 μm x 0.15 μm x 0.15 μm). The Hoechst channel was then used to segment nuclei. Histone marker stainings and ATAC were divided against Hoechst intensity on a per voxel basis to obtain histone-to-DNA or ATAC-to-DNA ratios. To account for the depth dependence on the antibody penetration, a flat-field correction was performed prior to calculating intensity ratios. The flat field was calculated by taking the mean projection through the y axis to generate x-z planes for each antibody-stained channel. Each channel was first normalized then averaged. To prevent sudden variations in intensity (since the flat field was calculated using the 3D volumes), a 2D Gaussian filter (sigma=2) was applied and the resulting flat field image was averaged through the x axis, then normalized by the resulting max value to generate the z-plane intensity correction vector. Each antibody treated channel was normalized by the calculated flat field correction vector. Hoechst channel background was calculated using Otsu’s method where the input signal values to calculate the threshold were restricted to 90 th percentile of the image data. The ratio was not calculated in voxels where the Hoechst signal was lower than Otsu’s threshold. The stack histograms were plotted in Python with kernel density estimates. The mode of each condition is the peak of the kernel density estimate.
Materials availability
Plasmids generated in this study have been deposited to Addgene: pB-Tet-On-HTR6-RhoA sensor (ID: 189614), pB-Tet-On-Arl13b-RhoA sensor (ID: 189613), pAAV-Syn1-GRAB-HTR6-cilia (ID: 189615), pAAV-TPH2-Cre (ID: 189616), pAAV-TRE-HTR6-SNAPf-TRIP (ID: 189617). Sharing of the RPE-1 cells are limited by terms set by ATCC (American Type Culture Collection). Sharing of HEK239A cell lines are restricted by MTA.
EXPERIMENTAL MODEL AND SUBJECT DETAILS Mammalian cell culture hTERT
RPE-1 cells (ATCC CRL-4000, female) and HEK293A cells (female, gift from Dr. Asuka Inoue, Tohoku University, Japan; Schrage et al., 2015 ) were plated at ~20,000 cells/cm 2 on #1.5 12 mm coverslips in 24-wells, 1-chamber 35 mm glass-bottom dishes, or 4-chamber 35 mm glass-bottom dishes (all #1.5 cover glass, Cellvis) in 10% serum containing media (RPE-1: DMEM:F12 media, ATCC 30-2006; HEK293A: DMEM, low glucose, GlutaMax, pyruvate, Thermo Fisher Scientific #10567014; Day 0) at 37°C in 5% CO 2 . For HEK293A cells, dishes were coated with Matrigel (Corning Life Sciences) before plating. The next day (day 1), the cells were serum deprived with 0% FBS media with 100 ng/ml doxycycline to induce GRAB-HTR6-cilia, HTR6-RhoA, or Arl13b-RhoA expression. For HEK293A cells, 1 μM H-89 was also added to induce ciliogenesis. After 24 h of serum deprivation (day 2), GRAB-HTR6-cilia cells were labeled with 250 nM Janelia Fluor 552 (JF552) dye for 2 h. Cells were rinsed and placed back in serum-free media without doxycycline or H-89. Experiments were conducted at 48 to 96 h after serum deprivation (day 3 to 5). For plasma membrane serotonin sensor experiments (GRAB-HTR6-PM), HEK293T cells were cultured in DMEM (Gibco) supplemented with 10% (v/v) FBS (Gibco) and 1% penicillin-streptomycin (Gibco) at 37°C in 5% CO 2 . HEK293T cells were plated on 96-well or 24-well plates and transfected with a mixture of plasmids and PEI (300 ng plasmids and 900 ng PEI for each well in 96-well plates or 1 μg plasmids and 3 μg PEI for each well in 24-well plates) when the cells were grown to ~70% confluence. The medium was replaced after 4-6 h, and cells were used for imaging 24 h after transfection. For stable cell line creation, RPE-1 cells or HEK293A cells were transfected with the piggyBac hyperactive transposase vector (VectorBuilder) and HTR6-RhoA sensor, Arl13b-RhoA sensor or GRAB-HTR6-cilia vector concurrently with Lipofectomine 3000 (Thermo Fisher Scientific) at a 1:2.5 ratio and grown in 10% Tet-free FBS (Gemini) containing media. The cells were then selected by blasticidin at 10 μg/ml to create Tet-on HT6-RhoA sensor stable cells.
Primary hippocampal and raphe neuron culture
Hippocampi and midbrains were dissected from P0 Sprague-Dawley rat pups of both sexes. Rat maintenance and care followed policies advocated by NRC and PHS publications and approved by the Institutional Animal Care and Use Committee (IACUC), Janelia Research Campus. Tissues were digested with papain and gently triturated and filtered through a 40 μm filter. Neurons were electroporated (Lonza 4D-nucleofactor) with Tet-On Arl13b-RhoA (hippocampal neurons) or Tph2 -Cre (tryptophan hydroxylase 2-Cre, midbrain neurons) and plated in poly-D-lysine coated dishes and cultured in NbActiv4 (BrainBits) at 37°C and 5% CO 2 . A week after plating, the neuronal cultures were fed with B-27 plus neuronal culture system (Thermo Fisher Scientific). AAV transduction (Syn1-GRAB-HTR6-cilia, FLEX-on hM3DGq-DREADD, FLEX-on farnesylated SNAP, or FLEX-on tdTomato) were applied at DIV10. 100 ng/ml doxycycline was added at DIV 6 or DIV14 and removed the next day for Arl13b-RhoA experiments. Images were collected between DIV 9 and DIV 28 (Alr13b-RhoA, hippocampal culture only) or DIV21-35 (hippocampal and midbrain co-culture). JF552-STL (SNAP-labeled neurons) was applied the day prior to imaging (100 nM, 2 h).
Animals
Mice used in the study were between P14 (juvenile) and 4-months old (adult; see Figure Legends for the age/sex of each experiment). C57BL/6 and C57BL/6J mice were obtained from Charles River Laboratories and the Jackson Laboratory, respectively. Htr6 -EGFP knock-in mice were generated at the Institut Clinique de la Souris (Illkirch-Graffenstaden, France). Htr6 KO mice were generated at the Phenomin consortium (Institut Clinique de la Souris, Illkirch-Graffenstaden, France) by using CRISPR-Cas9. Htr6 exon 3 and 4 were targeted using two pairs of guide RNAs on each side of the targeted region. Both Htr6 -EGFP and Htr6 KO mice were on the C57BL/6 genetic background. All animal work was approved by the Boston Children’s Hospital Institutional Animal Care and Use Committee (IACUC 16-03-3138R), the Janelia Institutional Animal Care and Use Committee (IACUC 16–146 and 19-181), or the animal use and care guidelines of Montpellier University (France, authorization D34-172-4). No restrictions were imposed on food and water. Mice were housed under regular light:dark cycles and standard caging environments. For doxycycline induction experiments, mice were fed with doxycycline-containing food (2000 ppm, Animal Specialties and Provisions, modified from LabDiet 5053) for 1 week. Comparable results were obtained in both males and females ( Figures 2 , S1 , and S3 ). Littermates of the same sex were randomly assigned to experimental groups.
METHOD DETAILS Synthesis of PA-O-5-hydroxytryptamine (photoactivatable serotonin) N -Boc serotonin ( S1 , 60 mg, 217 μmol, 3.5 eq) and coumarin bromide ( S2 , 30 mg, 62.2 μmol, 1 eq) were dissolved in CH 3 CN (4 mL). K 2 CO 3 (potassium carbonate, 60 mg, 435 μmol, 2 eq) was added and the reaction was stirred at room temperature for 15 h. The reaction was concentrated under reduced pressure, the residue dissolved in EtOAc, then washed with water and saturated NaCl (aq), dried over MgSO 4 , and concentrated under reduced pressure. The material was purified using flash chromatography on silica gel (0–50% EtOAc/hexanes, linear gradient), which afforded 35 mg (83%) of compound S3 as a pale-yellow solid. Compound S3 (30 mg, 44.3 μmol) was dissolved in CH 2 Cl 2 (2 mL). Trifluoroacetic acid (TFA; 0.4 mL) was added and the reaction was stirred at room temperature for 2 h while shielded from light. Toluene (5 mL) was added, and the mixture was concentrated under reduced pressure. The residue was purified by reverse-phase HPLC using a gradient of CH 3 CN/H 2 O containing 0.1% v/v TFA as additive. 1H NMR (400 MHz, 1:1 CD3OD, CD3CN) δ 7.71 (s, 1H), 7.64 (d, J = 8.9 Hz, 1H), 7.31 (d, J = 8.9 Hz, 1H), 7.16 (d, J = 2.4 Hz, 1H), 7.13 (s, 1H), 6.93 (dd, J = 8.8, 2.5 Hz, 1H), 6.65 (dd, J = 9.0, 2.7 Hz, 1H), 6.52 (d, J = 2.6 Hz, 1H), 6.32 (s, 1H), 5.30 (s, 2H), 4.24 (s, 4H), 3.15 (t, J = 7.3 Hz, 2H), 3.01 (t, J = 7.3 Hz, 2H). HRMS (ESI) calculated for C 24 H 24 N 3 O 7 [M+H]+ 466.1609, was 466.1615. Design and cloning of RhoA and 5-HT sensors The piggyBac Tet-On HTR6-RhoA sensor was generated based on the published mScarlet-I based RhoA sensor ( Bindels et al., 2017 ). The mScarlet-I:sGFP2:RhoA and the cpPKN1 fragments were synthesized (Genscript) and cloned into piggyBac Tet-On vector Xlone HTR6-HaloTag ( Deo et al., 2019 ). The Xlone-Ar13b-RhoA sensor was subcloned by replacing HTR6 with ARL13B (VectorBuilder). To make GRAB-HTR6-PM, cpEGFP and linkers were PCR-amplified from GRAB NE ( Feng et al., 2019 ), and the cDNA encoding human 5-HTR6 was PCR-amplified from HTR6-Tango (a gift from Bryan Roth, Addgene 66414; RRID:Addgene_66414; Kroeze et al., 2015 ). Then, the chimeric GRAB sensor was cloned into the pDisplay vector (Invitrogen). Similar to other sensors based on the same platform, the N-terminus of this construct has an IgK leader sequence that serves as a plasma membrane targeting signal to further enhance the plasma membrane expression (see Methods S1 for full amino acid sequence). In addition, an IRES-mCherry-CAAX was added at the C-terminus to serve as a reference of membrane marker to calibrate the expression levels. GRAB-HTR6-cilia was made by cloning the GRAB-HTR6-PM (excluding the IgK leader sequence and IRES-mCherry-CAAX) with a 3xGGGGS-HaloTag at the C-terminus onto the Xlone backbone by VectorBuilder. The wild-type 5-HTR6 localized well to cilia ( Barbeito et al., 2021 ; Berbari et al., 2008 ) without the artificial IgK leader sequence. Since the sensor inherits the properties of 5-HTR6, it can still traffic well onto the ciliary membrane. Molecular Biology of AAV vectors Tph2 -Cre vector was generated by replacing GFP in Tph2 -GFP( Wan et al., 2016 ; gift from Dr. Björklund) with the Cre-recombinase in Syn1-EBFP-Cre AAV (gift from Hongkui Zeng, Addgene plasmid # 51507; RRID:Addgene_51507). pAAV-Syn-FLEX-rc[ChrimsonR-tdTomato] was a gift from Edward Boyden (Addgene plasmid # 62723; RRID:Addgene_62723). pAAV[FLEX-ON]-CAG-Farnesylated-SNAPtag AAV plasmid was made by VectorBuilder, Inc. pAAV-FLEX-ON-tdTomato was a gift from Edward Boyden (Addgene plasmid # 28306; RRID:Addgene_28306). pAAV-EF1a-DIO-hM3D(Gq)-mCherry was a gift from Bryan Roth (Addgene plasmid # 50460; RRID:Addgene_50460). pAAV-TRE-HTR6-SNAPf-TRIP and pAAV-Syn-Tet3G were made by VectorBuilder. Syn-Tet3G and TRE-HTR6-SNAPf-TRIP were packaged in AAV2/rh10 capsid, and the other viral vectors were packaged in the AAV2/PHP.eB capsid. All above viral vectors were made by the HHMI Viral Tools (Janelia). AAV phSyn1(S)-FLEX-tdTomato-T2A-SypEGFP-WPRE was a gift from Hongkui Zeng (Addgene viral prep # 51509-AAV1; http://n2t.net/addgene:51509 ; RRID:Addgene_51509). Intracranial injections of AAVs 8-week-old adult mice were anesthetized with 2.5%-3.0% isoflurane with an O 2 rate of 1L/min and mounted on a stereotaxic frame. The body temperature was maintained at 37°C using a heating pad. Mice were given buprenorphine (0.1 mg/kg) subcutaneously at 5 mg/kg of body weight. After shaving, a drill was used to create a small craniotomy hole (~1 mm). For CA1 pyramidal neuron layer injections, 200 nL of AAV mixture composed of AAV-rh10-Syn-Tet3G and AAV-rh10-TRE-HTR6-TRIP (1:2 ratio, 5×10 12 vg/ml and 10 13 vg/ml, respectively) were bilaterally injected at anteroposterior −2.25 mm relative to Bregma, mediolateral ±2 mm relative to Bregma; dorsoventral −1.43 mm relative to the skull surface at a rate of 50 nL/minute using a Nanoject II Injector (Drummond Scientific, USA) followed by 5 additional minutes to allow diffusion. For median raphe B8 injections, 750 nL of AAV mixture composed of AAV-php.eB- Tph2 -Cre and AAV-2/1-phSyn1-FLEX-tdTomato-T2A-SypEGFP (1:2 ratio, 5×10 12 vg/ml and 10 13 vg/ml, respectively) were injected at anteroposterior −4.4 mm relative to Bregma, mediolateral 0 mm relative to Bregma; dorsoventral −4.4 mm relative to the skull surface at a rate of 75 nL/minute using a Nanoject II Injector (Drummond Scientific, USA) followed by 5 additional minutes to allow diffusion. Upon recovery, mice were given Ketaprofen (5 mg/kg, subcutaneous) and placed back in the home cage. Ketoprofen (5 mg/kg, sub-cutaneous) was given once a day for additional two days post-surgery.
Immunofluorescence and imaging
For cultured cells, #1.5 coverslips were first fixed in 4% paraformaldehyde (PFA) in PBS overnight at 4°C. Samples were then rinsed in PBS for 5 min x 3. After permeabilization with 0.3% Triton-X in PBS for 30 min, samples were blocked with 5% normal goat serum (NGS) in PBS for 1 h. 5% NGS was then replaced with primary antibody containing solution in 1% BSA in PBS with 2 mM sodium azide overnight at 4°C. After rinsing in PBS for 5 min x 3, samples were stained with secondary antibody and Hoescht 33342 for 2 h. For Trio staining, the samples were stained according to the Alexa tyramide amplification system with the SuperBoost protocol (Thermo Fisher Scientific). Samples were then rinsed in PBS for 5 min x 2 /Milli-Q water 5 min x 1 and mounted on Vectashield Vibrance (Vector Laboratories) or Prolong Fade Glass (Thermo Fisher Scientific). For mouse brain samples, mice were deeply anesthetized with isoflurane inhalation or ketamine/xylazine (200 mg/kg ketamine and 20 mg/kg xylazine) intra-peritoneal injection and intracardially perfused with 4% PFA in phosphate-buffered saline (PBS). The brains were removed and post-fixed in 4% PFA in PBS overnight at 4°C. Samples were then rinsed in PBS x3, 15 min each. Serial sections of 50 μm or 200 μm were obtained on a vibratome. For 50 μm mouse brain sections, fixed slices were incubated at room temperature in 0.3% Triton-X in PBS overnight, followed by 5 h in blocking buffer (BlockAid, Thermo Fisher Scientific), overnight in primary antibody, and again overnight in secondary antibody and Hoechst 33342 (2 μg/ml). Both primary and secondary antibodies were diluted in the same blocking buffer (BlockAid, Thermo Fisher Scientific). The stained sections were then rinsed in PBS 15 x 2 times/300 mOsm glycerol 15 min x 1 and mounted in ProLong Fade Glass or SlowFade Glass (Thermo Fisher Scientific). Between antibodies, slices were washed x3, 15 min each with PBS. For 200 μm mouse brain sections, slices were first treated with the epoxide-crosslinker as in the SHIELD protocol (Life Canvas Technology, Park et al., 2018 ). Afterwards, sections were incubated in 2% Triton-X in PBS with 2 mM sodium azide for 3 days for permeabilization. Sections were then incubated in primary and secondary antibodies for 2 days at room temperature, respectively. After washing, sections were mounted in SlowFade Glass (Thermo Fisher Scientific). The following primary antibodies were used: rabbit anti-GFP (Chromotek PABG1, 1:1000), guinea-pig anti-SERT (synaptic systems 340004, 1:200), mouse anti-ADCY3 (Encor Biotechnology MCA-1A12, 1:1000), rabbit anti-PCP4 (Millipore Sigma, HPA005792, 1:500), chicken anti-rootletin (Millipore Sigma, ABN1686, 1:1000), rabbit anti-ADD1 (Abcam EP734Y, #ab40760, 1:250), rabbit anti-synaptophysin (Cell Signaling, #36406, 1:100), rabbit anti-synaptophysin (Thermo Fisher Scientific, MA5-14532, 1:200), rabbit anti-Trio GEFD2 (custom antibody, gift from Dr. Susanne Schmidt, 1:500), rabbit anti-H4K5ac (Thermo Fisher Scientific MA5-32009, 1:250), mouse anti-panH4ac (Thermo Fisher Scientific MA3-066, 1:250), rabbit anti-H3K27ac (Abcam ab177178, 1:7000). The following secondary antibodies and dyes were used: Alexa Fluor Plus 488 goat anti-rabbit (1:1000, Thermo Fisher Scientific), CF488A donkey anti-guinea pig (1:1000, Biotium), Alexa Fluor Plus 555 goat anti-rabbit (1:1000, Thermo Fisher Scientific), CF555 goat anti-mouse IgG 1 (1:1000, Thermo Fisher Scientific), CF633 goat anti-mouse IgG 1 (1:1000, Biotium), CF633 donkey anti-rabbit IgG 1 (1:1000, Biotium), Hoescht 33342 (10 μg/ml, Thermo Fisher Scientific), SuperBoost goat anti-rabbit polyHRP (ready-to-use 1x concentration, Thermo Fisher Scientific). Confocal imaging was done either on a Zeiss 880/980 Laser Scanning Confocal Microscope (LSM) or Leica Stellaris with FLIM. The Zeiss systems are equipped with a Plan-Apochromat 63x/1.4 oil, 40x/1.2 multi-immersion LD LCI Plan-Apochromat, and 20x/0.8 air Plan-Apochromat objective; ZEN Black and Blue software. Hoechst 3342 was excited by 405 nm laser light and the spectral detector set to 409-481 nm. Alexa 488/CF488 was excited by 488 nm laser light and the spectral detector set to 490-545 nm. Alexa 555 was excited by 561 nm laser light and the spectral detector set to 570-642 nm. ATTO-590 was excited by 594 nm laser light (Airyscan only). CF633 was excited with 633 nm light and the spectral detector set to 642-755 nm. The spectral detector was only used for non-Airyscan confocal scanning imaging sessions. The Leica Stellaris is equipped with a 20x air HC PL APO 20x/0.75 CS2 and HC PL APO 63x/1.4 oil-immersion objectives; Las X software. Alexa 488 was excited at 499 nm and imaged with the HyD X2 detector set to a 504 - 548 nm window. CF555 was excited at 553 nm and imaged with the HyDS3 detector set to a 558 - 633 nm window. CF633 was excited at 629 nm and imaged with the HyDX4 detector set to a 637 - 750 nm window. All detectors were set in photon counting mode, and the pulsed white light laser was set at 80 MHz. With the CF633 channel, the average photon arrival time was used to separate autofluorescence background (peak at 0.3 ns) and CF633 signal (peak at 2.3 ns). Adaptive deconvolution was performed using Leica Lightning processing with smoothing set to “very low” and without cutoff or auto-contrast.
Electron microscopy of CA1 pyramidal neuron cilia
Conventional chemical fixation protocol
Mice were anesthetized with ketamine/xylazine (200 mg/kg ketamine and 20 mg/kg xylazine) intra-peritoneal injection and perfused with a solution of 2% PFA and 2% glutaraldehyde in 0.1 M sodium cacodylate buffer, 0.2 mM CaCl 2 . The brain samples were dissected and post-fixed in the perfusion solution overnight at 4°C. After rinsing with 0.1M sodium cacodylate buffer, 300 μm serial sections were obtained on a vibratome. The tissue was then immersed in 1% osmium tetroxide and 1.5% potassium ferricyanide in a 0.1 M cacodylate buffer for 1 h. After rinsing in 0.1 M sodium cacodylate buffer, the sections were further stained with 1% osmium tetroxide in water for 1 h, followed by 2% uranyl acetate in maleate buffer (pH = 5.15) overnight at 4°C. The tissue was then washed in water, dehydrated with graded ethanol, and embedded in Epon812 resin. Epon-812 flat-embedded mouse hippocampal CA1 samples were first mounted on an aluminum stub. The sample surface was polished on an ultramicrotome, followed by carbon coating (20 nm). The samples were then imaged on the Zeiss Crossbeam 540 at 5-6 nm pixel size with 15-20 nm milling using ATLAS 5 software (Zeiss). Hybrid protocol 2 - 3-month-old male C57/BL6 mice were deeply anesthetized and transcardially perfused with 30 mL of 3% PFA (60 mM NaCl, 130 mM glycerol, 10 mM sodium phosphate buffer). The brain was carefully dissected from the skull and post-fixed with 50 mL of 3% PFA (30 mM NaCl, 70 mM glycerol, 30 mM PIPES buffer, 10 mM betaine, 2 mM CaCl 2 , 2 mM MgSO 4 ) at room temperature for 2 h. The brain sample was then rinsed in a 400 mOsM buffer (65 mM NaCl, 100 mM glycerol, 30 mM PIPES buffer, 10 mM betaine, 2 mM CaCl 2 , and 2 mM MgSO 4 ) for 0.5 h, followed by vibratome sectioning (coronal sections, 100 μm thickness) using a Leica VT1000S vibratome in the same buffer. 100 μm sections were then fixed in 1% PFA, 2% glutaraldehyde solution (30 mM NaCl, 70 mM glycerol, 30 mM PIPES buffer, 10 mM betaine, 2 mM CaCl 2 , 2 mM MgSO 4 , 75 mM sucrose) overnight at 4°C. Sections were then washed using the 400 mOsM rinsing buffer (see above). Round samples of the hippocampus were created from the 100 μm coronal sections using a 2 mm biopsy punch (Miltex). The 2 mm samples were dipped in 1-Hexadecene, placed in a 100 μm aluminum carrier, covered with a flat carrier and high-pressure frozen using a Wohlwend compact high-pressure freezer (Wohlwend GmbH, Switzerland). Samples were then freeze-substituted in 0.5% osmium tetroxide, 20 mM 3-amino-1,2,4-triazole or 20 mM imidazole, 0.1% uranyl acetate, 4% water in acetone, using a Leica AFS2 system. Specimens were further dehydrated in 100% acetone and embedded in Durcupan resin. Two datasets were acquired using the hybrid protocol, stained with either osmium-imidazole or osmium-3-amino-1,2,4-triazole. The samples were mounted on a copper post and trimmed to the Region of Interest (ROI), guided by X-ray tomography data obtained by a Zeiss Versa XRM-510. The samples were coated with a thin layer of 10-to 20-nm gold and 50-to 100-nm carbon and imaged by a customized Zeiss Merlin FIB-SEM or NVision40 FIB-SEM system using 8 nm pixel size with 2 or 4 nm of milling depth. After alignment using a Scale Invariant Feature Transform (SIFT) based algorithm ( Lowe, 2004 ), the stacks were binned by a factor of 2 or 4 along z to form a final isotropic volume of 35 μm x 35 μm x 40 μm and 50 μm x 50 μm x 44 μm with 8 nm x 8 nm x 8 nm voxels. The electron microscopy datasets generated above were manually segmented using VAST (Volume Annotation and Segmentation Tool, Berger et al., 2018 ). Segmented results were exported as obj files, and rendered using 3ds Max 2021 (Autodesk, Inc.). For synaptic vesicles in Figure 2E , the centroids of segmented vesicles were calculated in 3D, and 40 nm spheres were generated as 40 nm spheres in 3ds Max. The hybrid protocol was developed for this work, which were used to generate two enhanced FIB-SEM datasets in the CA1 area to examine primary cilia. Prior to the completion of this manuscript, these datasets have been shared with others to examine lipid droplets ( Ioannou et al., 2019 ), myelin distribution along large axons ( Gao et al., 2019 ), and mitochondrial morphology ( Delgado et al., 2019 ).
Characterization of the GRAB-HTR6-PM sensor
For dose-dependent curve and selectivity tests, HEK293T cells expressing the GRAB-HTR6-PM sensor were imaged by the Opera Phenix high-content screening system. Before imaging, the culture medium was replaced with 100 μL Tyrode’s solution consisting of (in mM): 150 NaCl, 4 KCl, 2 MgCl 2 , 2 CaCl 2 , 10 HEPES and 10 glucose (pH 7.4). For imaging, a 40x/1.1-NA water-immersion objective, a 488-nm laser combined with a 525/50-nm emission filter for excitation and collection of the GFP fluorescence signal, and a 561-nm laser combined with a 600/30-nm emission filter for the collection of the mCherry fluorescence signal were used. The same field of views (FOVs) were imaged without or with 5-HT (at various concentrations, in Tyrode’s solution), respectively. The fluorescence signal of the GRAB-HTR6-PM sensor was calibrated using the ratio of GFP to mCherry. For kinetics measurement, we used an inverted Ti-E A1 confocal microscope (Nikon) equipped with a 40x/1.35 numerical aperture oil-immersion objective, a 488-nm laser and a 561-nm laser. GFP and mCherry fluorescence was collected using a 525/50-nm emission filter and a 595/50-nm emission filter, respectively. HEK293T cells were bathed in a chamber containing Tyrode’s solution. To measure the sensor kinetics, a glass pipette was positioned close to the sensor-expressing cells and the fluorescence signals were measured using confocal high-speed line scanning mode (scanning speed 1024 Hz). For on kinetics, 100 μM 5-HT was puffed from the pipette. For off kinetics, 100 μM HTR6 antagonist SB 271046 was puffed onto cells bathed in 1 μM 5-HT. The basal fluorescent intensity of GRAB-HTR6-PM before 5-HT applications was used as F 0 for calculating the ‘on’ response, while the fluorescence intensity under 1 μM 5-HT was set as F 0 for calculating the ‘off’ response. Measurements of the GRAB-HTR6-cilia sensor GRAB-HTR6-cilia titration curve Serum deprived, JF552 labeled RPE-1 cells stably expressing GRAB-HTR6-cilia were imaged in a HEPES-buffered imaging media (140 mM NaCl, 20 mM HEPES, 2.5 mM KCl, 1.8 mM CaCl 2 , 1.0 mM MgCl 2 , pH = 7.4, mOsm = 300; Live Cell Imaging Solution, Thermo Fisher Scientific A14291DJ) using a 20x air Plan-Apochromat objective (Zeiss, NA = 0.8) with FAST Airyscan on a Zeiss 880 confocal microscope at 37°C. GFP and JF552 were excited with 488 nm and 561 nm lasers, respectively. Keeping the same field of view, z stacks were acquired at different concentrations of 5-HT diluted in the same imaging buffer.
GRAB-HTR6-cilia with optogenetic stimulation
Hippocampal neurons expressing GRAB-HTR6-cilia and serotonergic neurons expressing ChrimsonR-tdTomato, farnesylated SNAP-Tag:JF552, or tdTomato were imaged with a 40x multi-immersion LD LCI Plan-Apochromat objective (Zeiss, NA = 1.2; silicone oil was used as the immersion media) on a Zeiss LSM 880 microscope in artificial cerebral spinal fluid (NaCl 124 mM, KCl 2.5 mM, NaH 2 PO 4 1.2 mM, NaHCO 3 24 mM, HEPES 5 mM, glucose 12.5 mM, MgSO 4 2mM, CaCl 2 2mM, Ting et al., 2018 ) at 37°C. Two-channel FAST Airyscan images were first imaged to characterize the axociliary synapses using 488 nm or 561 nm excitations for GFP and red fluorophores, respectively. GRAB-HTR6-cilia was then imaged at 1 Hz using the 488 nm laser with z-stacks. After 30 s, the 594 nm laser line was used to photostimulate at the same 1 Hz frequency (2 mW, 25 μm x 25 μm square, repetition = 1, pixel dwell time = 0.55 μs). A total of 120 z-stacks were acquired per cilium (120 s). Airyscan stacks were processed using Zen Black (auto-strength, 3D; Zeiss).
GRAB-HTR6-cilia with chemogenetic stimulation
Hippocampal neurons expressing GRAB-HTR6-cilia and serotonergic neurons expressing hM3Dq or farnesylated SNAP-Tag:JF552 were imaged with a 40x multi-immersion LD LCI Plan-Apochromat objective (Zeiss, NA = 1.2; silicone oil was used as the immersion media) on a Zeiss LSM 880 microscope in artificial cerebral spinal fluid (NaCl 124 mM, KCl 2.5 mM, NaH 2 PO 4 1.2 mM, NaHCO 3 24 mM, HEPES 5 mM, glucose 12.5 mM, MgSO 4 2mM, CaCl 2 2mM, Ting et al., 2018 ) at 37°C. Two-channel FAST Airyscan images were first imaged to characterize the axociliary synapses using 488 nm, 561 nm, or 594 nm excitations for GFP, JF552, and mCherry, respectively. GRAB-HTR6-cilia were then imaged at every 5 s using the 488 nm laser with z-stacks. After 1 min, 10 nM DCZ was directly added to the imaging media. A total of 60 z-stacks were acquired per cilium (3 min).
HTR6-RhoA FRET measurements
Images were collected using silicone-oil immersion media with a 40x multi-immersion LD LCI Plan-Apochromat objective (Zeiss, NA = 1.2; silicone oil immersion media) on a Zeiss LSM 880 microscope. Single apical cilia were imaged at zoom 10 with 4 Airy units (146 μm pinhole), 212 x 212 frame size, 0.1 μm pixel size, 0.93 μs pixel dwell time, 16-bit bidirectional scanning, and 4 optical sections (1.8 μm) to cover the entire length of the cilium. The resulting temporal resolution was 0.25 s. The donor fluorophore, sGFP2 was excited by the 488 nm laser. Donor emission from mScarlet-I was collected with the spectral detector set to 490-550 nm. Acceptor-sensitized emission was collected with the spectral detector set to 570-650 nm. For uncaging experiments, the following uncaging parameters were used on a 5 μm radius circle adjacent to the ciliary tip: repeat each stack x10 using the same pixel dwell time as during scanning. Two experiment blocks (400 time frames each) were used to acquire data with and without uncaging. Uncaging started at frame 20 in the first block, with no uncaging during the second block. Ciliary-RhoA FLIM measurements 3D z-stacks covering entire cilia were collected at 5 min intervals using an 40x oil immersion Plan-Apochromat objective (Leica, NA = 1.3) on a Leica SP8 Falcon microscope at 2x the Nyquist limit and 1 Airy disc. Donor sGFP fluorescence was excited by a pulsed (40 MHz) white light laser tuned at 488 nm, and emitted photons between 490 nm and 550 nm were collected with line repetition = 8. ATAC-see staining in brain sections Transposase-mixture solution (hyperactive Tn5 transposase with ATTO-590 conjugated oligos) were prepared as described previously ( Chen et al., 2016 ). 50 μm thick, PFA-fixed CA1 coronal sections from 4-month-old C57BL/6 wild-type, Htr6 KO, non-doxycycline-treated control, and doxycycline-treated HTR6-TRIP mice were obtained using the same method as described above. A 3 mm punch of the CA1 area was created using a biopsy punch on the 50 μm thick sections (Electron Microscopy Sciences). These punches were permeabilized in 0.3% Triton/PBS overnight at RT followed by 0.1% Triton, 0.1% Tween-20, and 0.01% digitonin in 10 mM Tris-HCL, 1 mM NaCl, 1.5 mM MgCl 2 buffer (ATAC-RSB, or ATAC-Resuspension buffer) for 2 hrs. The samples were then rinsed in 0.1% Tween-20 in ATAC-RSB for 3 times and incubated in the transposase-mixture solution (100 nM Tn5 transposase, 10 mM Tris-HCl pH 7.5, 5 mM MgCl 2 , 33% PBS, 0.01% digitonin, 0.1% Tween-20, 8% PEG8000) for 2 h at 37°C on a shaker. After incubation, the samples were washed x 3 for 15 min at 55 °C with 1 × PBS containing 0.01% SDS and 50 mM EDTA, followed by regular PBS at room temperature for 15 min. The samples were subsequently stained with Hoechst 33342 (10 ug/ml) for 2 h, rinsed in PBS 15, and mounted in Slow Fade Glass (Thermo Fisher Scientific). Non-doxycycline-treated control and doxycycline-treated HTR6-TRIP samples were also stained with ADCY3 and CF633.
Conventional chemical fixation protocol
Mice were anesthetized with ketamine/xylazine (200 mg/kg ketamine and 20 mg/kg xylazine) intra-peritoneal injection and perfused with a solution of 2% PFA and 2% glutaraldehyde in 0.1 M sodium cacodylate buffer, 0.2 mM CaCl 2 . The brain samples were dissected and post-fixed in the perfusion solution overnight at 4°C. After rinsing with 0.1M sodium cacodylate buffer, 300 μm serial sections were obtained on a vibratome. The tissue was then immersed in 1% osmium tetroxide and 1.5% potassium ferricyanide in a 0.1 M cacodylate buffer for 1 h. After rinsing in 0.1 M sodium cacodylate buffer, the sections were further stained with 1% osmium tetroxide in water for 1 h, followed by 2% uranyl acetate in maleate buffer (pH = 5.15) overnight at 4°C. The tissue was then washed in water, dehydrated with graded ethanol, and embedded in Epon812 resin. Epon-812 flat-embedded mouse hippocampal CA1 samples were first mounted on an aluminum stub. The sample surface was polished on an ultramicrotome, followed by carbon coating (20 nm). The samples were then imaged on the Zeiss Crossbeam 540 at 5-6 nm pixel size with 15-20 nm milling using ATLAS 5 software (Zeiss).
Hybrid protocol 2 - 3-month-old male C57/BL6 mice were deeply anesthetized and transcardially perfused with 30 mL of 3% PFA (60 mM NaCl, 130 mM glycerol, 10 mM sodium phosphate buffer). The brain was carefully dissected from the skull and post-fixed with 50 mL of 3% PFA (30 mM NaCl, 70 mM glycerol, 30 mM PIPES buffer, 10 mM betaine, 2 mM CaCl 2 , 2 mM MgSO 4 ) at room temperature for 2 h. The brain sample was then rinsed in a 400 mOsM buffer (65 mM NaCl, 100 mM glycerol, 30 mM PIPES buffer, 10 mM betaine, 2 mM CaCl 2 , and 2 mM MgSO 4 ) for 0.5 h, followed by vibratome sectioning (coronal sections, 100 μm thickness) using a Leica VT1000S vibratome in the same buffer. 100 μm sections were then fixed in 1% PFA, 2% glutaraldehyde solution (30 mM NaCl, 70 mM glycerol, 30 mM PIPES buffer, 10 mM betaine, 2 mM CaCl 2 , 2 mM MgSO 4 , 75 mM sucrose) overnight at 4°C. Sections were then washed using the 400 mOsM rinsing buffer (see above). Round samples of the hippocampus were created from the 100 μm coronal sections using a 2 mm biopsy punch (Miltex). The 2 mm samples were dipped in 1-Hexadecene, placed in a 100 μm aluminum carrier, covered with a flat carrier and high-pressure frozen using a Wohlwend compact high-pressure freezer (Wohlwend GmbH, Switzerland). Samples were then freeze-substituted in 0.5% osmium tetroxide, 20 mM 3-amino-1,2,4-triazole or 20 mM imidazole, 0.1% uranyl acetate, 4% water in acetone, using a Leica AFS2 system. Specimens were further dehydrated in 100% acetone and embedded in Durcupan resin. Two datasets were acquired using the hybrid protocol, stained with either osmium-imidazole or osmium-3-amino-1,2,4-triazole. The samples were mounted on a copper post and trimmed to the Region of Interest (ROI), guided by X-ray tomography data obtained by a Zeiss Versa XRM-510. The samples were coated with a thin layer of 10-to 20-nm gold and 50-to 100-nm carbon and imaged by a customized Zeiss Merlin FIB-SEM or NVision40 FIB-SEM system using 8 nm pixel size with 2 or 4 nm of milling depth. After alignment using a Scale Invariant Feature Transform (SIFT) based algorithm ( Lowe, 2004 ), the stacks were binned by a factor of 2 or 4 along z to form a final isotropic volume of 35 μm x 35 μm x 40 μm and 50 μm x 50 μm x 44 μm with 8 nm x 8 nm x 8 nm voxels. The electron microscopy datasets generated above were manually segmented using VAST (Volume Annotation and Segmentation Tool, Berger et al., 2018 ). Segmented results were exported as obj files, and rendered using 3ds Max 2021 (Autodesk, Inc.). For synaptic vesicles in Figure 2E , the centroids of segmented vesicles were calculated in 3D, and 40 nm spheres were generated as 40 nm spheres in 3ds Max. The hybrid protocol was developed for this work, which were used to generate two enhanced FIB-SEM datasets in the CA1 area to examine primary cilia. Prior to the completion of this manuscript, these datasets have been shared with others to examine lipid droplets ( Ioannou et al., 2019 ), myelin distribution along large axons ( Gao et al., 2019 ), and mitochondrial morphology ( Delgado et al., 2019 ).
Supplementary Material Video S1 Methods S1 3
📊 Figures
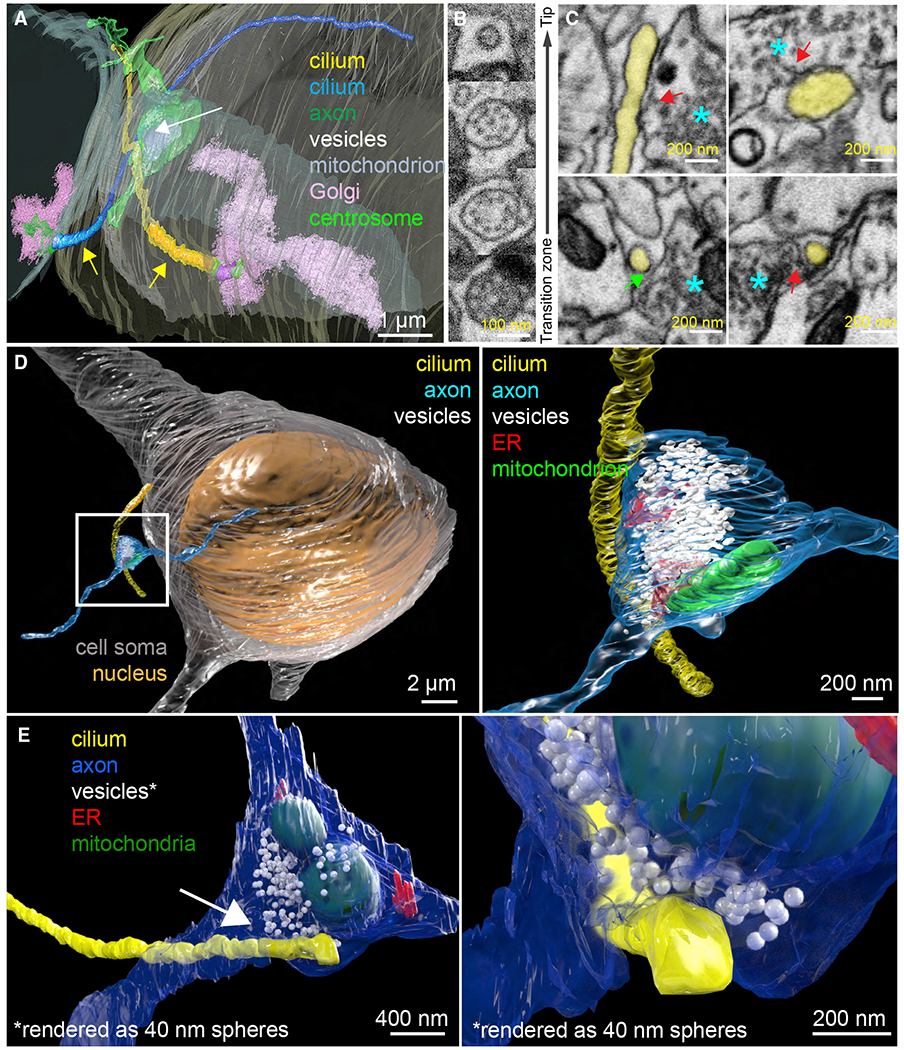
Figure 1.
FIB-SEM reveals axo-ciliary synapses
(A) Two complete cilia (yellow and blue) arise from the basal bodies (mother centrioles: purple; centrosomes: bright green), which are surrounded by Golgi-related vesicles and Golgi stacks (pink). The...
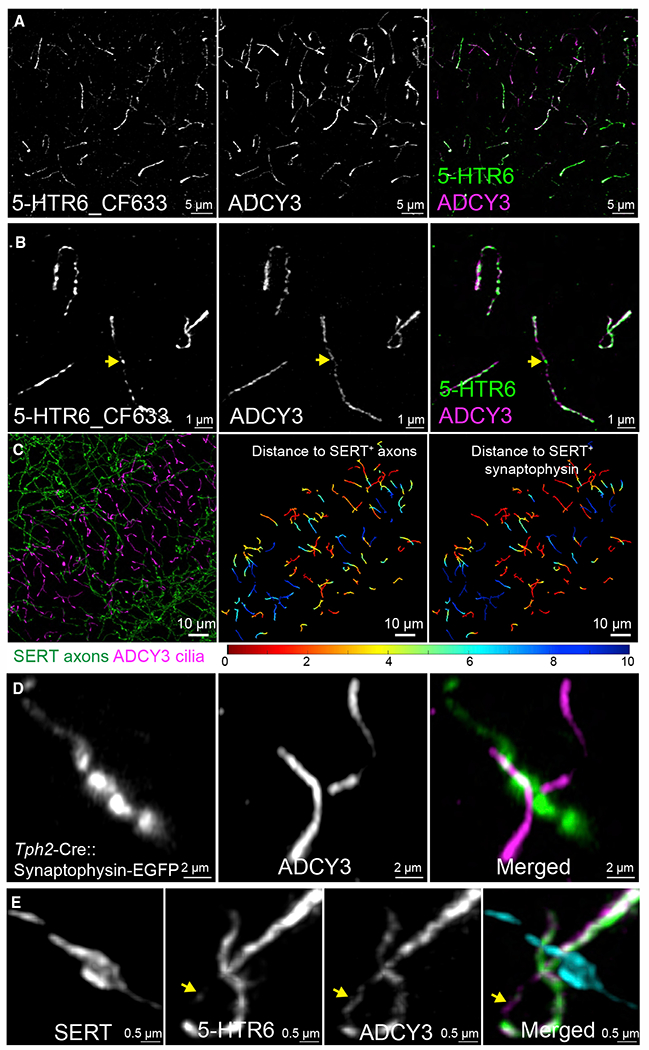
Figure 2.
5-HTR6-primary cilia are in contact with serotonergic axonal varicosities
(A) HTR6 (labeled by CF633, green in merged panel) is highly enriched in CA1 neuronal primary cilia (ADCY3, magenta in the merged panel: 20 u03bcm MIP). (B) Magnified images from (A). 5-HTR6s are not ...
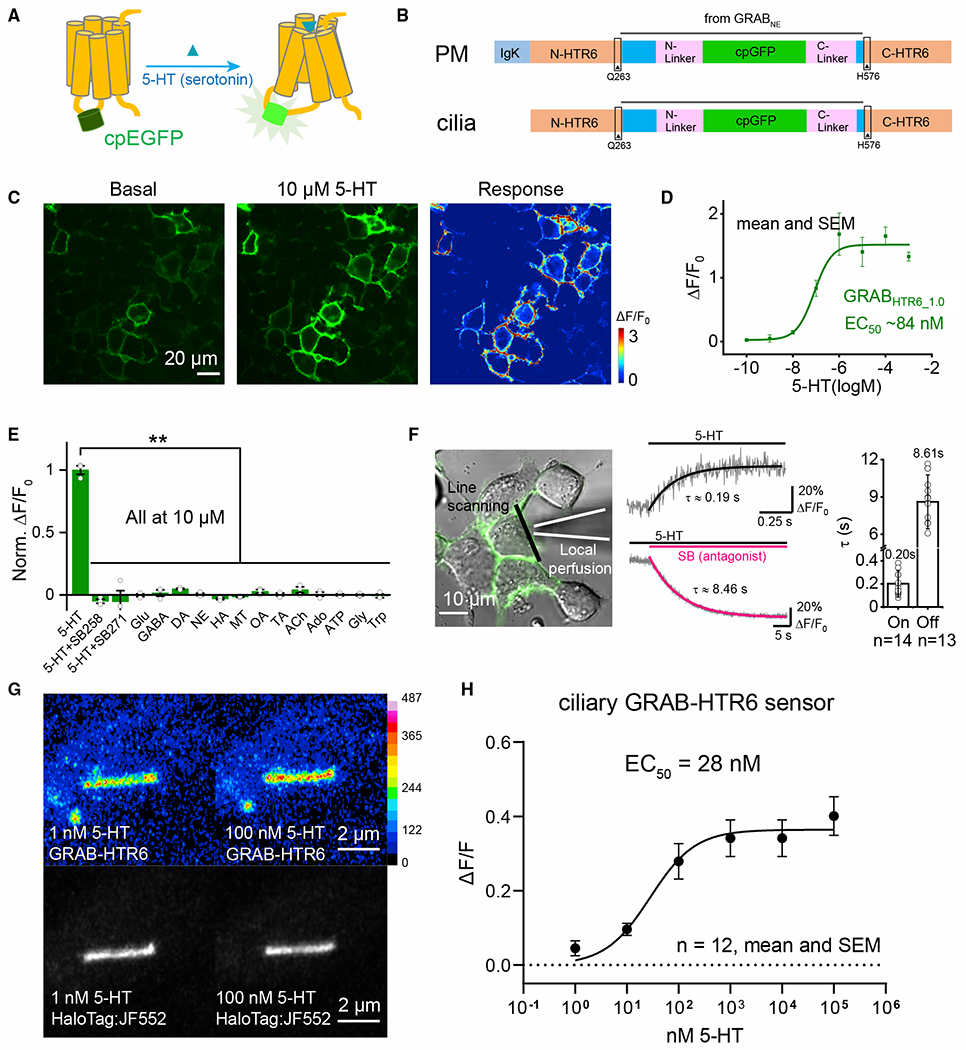
Figure 3.
Engineering a 5-HTR6 receptor cilia-targeted sensor
(A) A circularly permutated EGFP (cpEGFP) was inserted into the 3rd intracytoplasmic loop of 5-HTR6. Upon ligand binding, a conformational change of the receptor increases EGFP fluorescence. (B) Schem...
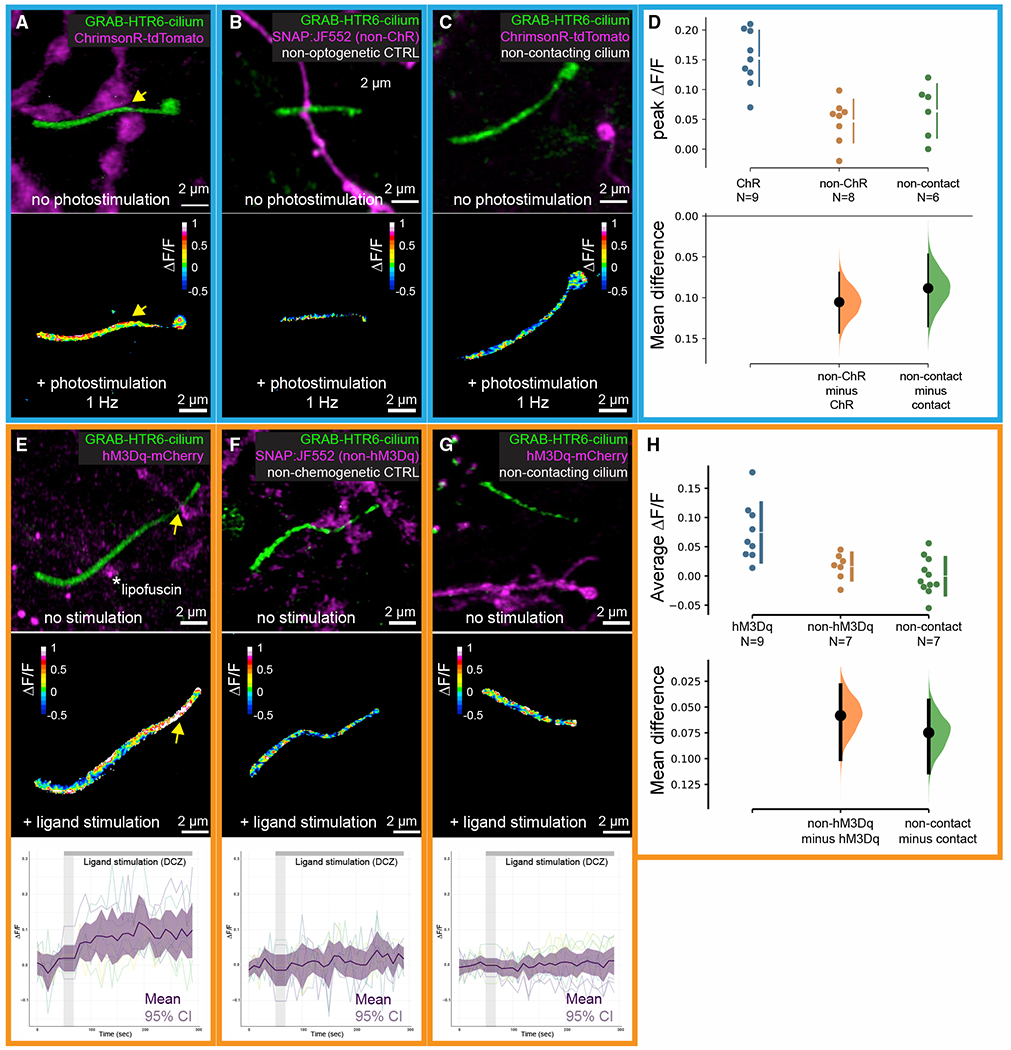
Figure 4.
Serotonergic axon activation releases serotonin onto cilia
(Au2013C) Top: a cilium expressing the HTR6-GRAB-cilia sensor in contact with a ChrimsonR-tdTomato-serotonergic axon (ChR, A), in contact with a SNAP:JF552-labeled serotonergic axon (non-ChR control, ...
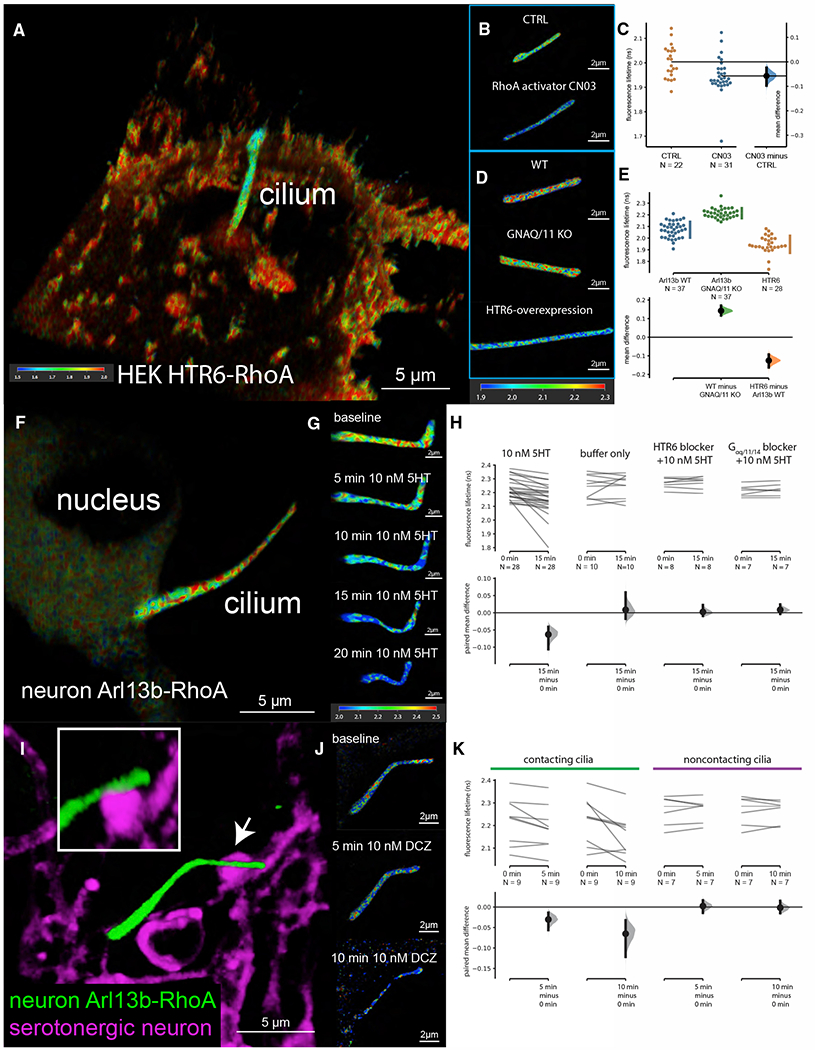
Figure 5.
Serotonin stimulation of ciliary HTR6 activates RhoA in cilia
(A) HEK293A cells stably expressing the HTR6-RhoA FRET/FLIM sensor. A single cilium arises from the cell soma. (B and C) Cilia-targeted Arl13b-RhoA sensor responds to RhoA activation. Mean difference ...
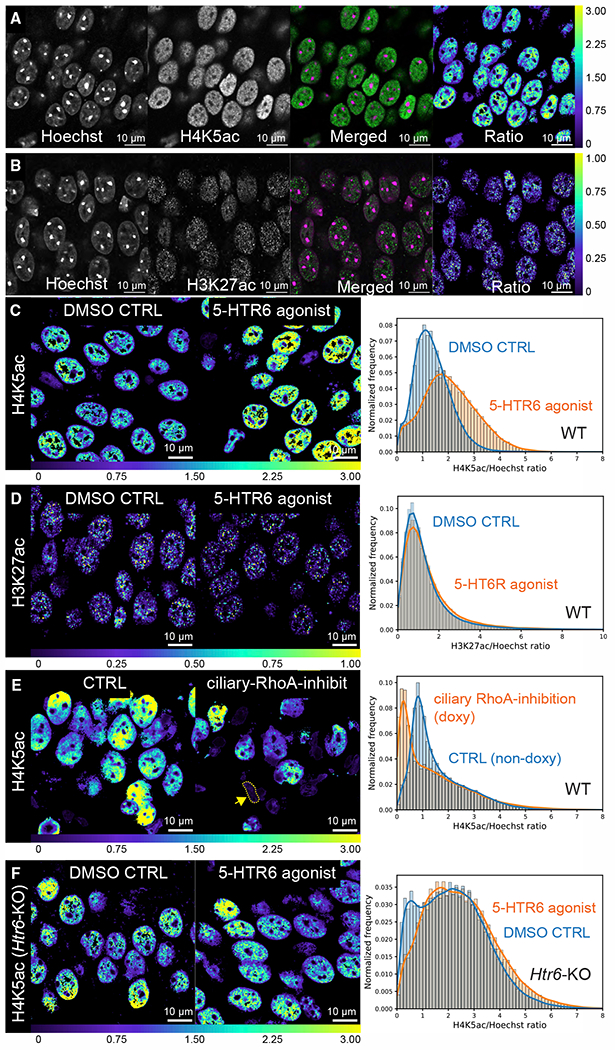
Figure 6.
5-HTR6 signaling modulates H4K5 acetylation
(A and B) Ratiometric measurements of H4K5ac (A) and H3K27ac levels in fixed mouse brain sections (B). Monoclonal antibodies against H4K5ac and H3K27ac were used to detect histone lysine acetylation (...
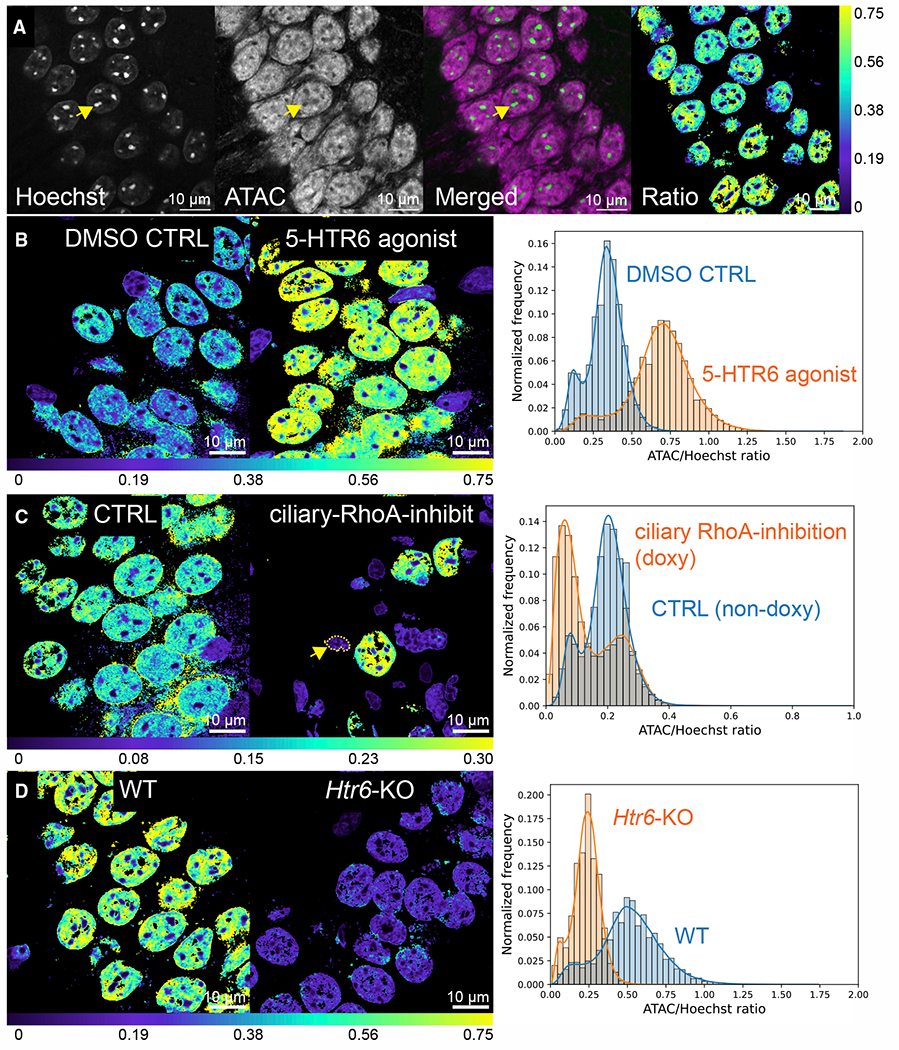
Figure 7.
5-HTR6 signaling modulates chromatin accessibility
(A) Measurements of chromatin accessibility (ATAC-see) normalized against Hoechst (green) on per voxel bases (right panel). Representative single optical Airyscan section of CA1 pyramidal neurons show...
Figure images are served from the NIH/NLM PubMed Central Open Access Subset or Europe PMC; copyright remains with the publishers and authors.
💬 Discussion
0 commentsNo comments yet. Be the first to start a discussion!
Leave a Comment