Abstract
CAMSAP and Patronin family members regulate microtubule minus-end stability and localization and thus organize noncentrosomal microtubule networks, which are essential for cell division, polarization and differentiation. Here, we found that the CAMSAP C-terminal CKK domain is widely present among eukaryotes and autonomously recognizes microtubule minus ends. Through a combination of structural approaches, we uncovered how mammalian CKK binds between two tubulin dimers at the interprotofilament interface on the outer microtubule surface. In vitro reconstitution assays combined with high-resolution fluorescence microscopy and cryo-electron tomography suggested that CKK preferentially associates with the transition zone between curved protofilaments and the regular microtubule lattice. We propose that minus-end-specific features of the interprotofilament interface at this site serve as the basis for CKK's minus-end preference. The steric clash between microtubule-bound CKK and kinesin motors explains how CKK protects microtubule minus ends against kinesin-13-induced depolymerization and thus controls the stability of free microtubule minus ends.
🔬 Techniques
🧬 Organisms
💻 Software
✨ Fluorophores
🧪 Sample Preparation
🔬 Cell Lines
🏭 Microscope Brands
🧪 Reagent Suppliers
📷 Detectors
🔎 Objectives
🎨 Filters
💻 Software Details
💾 Data Repositories
🏛️ Research Organizations (ROR)
Affiliated research institutions:
📋 Methods
Sequence analysis
For the detection of CKK homologs BLASTP/PSI-BLAST 50 and phmmer/jackhmmer 51 searches were performed online across the nr and UniProt databases, respectively, taking different sequences as query. Based on these hits, a multiple sequence alignment was made with MAFFT 52 , version v7.149b, option einsi make an HMM profile. This profile was used to search for other sequences containing the CKK domain across our own dedicated set of eukaryotic proteomes ( Supplementary Table 1 ). The resulting full-length protein sequences can be found in Supplementary Sequence File . Protein expression and purification for crystallization The DNA encoding the Mus musculus CAMSAP3 CKK core domain (denoted CKK3 core , residues 1121–1239; Uniprot: Q80VC9 ) was amplified from the Mus musculus CAMSAP3 CKK domain vector (denoted CKK3) (residues 1112–1252) and cloned into the pET-based bacterial expression vector PSTCm2 (with an N-terminal 6x His-tag) by the positive selection methods 53 . The CKK3 and the mutants for biophysics characterization were cloned into the pET28a vector. Protein production was performed in the Escherichia coli strain BL21(DE3) (Stratagene) in LB media containing 50 µg/ml kanamycin. When the one liter cultures had reached an OD 600 of 0.6 at 37 °C, the media were cooled down to 20 °C and the expression was induced with 1 mM isopropyl 1-thio-β-D-galactopyranoside (IPTG). The expression was conducted for 16 hours at 20 °C. After harvesting and washing the cells with Dulbecco PBS (Millipore), the cells were sonicated in the presence of the protease inhibitor cOmplete cocktail (Roche) in lysis buffer (50 mM HEPES, pH 8, supplemented with 500 mM NaCl, 10 mM imidazole, 2 mM β-mercaptoethanol, 0.1% bovine deoxyribonuclease I). Proteins were purified by immobilized metal-affinity chromatography (IMAC) on a HisTrap HP Ni2+-Sepharose column (GE Healthcare) at 4 °C following the instructions of the manufacturer. The column was equilibrated in IMAC A buffer (50 mM HEPES, pH 8, supplemented with 500 mM NaCl, 10 mM imidazole, 2 mM β-mercaptoethanol). Proteins were eluted by IMAC B buffer that contained 400 mM imidazole after washing with 5 % IMAC buffer B. In the case of CKK3 core , the N-terminal His-tag was cleaved off by an in-house produced HRV 3C protease in IMAC A buffer for 16 hours at 4 °C. The cleaved sample was applied again on the IMAC column to separate cleaved from uncleaved protein. Proteins were concentrated and loaded on a SEC HiLoad Superdex 75 16/60 column (GE Healthcare) that was equilibrated in 20 mM Tris-HCl, pH 7.5, supplemented with 150 mM NaCl and 1 mM DTT. The fractions of the main peak were pooled and concentrated to 10 mg/ml. Protein quality and identity were assessed by SDS-PAGE and mass spectrometry, respectively. Protein expression and purification for cryo-EM Human CAMSAP1 wild type, N1492A CKK (residues 1474–1613) and mouse CAMSAP3 CKK (residues 1112–1252) were cloned into pET28a vector. Following the purification using Ni-NTA resin (Qiagen), proteins were further purified on an ion exchange column MonoS and gel filtration column Superose 6 (GE Healthcare). Purified proteins were concentrated to ~20 mg/ml in BRB20 buffer.
Show full methods section
Sequence analysis
For the detection of CKK homologs BLASTP/PSI-BLAST 50 and phmmer/jackhmmer 51 searches were performed online across the nr and UniProt databases, respectively, taking different sequences as query. Based on these hits, a multiple sequence alignment was made with MAFFT 52 , version v7.149b, option einsi make an HMM profile. This profile was used to search for other sequences containing the CKK domain across our own dedicated set of eukaryotic proteomes ( Supplementary Table 1 ). The resulting full-length protein sequences can be found in Supplementary Sequence File . Protein expression and purification for crystallization The DNA encoding the Mus musculus CAMSAP3 CKK core domain (denoted CKK3 core , residues 1121–1239; Uniprot: Q80VC9 ) was amplified from the Mus musculus CAMSAP3 CKK domain vector (denoted CKK3) (residues 1112–1252) and cloned into the pET-based bacterial expression vector PSTCm2 (with an N-terminal 6x His-tag) by the positive selection methods 53 . The CKK3 and the mutants for biophysics characterization were cloned into the pET28a vector. Protein production was performed in the Escherichia coli strain BL21(DE3) (Stratagene) in LB media containing 50 µg/ml kanamycin. When the one liter cultures had reached an OD 600 of 0.6 at 37 °C, the media were cooled down to 20 °C and the expression was induced with 1 mM isopropyl 1-thio-β-D-galactopyranoside (IPTG). The expression was conducted for 16 hours at 20 °C. After harvesting and washing the cells with Dulbecco PBS (Millipore), the cells were sonicated in the presence of the protease inhibitor cOmplete cocktail (Roche) in lysis buffer (50 mM HEPES, pH 8, supplemented with 500 mM NaCl, 10 mM imidazole, 2 mM β-mercaptoethanol, 0.1% bovine deoxyribonuclease I). Proteins were purified by immobilized metal-affinity chromatography (IMAC) on a HisTrap HP Ni2+-Sepharose column (GE Healthcare) at 4 °C following the instructions of the manufacturer. The column was equilibrated in IMAC A buffer (50 mM HEPES, pH 8, supplemented with 500 mM NaCl, 10 mM imidazole, 2 mM β-mercaptoethanol). Proteins were eluted by IMAC B buffer that contained 400 mM imidazole after washing with 5 % IMAC buffer B. In the case of CKK3 core , the N-terminal His-tag was cleaved off by an in-house produced HRV 3C protease in IMAC A buffer for 16 hours at 4 °C. The cleaved sample was applied again on the IMAC column to separate cleaved from uncleaved protein. Proteins were concentrated and loaded on a SEC HiLoad Superdex 75 16/60 column (GE Healthcare) that was equilibrated in 20 mM Tris-HCl, pH 7.5, supplemented with 150 mM NaCl and 1 mM DTT. The fractions of the main peak were pooled and concentrated to 10 mg/ml. Protein quality and identity were assessed by SDS-PAGE and mass spectrometry, respectively. Protein expression and purification for cryo-EM Human CAMSAP1 wild type, N1492A CKK (residues 1474–1613) and mouse CAMSAP3 CKK (residues 1112–1252) were cloned into pET28a vector. Following the purification using Ni-NTA resin (Qiagen), proteins were further purified on an ion exchange column MonoS and gel filtration column Superose 6 (GE Healthcare). Purified proteins were concentrated to ~20 mg/ml in BRB20 buffer.
Protein expression and purification for in vitro assays
All proteins used for Total Internal Reflection Fluorescence microscopy (TIRFM) (human CAMSAP1 CKK (residues 1474–1613) and CAMSAP1 mini (residues 1227–1613), fly CKK (residues 1547–1689), worm CKK (residues 982–1128), Tetrahymena thermophila CKK (residues 1635–1770), Trichomonas vaginalis CKK (residues 650–795), Naegleria gruberi CKK (residues 612–788), Phytophthora infestans CKK (residues 1120–1168), human MCAK full length and human KIF5B (residues 1–560)) were expressed in HEK293T cells using modified pTT5 expression vector (Addgene, #44006, 54 ) bearing strep-GFP or strep-SNAP tag at either N- or C terminus of the protein. The CKK cDNA sequences encoding T. thermophila , T. vaginalis , N. gruberi were codon optimized for human cell expression and synthesized as gBlock from IDT. The CKK of P. infestans was obtained by PCR from genomic DNA (a gift from Dr. F. Govers, Wageningen University). Fly and worm Patronin cDNAs were kindly provided by Dr. V. Gelfand (Northwestern University) and Dr. M. Harterink (Utrecht University), respectively. In CAMSAP1mini-GFP protein, the GFP tag was inserted directly after the C-terminus of the CKK domain followed by a short flexible linker (CAMSAP1 residues 1227–1613-GGSGGS-GFP) Cells from one 15 cm dish collected after 36 hrs transfection were lysed in 900 μl lysis buffer (50 mM HEPES, 300 mM NaCl, 0.5% Triton X-100, pH 7.4) supplemented with protease inhibitors (Roche). After clearing debris by centrifugation, cell lysates were incubated with 100 μl StrepTactin beads (GE Healthcare) for 45 mins. Beads were washed 5 times with lysis buffer without protease inhibitors and twice with the wash buffer (50 mM HEPES, 150 mM NaCl and 0.01% Triton X-100). The proteins were eluted in 60 μl elution buffer (50 mM HEPES, 150 mM NaCl, 0.01% Triton X-100 and 2.5 mM desthiobiotin). To label SNAP tagged proteins with Alexa-647 dye (NEB), 20–40 μM dye was incubated with proteins on beads for 1 hr between the washing and elution steps. After extensive washing steps, proteins were eluted in elution buffer containing 300 mM instead of 150 mM NaCl. HEK293T cell line was obtained from ATCC, was not found in the database of commonly misidentified cell lines maintained by ICLAC and NCBI BioSample, was not authenticated and was negative for mycoplasma contamination. Total Internal Reflection Fluorescence microscopy (TIRFM) TIRFM was performed on an inverted research microscope Nikon Eclipse Ti-E (Nikon) with the perfect focus system (PFS) (Nikon), equipped with the Nikon CFI Apo TIRF 100× 1.49 N.A. oil objective (Nikon), Photometrics Evolve 512 EMCCD (Roper Scientific) and controlled with the MetaMorph 7.7 software (Molecular Devices). Images were projected onto the chip of Evolve 512 camera with intermediate lens 2.5X (Nikon C mount adapter 2.5X). To keep in vitro samples at 30°C, we used stage top incubator INUBG2E-ZILCS (Tokai Hit). For excitation we used 491nm 100mW Stradus (Vortran), 561nm 100mW Jive (Cobolt) and 642 nm 110 mW Stradus (Vortran). We used ET-GFP 49002 filter set (Chroma) for imaging of proteins tagged with GFP, ET-mCherry 49008 filter set (Chroma) for imaging X-Rhodamine labelled tubulin or mCherry-EB3 and ET-405/488/561/647 for imaging SNAP-Alexa647. For simultaneous imaging of green and red fluorescence, we used the triple-band TIRF polychroic ZT405/488/561rpc (Chroma) and the triple-band laser emission filter ZET405/488/561m (Chroma), mounted in the metal cube (Chroma, 91032) together with Optosplit III beamsplitter (Cairn Research Ltd, UK) equipped with a double emission filter cube configured with ET525/50m, ET630/75m and T585LPXR (Chroma). We used sequential acquisition for triple colour imaging experiments. In vitro MT assays The in vitro assays with dynamic MTs were performed under the same conditions as described previously 18 . Briefly, after functionalizing coverslips by sequentially incubating them with 0.2 mg/ml PLL-PEG-biotin (Susos AG, Switzerland) and 1 mg/ml neutravidin (Invitrogen) in MRB80 buffer, GMPCPP-stabilized MT seeds were attached to coverslips through biotin-neutravidin interactions. Flow chambers were further blocked with 1 mg/ml к-casein. The reaction mix with purified proteins (MRB80 buffer supplemented with 20 μM porcine brain tubulin, 0.5 μM X-rhodamine-tubulin, 75 mM KCl, 1 mM GTP, 0.2 mg/ml κ-casein, 0.1% methylcellulose and oxygen scavenger mix (50 mM glucose, 400 μg/ ml glucose oxidase, 200 μg/ ml catalase and 4 mM DTT) was added to the flow chamber after centrifugation. The flow chamber was sealed with vacuum grease, and dynamic MTs were imaged immediately at 30ºC using a TIRF microscope. The conditions for MT depolymerisation assay were essential the same as in the assays with dynamic MTs except that tubulin proteins were not included and the reaction mix was optimized to image MT depolymerisation (MRB80 buffer supplemented with 100 mM KCl, 1 mM GTP, 1 mM ATP, 0.2 mg/ml κ-casein and oxygen scavenger mix). All tubulin products were from Cytoskeleton.
Quantification of the intensity of the wild type and mutant
CAMSAP1 mini on dynamic MTs To quantify the minus-end and lattice intensity of CAMSAP1 mini in a time-lapse movie, kymographs were generated in ImageJ using KymoResliceWide plug-in. The minus-end positions were marked by 5-pixel wide linear ROIs corresponding to CAMSAP1 mini signals. The maximum intensity within 5-pixel region along the spatial axis of the kymograph was measured by using a Macro written in ImageJ.
Determination of CAMSAP1 position on MT ends
To determine the position of CAMSAP1 mini relative to the MT minus end, we simultaneously imaged CAMSAP1 mini -GFP and X-Rhodamine labelled GMPCPP stabilized MTs using a beam splitter. Spatial registration between two channels was performed by B-spline point based transform (MathWorks File Exchange: 20057-b-spline-grid--image-and-point-based-registration) using images of a calibration grid featuring 500 nm diameter transparent circles separated by 2 μm distance (Compugraphics, UK). In order to achieve better spatial sampling of imaging area, an image of “denser” grid was obtained by moving the stage eight times with the step of 0.25 μm in both x and y direction during calibraion. After channel’s registration, we extracted one-dimensional intensity profiles along MT axis for both CAMSAP1 mini and MT channels. The profiles were fitted to the models previously used for XMAP215 and MT ends 28 . Briefly, MT end axis profile was modelled as an error function, which is the result of convolution between step function representing density of tubulin molecules distribution in a MT and a Gaussian representing the optical point spread function (PSF) of the microscope. CAMSAP1 mini axis profile was modelled as the combination of Gaussian peak (representing convoluted point like accumulation at the edge of the minus-end) and error function (accounting for its weak lattice binding) with different weights. The PSF size estimation (GFP channel: 108 nm; x-Rhodamine channel: 125 nm) was obtained from two colour images of 100 nm diameter fluorescence beads (TetraSpeck, Invitrogen). The overall displacement error between point images in two channels after registration was estimated to be ~2 nm. It based on acquiring an extra set of calibration grid images and calculating the average distance between corresponding spots in two channels after registration. The average error of fitting for the position parameters is about 5 nm and 6 nm for CAMSAP1 (peak position) and MT (edge position), respectively. Thus, according to the propagation of uncertainty the estimated error of a distance between the peak of CAMSAP1 distribution and the edge of MT minus-end is about 2 2 + 5 2 + 6 2 ≈ 8 nm . Structure determination of the CAMSAP3 CKK domain CKK3 core was concentrated to 14 mg/ml and TCEP to a final concentration of 5 mM was added. The screening of crystallization conditions was performed using a Mosquito robot (TTP Labtech) in 96 wells plate using the vapor diffusion hanging drop method. In drops of a 1:1 (200 nl each) mixture of CKK3 core and mother liquor (100 mM citric acid, pH 5, 1 M NaCl) crystals with a diameter of 100 μm appeared after one week. The crystals were cryo-protected by transfer into mother liquor supplemented with 10% glycerol and were flash frozen in liquid nitrogen. Diffraction data were collected at the X06DA macromolecular crystallography beamline at the Swiss Light Source (Paul Scherrer Institut) at a wavelength of 1 Å. The data were indexed with LABELIT 55 , refined and integrated in XDS 56 . The crystals diffracted up to 1.4 Å at a wavelength and the crystals belonged to the space group I422 with a = 96.4 Å, b = 96.4 Å and c = 63.3 Å. The structure was solved by molecular replacement using PHASER 57 with the available NMR structure (PDB ID 1UGJ) as a search model. Several rounds of manual model building in COOT 58 and refinement in PHENIX.refine 59 and REFMAC5 60 produced a final model with satisfactory R-work/R-free. The structure was validated by MolProbity and the wwPDB Validation Service. Figures were created using PyMOL 61 . Data collection and refinement statistics are given in Table 1 . Circular dichroism (CD) spectroscopy CD spectra of CKK3 and derived mutants were recorded on a Chirascan-Plus CD instrument (Applied Photophysics Ltd.) equipped with a computer-controlled Peltier element using a cuvette of 1 mm optical path length. 0.25 mg/ml of protein sample was applied in PBS buffer. Thermal unfolding profiles were measured at 206 nm by continuous heating at 1°C min− 1 .
MT pelleting assays
MT pelleting assays of purified proteins were performed as previously described 62 . Briefly, 10 mg/ml bovine brain tubulin was diluted in 1x BRB35 buffer (35 mM K-PIPES, pH 6.8, supplemented with 1 mM EGTA, 1 mM MgCl 2 , 1 mM DTT) to 1 mg/ml. After the addition of 0.5 mM GTP, the sample was incubated on ice for 5 minutes. MT polymerization was started by the transfer to 37 °C. After 10 minutes, 0.1 µM, 1 µM and 10 µM paclitaxel were added stepwise with incubation times of 5 minutes each. Pelleting assays in the presence of CAMSAP3-CKK were performed by mixing 3.8 µM of taxol-stabilized MTs with an equimolar ratio of the CAMSAP3-CKK in the presence of different amounts of sodium chloride concentrations. As controls, taxol-stabilized MTs or the CAMSAP3-CKK was applied alone. Samples were applied onto a taxol-glycerol cushion that contained 55% 2x BRB35, 44% Glycerol and 6% 2 mM paclitaxel. After centrifugation at 174,500 x g for 30 min at 25 °C, an aliquot was taken from the supernatant. After removing the supernatant the pellet was resuspended into SDS sample buffer. Samples were loaded and analyzed on Coomassie stained 15% SDS gel. Cryo-EM methods summary ( details are provided in the Cryo-EM Methods Supplemenatary note) Single particle cryo-EM data of MT-CAMSAP3 CKK domain complexes were collected on a Tecnai G2 Polara (FEI), while data of MT-CAMSAP1 CKK domain complexes were collected on a Tecnai F20 (FEI), both using a DE20 direct electron detector (Direct Electron).
Data of MT-CAMSAP1 N1492A mutant
CKK domain complexes were collected on a Tecnai G2 Polara using a K2 direct electron detector (Gatan) operating in counting mode. Cryo-electron tomography single-axis tilt series of MT ends were collected on a Tecnai G2 Polara on a K2 summit direct electron detector (Gatan) operating in counting mode. MTs for single particle reconstruction were boxed manually, and were input to a set of custom-designed semi-automated single-particle processing scripts utilizing Spider and Frealign as described previously 63 , 64 . The final dataset sizes and resolutions are reported in Table 2 . For the cryo-ET data, tilt series were processed and tomograms generated using IMOD’s Etomo graphical user interface (v4.7.15). CKK domain-MT pseudo-atomic model building The X-ray structure of the CAMSAP3-CKK domain (PDB ID 5LZN) was rigidly fitted into CKK domain density of CAMSAP3-CKK domain map using UCSF Chimera’s ‘fit in map’ tool. A homology model of CAMSAP1-CKK (residues 1474–1600) was generated using MODELLER 65 , based on the CAMSAP3-CKK crystal structure as template. In order to model missing loops and terminal regions for both CKKs, the deposited NMR structure of the CAMSAP3 CKK domain (PDB ID 1UGJ) was used as template. CKK models were selected based on MODELLER’s statistical potentials score - zDOPE 66 . The model of CAMSAP1-CKK was rigidly fitted into its density map and for both CKKs, the local fits of secondary-structural elements and loops were scored with a local correlation score using TEMPy (SCCC, 67 . Loop regions which had low SCCC scores, were further optimized. For each of these loops, 200 loop-models were generated using MODELLER loop optimization protocol 68 and a top-scoring conformation (based on SCCC) was selected. To create the N1492A CAMSAP1 CKK model, the point-mutation on the wild type CAMSAP1 model was performed in Coot 69 and this was rigidly fitted into the corresponding mutant CKK density. Final CKK fits were combined with rigid fits (using Chimera’s ‘fit in map’) of two tubulin dimers from the structure of the paclitaxel stabilized-MT 44 (PDB ID 3J6G). The rigid fitted models were already a good fit to experimental density, therefore the models underwent final refinement to their Bfactor sharpening resolutions ( Table 2 ) with NCS restraints using the phenix.real_space_refine tool in Phenix 70 to resolve clashes and improve model geometry. The MolProbity validation indicated zero Ramachandran outliers, 98.1 % Ramachandran favored residues, zero rotamer outliers and a clash score of 0.56. Molecular dynamics simulations 4000 cycles of energy minimization without any positional restrains were performed on the refined structural complexes. Two consecutive molecular dynamics simulation runs of 10ps and 200ps were then employed to increase the temperature from 100K to 300K and to equilibrate the systems at 300K. Four replicate production runs of 40ns each were then performed starting from the equilibrated system configurations. The simulations were run at constant temperature (300K) and constant pressure (1atm) using a 2fs time step. Periodic boundary conditions and full particle-mesh Ewald electrostatic were used. A 12Å cutoff value was applied to truncate the non-bonded interactions. The SHAKE algorithm was used to constrain the covalent bonds formed by hydrogen atoms. Each replicate simulation was run with different random starting velocities. MM/GBSA calculations Molecular mechanics with generalized Born and surface area solvation (MM/GBSA) calculations were performed with the GBOBC model (6) in AMBER 12 (1). For each molecular dynamics simulation, pairwise energetic interactions values (flag idecomp=4) were scaled by the average number of CKK domain – tubulin dimers contacts (51 contacts) and averaged over four replica simulations. NMR sample preparation and experiments Uniformly [ 13 C, 15 N] variants of CKK were produced in Escherichia coli strain Rosetta 2 in M9 minimum media containing 25 µg/ml kanamycin and 35 µg/ml chloramphenicol. The cells were induced with 0.3mM IPTG at 25 °C for overnight after OD 600 reached 0.6. Proteins were purified as described above with phosphate buffer instead of HEPES buffer. After purification, proteins were loaded onto a SEC HiLoad Superdex 75 26/60 column (GE Healthcare), which was equilibrated in 40 mM phosphate buffer with 150 mM NaCl and 1 mM DTT, pH 7.0. Proteins were then concentrated and used for solution-state NMR measurement supplemented with 5% D 2 O, or ssNMR sample preparation. For ssNMR experiments, [ 13 C, 15 N]-CAMSAP3-CKK/MT complex was prepared. 20 mg of lyophilized tubulin was first dissolved in BRB80 buffer to make a final concentration of 2 mg/ml. Tubulin was then polymerized with addition of 20μM paclitaxel for 30 minutes at 37 °C. Paclitaxel-stabilized MTs were centrifuged at 55,000 rpm (Beckman TLA-55 rotor) at 30 °C for 30 minutes. The pellet was resuspended in warm BRB80 buffer and labeled CKK domain was added to the final concentration of 65.3 µM (CKK:tubulin ratio 4:1). The mixture was incubated at 37 °C for 30 minutes and then centrifuged at 55,000 rpm (Beckman TLA-55 rotor) at 30 °C for 30 minutes. The pellet was washed with phosphate buffer without disturbing the pellet. Finally, the pellet was transferred and packed into a 3.2 mm rotor. Resonance assignments were obtained from previous results (PDB ID 1UGJ) and additional solution-state NMR experiments on free CKK were recorded on a 600MHz spectrometer (Bruker Biospin) to assign missing residues (2D HSQCs, 3D HNCA, HNCO, HNCACB, CBCA(CO)NH, HAHB(CO)NH, hCCH-DIPSI). Solid-state NMR experiments involved two-dimensional NCA and CC Proton-driven spin diffusion (PDSD) experiments (temperature 260 K, MAS rate 14 kHz) as well as additional 2Q-1Q experiments (temperature 268 K, MAS 10 kHz). Mixing schemes employed SPECIFIC-CP transfers 71 as well as SPC5 72 and Spin diffusion under weak coupling conditions 73 for longer PDSD mixing times. Data were recorded on a 950 MHz standard-bore spectrometer (Bruker Biospin) equipped with a 3.2mm triple-channel MAS HCN probe. ssNMR data were analyzed using NMR assignments obtained on free CKK as a reference. Resolved residues for which signal matched with ssNMR data within 0.5 ppm in 13C and 1 ppm in 15N dimensions 74 were considered as unperturbed, while resolved residues for which signal matched with ssNMR data within 1 ppm in the indirect dimension and 0.5 ppm in the direct dimension in the CC PDSD experiments were considered as unperturbed. Larger deviations were considered as altered and indicated in red.
Analysis of CKK domain binding to subtilisin-treated MTs Paclitaxel-stabilized
MTs were prepared containing 10% rhodamine tubulin, 10% biotinylated tubulin, and 80% unlabelled tubulin (Cytoskeleton, Inc.), then treated ± 0.1 mg/ml subtilisin for 30 min to remove predominantly β-tubulin C-terminal tails (CTTs), checked by western blot. The reaction was stopped by the addition of 10 mM pefabloc, and MTs were isolated by centrifugation. GFP-CKK domain binding was analyzed by TIRFM, using flow chambers assembled from plasma-cleaned glass coverslips and microscope slides. Chambers were incubated sequentially with 1 mg/ml PLL-PEG biotin (Susos AG), block solution (1% plurionic F-127, 4 mg/ml casein), 0.5 mg/ml neutravidin, and MTs ± CTTs (as indicated). Each incubation was followed by two washes with MRB80 buffer (80 mM PIPES, 4 mM MgCl2, and 1 mM EGTA [pH 6.8]) supplemented with 80 mM KCl, 20 μM paclitaxel, 4 mM DTT and 2 mg/ml casein. The final binding reaction contained 200 nM CKK-GFP in MRB80 with 80 mM KCl, 20 μM taxol, 4 mM DTT and 2 mg/ml casein and an oxygen scavenger mix (400 μg/ml glucose oxidase, 200 μg/ml catalase). TIRFM was performed on an Eclipse Ti-E inverted microscope with a Perfect Focus System, CFI Apo TIRF 1.49 N.A. oil objective, H-TIRF module and LU-N4 laser unit (Nikon). Images were recorded with a 100 ms exposure on an iXon DU888 Ultra EMCCD camera (Andor) controlled with NIS-Elements AR Software (Nikon).
Statistics and Reproducibility
The precise p values for Mann-Whitney U test were calculated in Matlab (MathWorks). All data shown are mean ± SD. The sample size is indicated in the figure legends. All data presented in this study were either averages or representative data from at least two independent experiments. For the ssNMR experiments, all spectra were recorded twice on one sample and they were consistent. The sample did not alter by measuring the 1D H-C CP over time. A Life Sciences Reporting Summary for this article is available online.
Code Availability
The computer codes used in this study are available from the corresponding authors on request.
Data Availability
The structure of CKK3 core was deposited in the PDBe databank under accession code 5LZN. The CKK-MT models along with their corresponding electron density maps are deposited in the PDB (CAMSAP1-CKK-MT, PDB: 5M54, CAMSAP1-N1492A-CKK-MT, PDB: 5M5C and CAMSAP3-CKK-MT, PDB: 5M50) and EMDB respectively (CAMSAP1-CKK-MT, EMDB: EMD-4156, CAMSAP1-N1492A-CKK-MT, EMDB: EMD-3444 and CAMSAP3-CKK-MT, EMDB: EMD-4154). NMR data were deposited in the Biological Magnetic Resonance Bank, BMRB ID 27234. All data that support the conclusions are available from the authors on request, and/or available in the manuscript itself. Source data for the figures 1 , 3 , 4 , 5 and 6 and supplementary figures S1, S4, S7, S8 and S9 can be found in Supplementary Table S2 .
Supplementary Material 1 2 3 4 5 6 7 8 Sup Table 2
📊 Figures
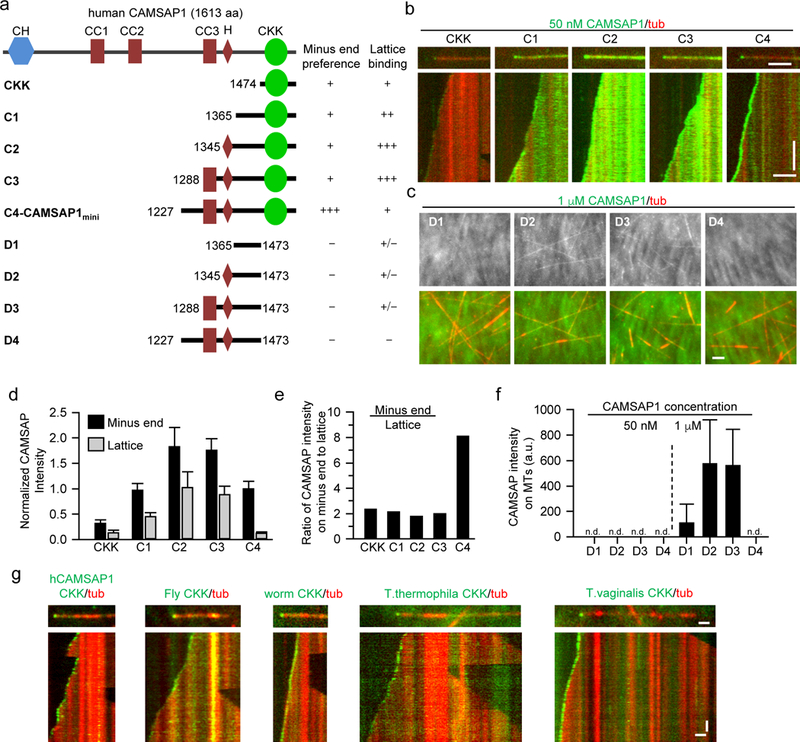
Figure 1.
The CKK is a highly conserved MT minus-end tracking domain.
( a ) Schematic of the CAMSAP1 domain organization and the constructs used. (b-f) Total Internal Reflection Fluorescence Microscopy (TIRFM) images, corresponding kymographs and quantification of local...
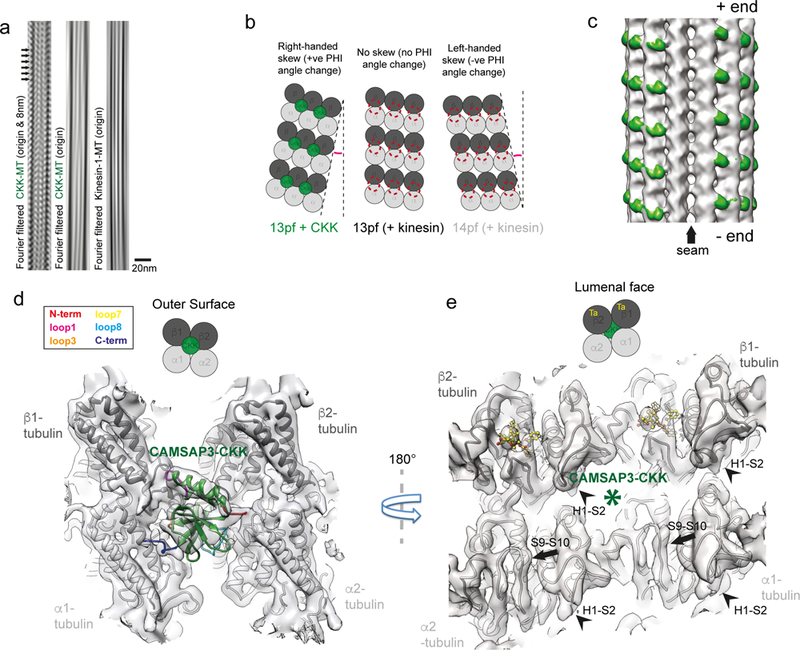
Figure 2.
The unique MT binding site of CAMSAP CKK domains.
( a ) Fourier filtered images of 13pf MTs. Left, filtering of a CAMSAP3-CKK decorated 13pf MT shows density corresponding to the CAMSAP3 CKK domain every tubulin dimer; centre, filtering highlights th...
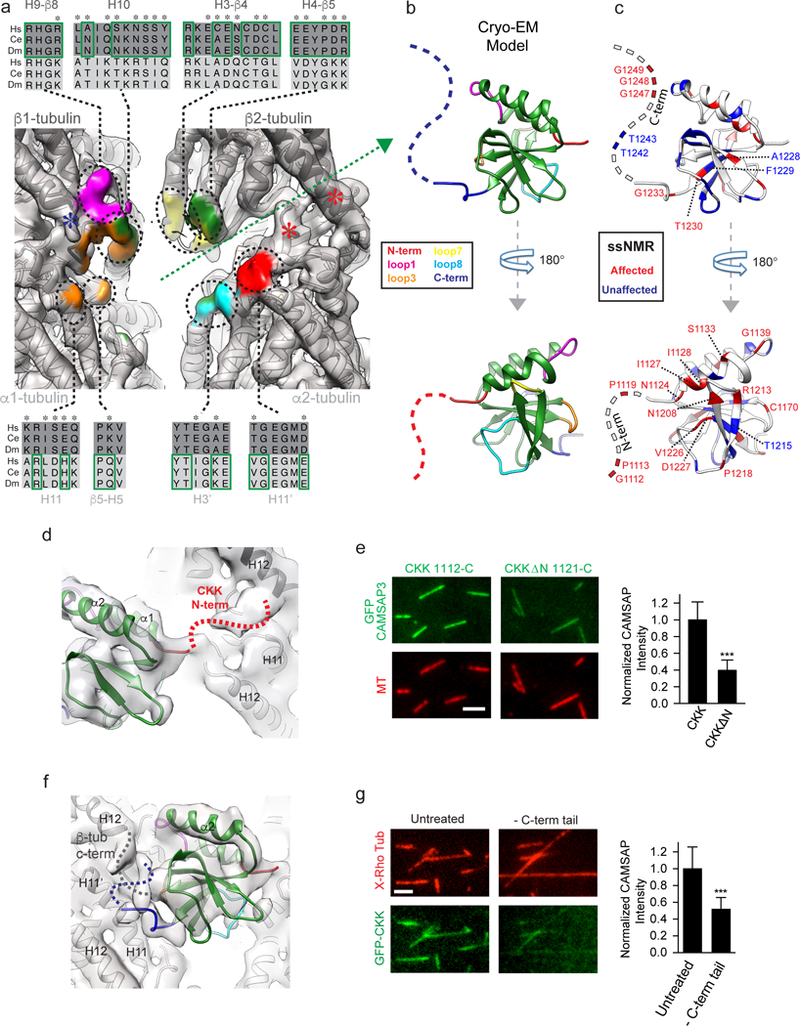
Figure 3.
The interaction with four tubulin monomers is distributed across the CKK domain.
( a ) CKK interaction surface of the MT with cryo-EM density colored according to CKK contacts (<6u00c5 distance, coloring consistent with Fig. 2d ). Sequence alignments for contact regions in u03b...
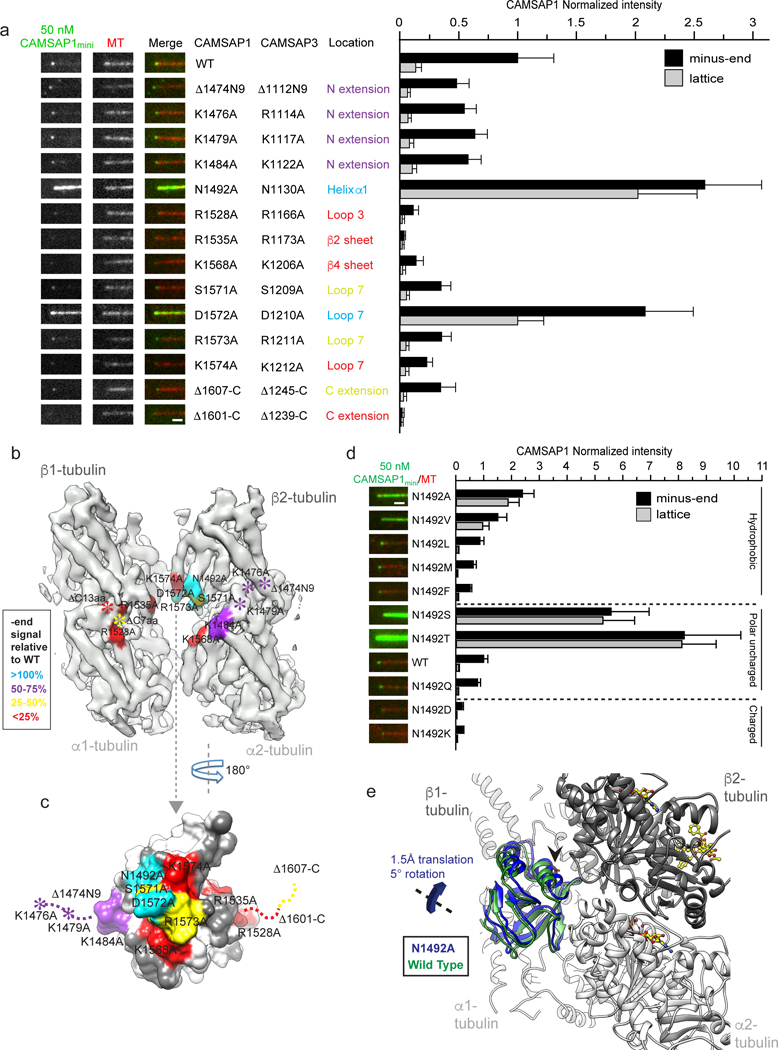
Figure 4.
Validation of CKK-MT contact sites using in vitro assays and structure of a mutant CKK bound to MTs.
(a ) Left, TIRFM images of GFP-CAMSAP1 mini wild type and mutants binding to the minus ends of dynamic MTs. The corresponding residues in CAMSAP3 and their location are indicated. Scale bar, 1 u03bcm....
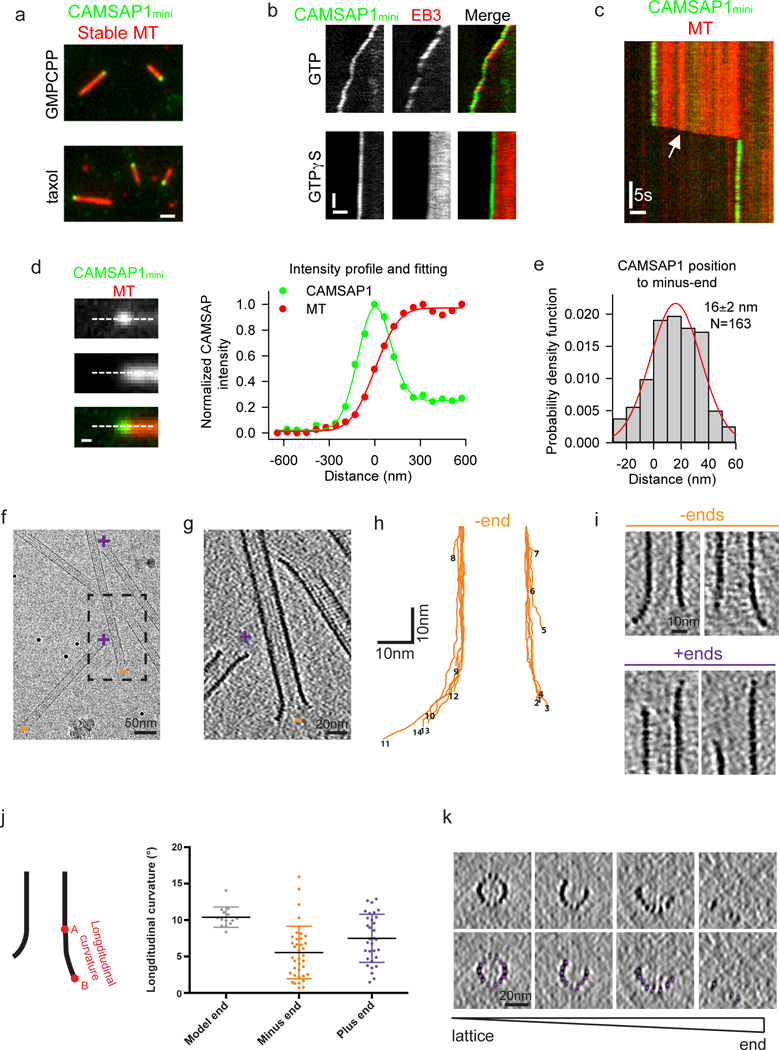
Figure 5.
Examining CKKu2019s preferred tubulin conformation.
( a ) TIRFM images of the minus-end localization of GFP-CAMSAP1 mini on GMPCPP or taxol-stabilized MTs. Scale bar, 1 u03bcm. ( b ) Kymographs showing that GFP-CAMSAP1 mini tracks growing MT minus ends...
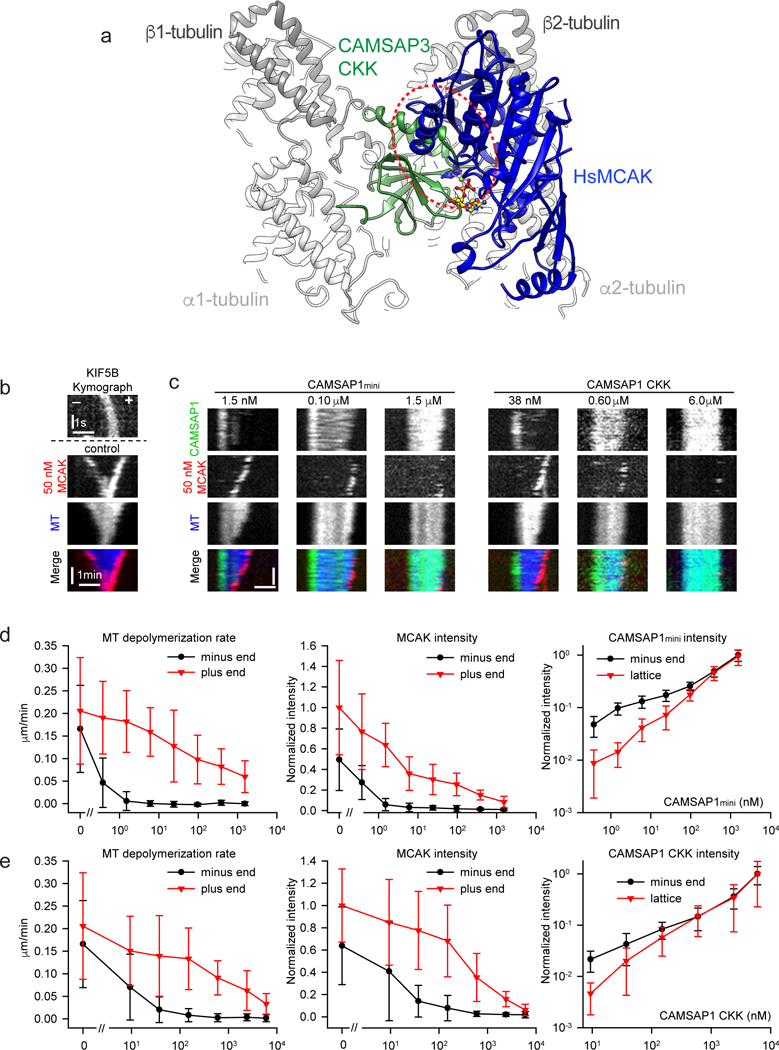
Figure 6.
CAMSAP CKKs protect MT minus ends from MCAK-induced depolymerization via steric inhibition.
( a ) A MT tubulin dimer-pair bound to CAMSAP3-CKK (green) is shown with the expected position of an MD of human MCAK (in complex with ADP; PDB ID 4UBF) by alignment with MT-bound kinesin-1 47 in Chim...
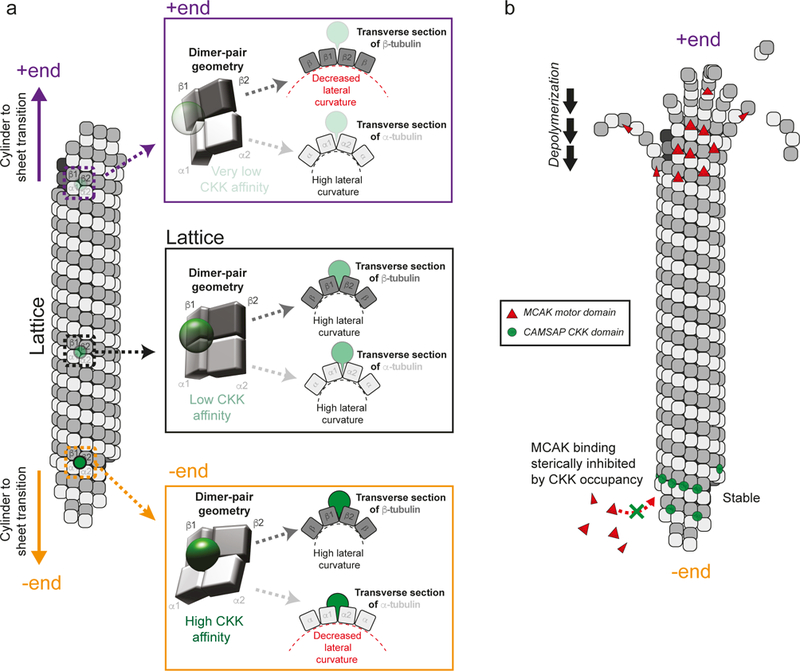
Figure 7.
Proposed mechanisms of MT minus end binding and protection from MCAK-induced depolymerization by the CKK domain.
( a ) Towards the ends of stable or growing MTs there is a transition from the regular lattice to sheet-like regions, with increasing longitudinal curvature and decreasing lateral curvature. Protofila...
Figure images are served from the NIH/NLM PubMed Central Open Access Subset or Europe PMC; copyright remains with the publishers and authors.
💬 Discussion
0 commentsNo comments yet. Be the first to start a discussion!
Leave a Comment