Abstract
The mitochondrial inner membrane can reshape under different physiological conditions. How, at which frequency this occurs in living cells, and the molecular players involved are unknown. Here, we show using state-of-the-art live-cell stimulated emission depletion (STED) super-resolution nanoscopy that neighbouring crista junctions (CJs) dynamically appose and separate from each other in a reversible and balanced manner in human cells. Staining of cristae membranes (CM), using various protein markers or two lipophilic inner membrane-specific dyes, further revealed that cristae undergo continuous cycles of membrane remodelling. These events are accompanied by fluctuations of the membrane potential within distinct cristae over time. Both CJ and CM dynamics depended on MIC13 and occurred at similar timescales in the range of seconds. Our data further suggest that MIC60 acts as a docking platform promoting CJ and contact site formation. Overall, by employing advanced imaging techniques including fluorescence recovery after photobleaching (FRAP), single-particle tracking (SPT), live-cell STED and high-resolution Airyscan microscopy, we propose a model of CJ dynamics being mechanistically linked to CM remodelling representing cristae membrane fission and fusion events occurring within individual mitochondria.
🔬 Techniques
🔭 Microscopes
💻 Software
✨ Fluorophores
🧪 Sample Preparation
🔬 Cell Lines
🏭 Microscope Brands
🧪 Reagent Suppliers
📷 Detectors
🔎 Objectives
💻 Software Details
💾 Data Repositories
🏛️ Research Organizations (ROR)
Affiliated research institutions:
📋 Methods
Cell culture, transfection and generation of knockout cell lines HeLa and HEK293 cells were maintained in DMEM (Sigma‐Aldrich) supplemented with 10% foetal bovine serum (PAN Biotech), 2 mM glutaMAX (Gibco), 1 mM sodium pyruvate (Gibco) and penstrep (Sigma‐Aldrich, penicillin 100 units/ml and streptomycin 100 μg/ml), whereas HAP1 cells were cultured using Iscove's modified DMEM media (IMDM) supplemented with 20% foetal bovine serum (PAN Biotech), 2 mM glutaMAX (Gibco) and penstrep (Sigma‐Aldrich, penicillin 100 units/ml and streptomycin 100 μg/ml). Cells were grown in incubator with 37°C and 5% CO 2 . All cell lines were tested negative for possible mycoplasma contamination. HeLa and HAP1 cells were transfected with 1 μg of corresponding plasmid using GeneJuice ® (Novagen) according to the manufacturer's instructions. In case of SNAP‐tag constructs, 0.2 μg of MitoGFP (matrix‐targeted) and 1 μg of corresponding SNAP‐tag were co‐transfected. HEK293 cells were grown on a large scale in 10 cm dishes and transfected with 10 μg of respective plasmids that were used for biochemical experiments. MIC13 KO HeLa cells were generated using CRISPR/Cas method as described before 44 . MIC10 and MIC60 KO HAP1 cells along with WT cells were custom‐made upon our request by Horizon (UK). For TMRM imaging, HeLa cells were stained with 50 nM TMRM dye (Invitrogen) for 30 min followed by three washes with complete medium. Molecular cloning Human MIC60, MIC10, MIC13, ATP5I and TOMM20 were cloned into pSNAPf vector (NEB) using Gibson Assembly Cloning Kit (NEB). COX8A‐SNAP vector was obtained from NEB. MIC60 and MIC10 were cloned into pEGFPN1 using restriction digestion by Xho I and Bam H1 followed by ligation. Human TOMM20, TIMM23 and ATP5I were cloned into pEGFPN1 vector, and human ATP5I was cloned into pPAGFPN1 vector using Gibson Assembly Cloning Kit (NEB) to acquire their respective GFP‐ or PAGFP‐tagged versions.
Show full methods section
Cell culture, transfection and generation of knockout cell lines HeLa and HEK293 cells were maintained in DMEM (Sigma‐Aldrich) supplemented with 10% foetal bovine serum (PAN Biotech), 2 mM glutaMAX (Gibco), 1 mM sodium pyruvate (Gibco) and penstrep (Sigma‐Aldrich, penicillin 100 units/ml and streptomycin 100 μg/ml), whereas HAP1 cells were cultured using Iscove's modified DMEM media (IMDM) supplemented with 20% foetal bovine serum (PAN Biotech), 2 mM glutaMAX (Gibco) and penstrep (Sigma‐Aldrich, penicillin 100 units/ml and streptomycin 100 μg/ml). Cells were grown in incubator with 37°C and 5% CO 2 . All cell lines were tested negative for possible mycoplasma contamination. HeLa and HAP1 cells were transfected with 1 μg of corresponding plasmid using GeneJuice ® (Novagen) according to the manufacturer's instructions. In case of SNAP‐tag constructs, 0.2 μg of MitoGFP (matrix‐targeted) and 1 μg of corresponding SNAP‐tag were co‐transfected. HEK293 cells were grown on a large scale in 10 cm dishes and transfected with 10 μg of respective plasmids that were used for biochemical experiments. MIC13 KO HeLa cells were generated using CRISPR/Cas method as described before 44 . MIC10 and MIC60 KO HAP1 cells along with WT cells were custom‐made upon our request by Horizon (UK). For TMRM imaging, HeLa cells were stained with 50 nM TMRM dye (Invitrogen) for 30 min followed by three washes with complete medium. Molecular cloning Human MIC60, MIC10, MIC13, ATP5I and TOMM20 were cloned into pSNAPf vector (NEB) using Gibson Assembly Cloning Kit (NEB). COX8A‐SNAP vector was obtained from NEB. MIC60 and MIC10 were cloned into pEGFPN1 using restriction digestion by Xho I and Bam H1 followed by ligation. Human TOMM20, TIMM23 and ATP5I were cloned into pEGFPN1 vector, and human ATP5I was cloned into pPAGFPN1 vector using Gibson Assembly Cloning Kit (NEB) to acquire their respective GFP‐ or PAGFP‐tagged versions.
SDS electrophoresis and Western blotting
For preparing samples for Western blotting, corresponding cells were collected and proteins were extracted using RIPA lysis buffer. The amount of solubilized proteins in all the samples were determined using the Lowry method (Bio‐Rad). 15% SDS–PAGE was performed, and separated proteins were subsequently blotted onto a PVDF membrane, and probed with indicated antibodies: MIC10 from Abcam (84969), MIC13 (custom‐made by Pineda (Berlin) against human MIC13 peptide CKAREYSKEGWEYVKARTK), MIC19 (Proteintech, 25625‐1‐AP), MIC25 (Proteintech, 20639‐1‐AP), MIC26 (Thermo Fisher, MA5‐15493), MIC27 (Atlas Antibodies, HPA000612), MIC60 (custom‐made, Pineda (Berlin)) against human IMMT using the peptide CTDHPEIGEGKPTPALSEEAS), SNAP‐tag (P9310S, NEB) and β‐tubulin (Abcam, ab6046). Goat anti‐mouse IgG HRP‐conjugated antibody (ab97023) and goat anti‐rabbit IgG HRP‐conjugated antibody (Dianova, 111‐035‐144) were used as secondary antibodies. Chemiluminescence was captured using a VILBER LOURMAT Fusion SL (PEQLAB). Coimmunoprecipitation For coimmunoprecipitation, isolated mitochondria from HEK293 cells overexpressing either MIC10‐SNAP, MIC10‐GFP, MIC60‐SNAP or MIC60‐GFP were used. Mitochondrial isolation was done as described before 44 . The coimmunoprecipiation experiment was performed using the protocol described in Ref. 28 with the following modification. The beads were incubated with 4 μg of MIC13 antibody (custom‐made by Pineda (Berlin)) against human MIC13 peptide CKAREYSKEGWEYVKARTK). During lysis of the mitochondria, a detergent/protein ratio of 2 g/g was used.
Isolation of macromolecular complexes by blue native gels
Mitochondria from HEK293 cells overexpressing MIC60‐SNAP or MIC60‐GFP were isolated and BN‐PAGE experiment was performed as shown by Ref. 44 with the use of a detergent/protein ration of 2 g/g during solubilization. Electron microscopy HAP1 WT, MIC10 KO and MIC60 KO cells were grown on petri dishes, and cells were washed with PBS and fixed using 3% glutaraldehyde in 0.1 M sodium cacodylate buffer, pH 7.2. After fixation, cells were collected in a small tube using a cell scraper and pelleted. These cell pellets were washed with 0.1 M sodium cacodylate, pH 7.2 and subsequently embedded in 2% agarose. The pellets were stained using 1% osmium tetroxide for 50 min and 1% uranyl acetate/1% phosphotungstic acid for 1 h. The samples were dehydrated using graded acetone series and embedded in spur epoxy resin for polymerization at 65°C for 24 h. The ultrathin sections were prepared using microtome, and the images were acquired using transmission electron microscope (Hitachi, H600) at 75V equipped with Bioscan model 792 camera (Gatan) and analysed with ImageJ software.
Cellular respiration measurements
All respiration measurements were performed using Seahorse XFe96 Analyzer (Agilent). The HAP1 cells were seeded into Seahorse XF96 cell culture plate (Agilent) at a density of 30,000 cells per well overnight. Next day, cells were washed and incubated in basic DMEM media (Sigma, D5030) supplemented with glucose, glutamine and pyruvate at 37°C in non‐CO 2 incubator 1 h prior to the assay. Mitochondrial respiration function was measured using Seahorse XF Cell Mito Stress Test Kit (Agilent) according to the manufacturer's instructions. Briefly, the delivery chambers of the sensor cartridge were loaded with oligomycin (F 1 F O ‐ATPase synthase inhibitor) or FCCP (uncoupler) or rotenone and antimycin (complex I and complex III inhibitors, respectively) to measure basal, proton leak, maximum and residual respiration. Cell number was normalized after the run using Hoechst staining. Data were analysed using wave software (Agilent).
Immunofluorescence staining
HAP1 cells were fixed with pre‐warmed (37°C) 3.7% paraformaldehyde for 15 min. After fixation, cells were washed three times with PBS, permeabilized with 0.15% Triton X‐100 for 15 min and blocked using 10% goat serum for 15 min followed by incubation with appropriate dilution of primary antibodies for 3 h at room temperature or overnight at 4°C. After washing thrice with PBS, samples were incubated at room temperature with appropriate secondary antibody for 1 h and washed three times with PBS before proceeding for microscopy. For STED super‐resolution imaging, primary antibodies used were against MIC60 (custom‐made, Pineda (Berlin)), MIC10 (Abcam, 84969) and TOMM70 (Santa Cruz Biotechnology, sc‐390545). Goat anti‐rabbit Abberior STAR 635P (Abberior) and goat anti‐mouse Abberior STAR 580 (Abberior) were used as secondary antibodies. Quantification of mitochondrial interpunctae distance (IPD) The longitudinal distance along the mitochondrial length between two successive MIC60 or MIC10 punctae is termed as interpunctae distance (IPD). The IPD between MIC60 and MIC10 punctae was calculated using the ImageJ software by manually drawing lines between two spots from the centre of the punctae and measured using the “Analyze” function to calculate the length of that particular line. In order to avoid repetition of measuring the IPD, the length between the punctae was measured in a clockwise direction. If the edges of mitochondria containing the MIC60 or MIC10 spots were curved, a segmented line tool was used to measure the IPD. In rare cases where MIC60 spots were replaced by longitudinal bridges, the centre of the line was taken into consideration for defining the spot. The distance between MIC60 or MIC10 punctae per mitochondrion was calculated (from an average of 36–55 spots/mitochondrion), and a median interpunctae distance was obtained for that individual mitochondrion. Data were represented in a boxplot where a single value represented IPD value for each mitochondrion.
FRAP and associated quantification
FRAP experiments were performed on Leica SP8 using the FRAP module with Fly mode function switched on. Images were acquired with 40× water objective (N.A = 1.1) using 25x zoom. In order to avoid acquisition photobleaching, only 1–1.5% laser power of the Argon laser line at 488 nm was used to acquire the images using a PMT in green emission range. A square region of 0.7 × 0.7 μm was bleached using 100% laser power at 488 nm. Ten pre‐bleach images were acquired, while 10 images were acquired during bleaching. 200 post‐bleach images were acquired at a maximal possible frame rate of 88–89 ms/frame to monitor the recovery of fluorescence. After the images were acquired, quantification of the FRAP experiment was done in the following way: three different regions of interest (ROIs) were taken into consideration: (i) ROI 1 , an area where no mitochondria were found in the image, was used to perform background subtraction. (ii) ROI 2 was the area of mitochondria where the photobleaching was performed. (iii) ROI 3 , another region of a separate mitochondria not subjected to FRAP, was used to obtain correction factor for acquisition photobleaching. ROI 2 (P) was the average of 10 pre‐bleach measurements of ROI 2 , whereas ROI 3 (P) was the average of 10 pre‐bleach measurements of ROI 3 . Hence, photobleach correction was performed by using the formula: ROI 2 ‐ROI 1 /ROI 3 ‐ROI 1 and normalization were performed by using the formula: ROI 2 ‐ROI 1 /ROI 3 ‐ROI 1 X ROI 3 (P)‐ROI 1 /ROI 2 (P)‐ROI 1 . All the mitochondria belonging to a particular condition from independent experiments were pooled and averaged for their FRAP curves. Standard error of mean (SEM) was plotted for all the pooled mitochondria for each condition. Once the FRAP recovery values were obtained, they were fitted, using GraphPad Prism 7.04, by nonlinear regression two‐phase association model for all molecules. First and second phase association T 1/2 recovery values were obtained for each condition when the curves were fitted by nonlinear regression two‐phase association model. Mobile fraction was calculated by using the formula: F m = F p ‐ F 0 / F initial ‐ F 0 , where F m denotes the mobile fraction, F p denotes the fraction of fluorescence when the plateau is reached, F initial is 1 and F 0 is the fraction of initial fluorescence after the last pulse of photobleaching for all cases except MIC60‐GFP, MIC10‐GFP and TOMM20‐GFP (in MIC13 KO cells), where the Fp was calculated from the average of last 5 intensity values. Diffusion coefficients (D) were calculated using the formula D = 0.25 × r 2 / T 1/2 , where r is the radius of the bleached ROI and T 1/2 is the recovery time in seconds, as suggested before 76 . We bleached a square ROI region of 0.49 μm 2 in the mitochondria for our experiments. Hence, we used 0.49 μm 2 as the area of the circle to calculate the radius.
Single‐particle tracking imaging and quantification
Cells transfected with the SNAP‐tag and stained with low concentrations of SNAP‐cell 647‐SiR (NEB) (15 nM for MIC60‐SNAP and 0.225 nM for MIC10‐SNAP) were imaged in fluoroBrite DMEM media supplemented with 10% foetal bovine serum (PAN Biotech), 2 mM glutaMAX (Gibco), 1 mM sodium pyruvate (Gibco) and penstrep (Sigma‐Aldrich, penicillin 100 units/ml and streptomycin 100 μg/ml). Lower concentrations of silicon rhodamine were used here compared to STED super‐resolution imaging to allow for selective labelling of only few molecules in a mitochondrion. Movies were acquired on a Zeiss Elyra PS.1 microscope equipped with a 63× (NA = 1.46) objective lens in total internal reflection fluorescence (TIRF) mode, where highly inclined and laminated optical sheet (HILO) illumination was used, at a frame rate of 33 ms/frame for 1,000 frames. The angle of the illuminating laser, EMCCD gain and laser intensity was manually adjusted to acquire the best signal‐to‐noise ratio (SNR). The first 50–100 frames of every movie were not used for analyses so that acquisition bleaching will additionally provide a sufficiently low concentration of single particles. For analyses of movies, a ROI was set around each cell and single‐particle tracking (SPT) was performed using the Fiji/ImageJ 77 plugin TrackMate 78 where the following TrackMate settings were used: Detector: Laplacian of Gaussian, Estimated blob diameter: 0.5 μm, Do sub‐pixel localization: Yes, Initial thresholding: No, Filter on spots: SNR above 0.4. For tracking spots, the linear assignment problem (LAP) tracker with following settings worked well: Frame to frame linking: 0.3 μm, Gap‐closing maximal distance: 0.5 μm, Gap‐closing maximal frame gap: 5 frames. The filter on tracks function was used to only analyse tracks with more than 20 spots within a track. After analysis, the calculated mean square displacement (MSDs) and instantaneous diffusion coefficients (insDs) of all tracks were loaded into the Fiji plugin “Trajectory Classifier” 79 . MSD analysis allows to determine the mode of displacement of particles over time. For the calculation of the MSD for every track and time point, the MATLAB class @msdanalyzer was used 80 . Additionally, the insDs were calculated using insD = mean MSD/4*dt 81 where mean MSDs were calculated using the first 4 MSD points of every track. Besides the calculation of the MSD and insD, tracks were analysed using the Fiji plugin Trajectory classifier 79 . The plugin classifies tracks generated with TrackMate into confined diffusion, subdiffusion, normal diffusion and directed motion in increasing order of directionality. As most tracks were relatively short, following settings for the classification were used: Minimal track length: 20, Window size: 10, Minimal segment length: 10. SPT data were obtained for each condition in two independent experiments from 2 to 5 cells in each experiment. 2D STED (stimulated emission depletion) super‐resolution nanoscopy Cells transfected with corresponding SNAP tags and stained with silicon rhodamine dye (SNAP‐cell 647‐SiR (NEB) (3 μM)) were imaged at 37°C and 5% CO 2 mimicking cell culture incubator conditions in fluoroBrite DMEM media supplemented with 10% foetal bovine serum (PAN Biotech), 2 mM glutaMAX (Gibco), 1 mM sodium pyruvate (Gibco) and penstrep (Sigma‐Aldrich, penicillin 100 units/ml and streptomycin 100 μg/ml). Live‐cell STED super‐resolution nanoscopy was performed on Leica SP8 laser scanning confocal microscope fitted with a STED module. Before imaging, the alignment of excitation and depletion laser was checked in reflection mode using colloidal 80‐nm gold particles (BBI Solutions). Cells expressing the SNAP‐tag and stained with SNAP‐cell 647‐SiR (NEB) were excited with a white light laser at an excitation wavelength of 633 nm. Images were collected using a hybrid detector (HyD) at an emission range from 640 to 730 nm using a 93× glycerol (N.A = 1.3) or 100× oil objective (N.A = 1.4) while using a pulsed STED depletion laser beam at 775‐nm emission wavelength. The images were obtained at a zoom to acquire 9.7 × 9.7 μm area (12× magnification for 100× or 12.9× magnification for 93× objective). Movies were obtained at a frame rate of ~2.5 s/frame or ~ 1.25 s/frame (pixel size was 22.5 nm for live‐cell STED imaging). Gating STED was used from 0.8 to 1 ns onwards in order to increase the specificity of the fluorescence signal. For dual‐colour STED, we used pulsed STED depletion laser at 775‐nm emission wavelength. Images were collected in sequential mode using a hybrid detector while exciting at 633 and 561 nm to acquire images at emission wavelengths of 660–730 nm and 570–610 nm, respectively. Care was taken to avoid any crosstalk between the channels by performing a sequential scan and reducing the range of emission wavelengths for both the channels mentioned. Additionally, we confirmed that there was no chromatic aberration between both the channels by using an antibody against nuclear pore complex emitting in both channels. Anti‐NUP1 153 (ab 24700) is an antibody, ideally suited to check samples for chromatic aberration during STED imaging, staining the nuclear pores. For imaging of fixed samples in this study, the pixel size was 17 nm.
Image processing post‐image acquisition of live‐cell
SNAP movies was performed with Huygens Deconvolution software. The raw data images are provided. Due to the strong depletion and the drastic decrease in emitting fluorophores in STED microscopy, the resulting images tend to have a lower signal‐to‐noise ratio. The increase in axial resolution, and by that reduction in out of focus blur, is not the only benefit of deconvolution. The other major advantages are increase in signal‐to‐noise ratio and resolution, which enhance image quality for 2D datasets as well, as shown before 82 .
Quantification of crista junction and cristae dynamics
Blind quantification of intramitochondrial merging and splitting events in case of MIC10‐ and MIC60‐SNAP marking CJs and ATP5I‐SNAP, COX8A‐SNAP and MIC13‐SNAP marking cristae was done manually by observing the corresponding live‐cell STED movies for a time span of ~15 s obtained at a frame rate of ~2.5 s/frame. The number of merging/splitting events was divided by the mitochondrial length to yield corresponding number of events/unit length (μm) of mitochondrion. Events/μm/min of mitochondria was subsequently calculated. All quantifications were performed from three independent experiments using 3–10 mitochondria from each experiment, which were all chosen from separate cells.
Airyscan microscopy
HeLa cells were stained with 100 nM nonyl acridine orange for 1 h and imaged using Plan‐Apochromat 100×/1.46 Oil DIC M27 objective on the Zeiss LSM 880 with Airyscan. Raw.czi files were processed into deconvoluted images using the Zen software automatically. HeLa cells expressing ATP5I‐PAGFP and mitocherry were used for photoactivation experiments. Images were acquired by exciting at 488 nm using Plan‐Apochromat 63×/1.4 Oil DIC M27 objective on the Zeiss LSM 880 with Airyscan. We photoactivated a 1 × 1 μm area of the mitochondria by using a 405‐nm laser followed by acquisition of the images in fast mode every 0.2 s after photoactivation.
PEG fusion assay
PEG fusion assay was adapted from Ref. 83 . Cells expressing ATP5I‐SNAP and ATP5I‐GFP were co‐plated (1:1 ratio) in such a way that they were 100% confluent and adhering to each other on the day of PEG fusion. Cells were treated with cycloheximide (20 μg/ml) 30 min prior to PEG fusion till the time they were fixed in PFA. After PEG (suitable for hybridoma, Merck) fusion for 60 s, mitochondria from cells expressing ATP5I‐SNAP and ATP5I‐GFP were allowed to fuse for 3 h. In the last 30 min, silicon rhodamine was added to bind to those cells expressing ATP5I‐SNAP followed by three washes in serum‐free medium with cycloheximide (20 μg/ml). Cells were then fixed in pre‐warmed (37°C) 3.7% paraformaldehyde for 15 min. The paraformaldehyde also contained cycloheximide (20 μg/ml). After fixation, cells underwent immunofluorescence staining as described in the section before. Mouse Anti‐GFP (Merck, 11814460001) primary and goat anti‐mouse Abberior STAR 580 (Abberior) secondary antibodies were used.
Statistics
Statistical analysis for different experiments was done in GraphPad Prism 7.04 using unpaired Student's t ‐test except for comparison in Seahorse experiments where differences in basal oxygen consumption were compared by one‐sample t‐ test. Mean ± SEM was used for different experiments, and sample size was not predetermined using any statistical methods.
Supporting information Appendix Click here for additional data file. Expanded View Figures PDF Click here for additional data file. Movie EV1 Click here for additional data file. Movie EV2 Click here for additional data file. Movie EV3 Click here for additional data file. Movie EV4 Click here for additional data file. Movie EV5 Click here for additional data file. Movie EV6 Click here for additional data file. Movie EV7 Click here for additional data file. Movie EV8 Click here for additional data file. Movie EV9 Click here for additional data file. Movie EV10 Click here for additional data file. Movie EV11 Click here for additional data file. Movie EV12 Click here for additional data file. Movie EV13 Click here for additional data file. Movie EV14 Click here for additional data file. Movie EV15 Click here for additional data file. Review Process File Click here for additional data file.
📊 Figures
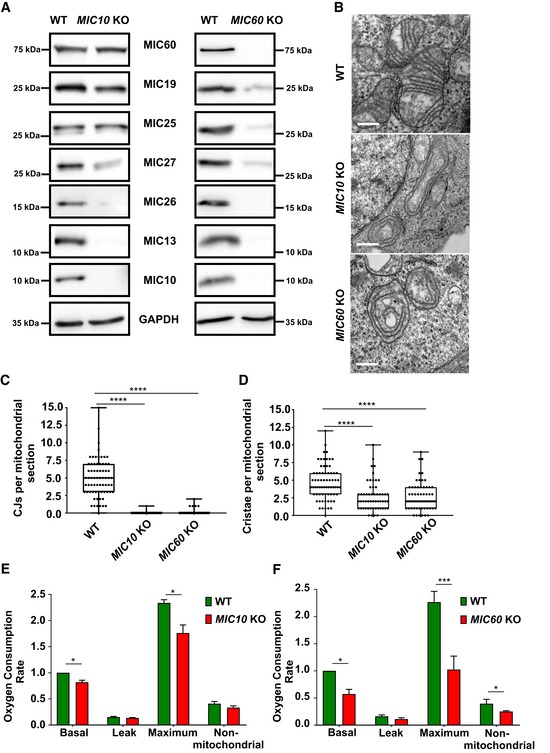
Figure 1
MIC10 and MIC60 KO HAP1 cells show loss of crista junctions and impaired cellular respiration
A Western blot analysis of lysates from WT and MIC10 KO or MIC60 KO HAP1 cells. MIC10 KO cells show a drastic reduction in MIC13, MIC26 and MIC27 protein levels, while protein levels of other MICOS co...
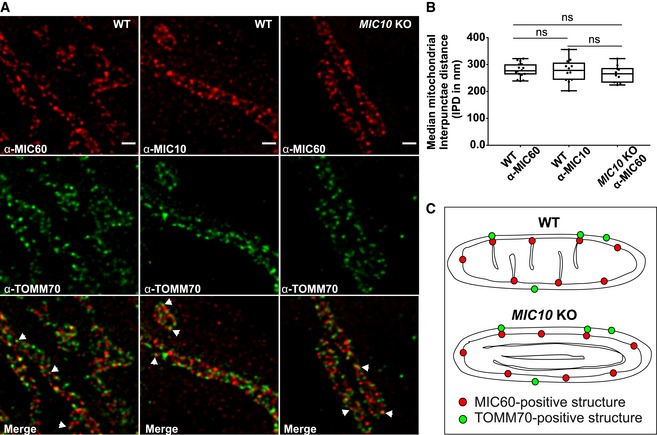
Figure 2
MIC60 assembles as regularly spaced punctae in the absence of CJs
A Representative STED superu2010resolution images of WT and MIC10 KO HAP1 cells immunostained with MIC60 or MIC10 antibodies (top panel) and TOMM70 (middle panel). Bottom panel shows merged images. Ar...
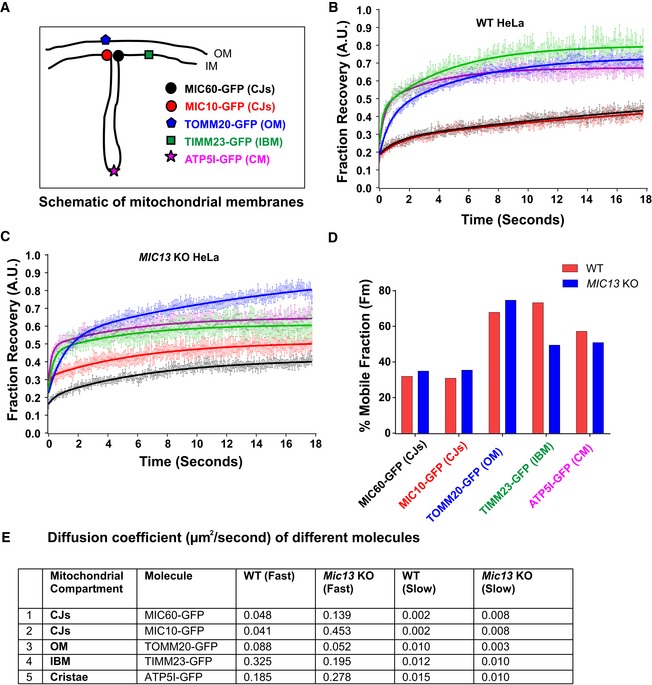
Figure 3
Mobility of crista junction proteins is restricted compared to proteins of other mitochondrial subcompartments, and loss of MIC13 affects the mobility of distinct IM proteins
A Schemeu00a0of investigated marker proteins, subjected to FRAP, located at different mitochondrial subcompartments. B, C FRAP curves (curve fitted) of WT (B) and MIC13 KO HeLa cells (C) expressing GF...
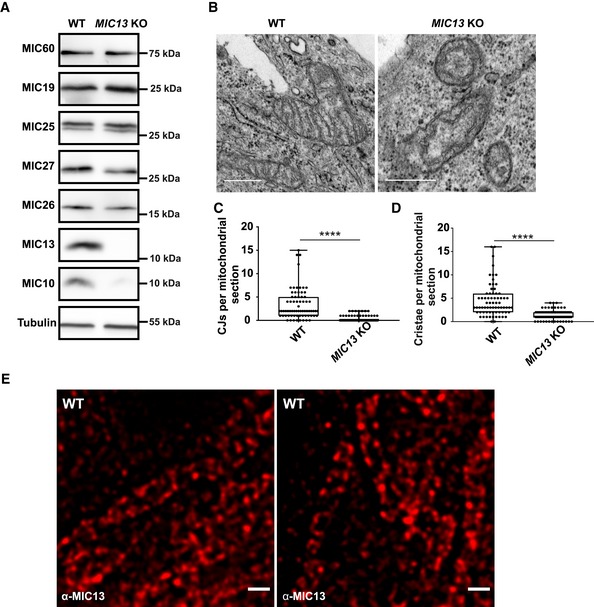
Figure EV1
Deletion of MIC13 in HeLa cells leads to a loss of crista junctions
A Western blot analysis of WT and MIC13 KO HeLa cells showing a reduction in MIC10, MIC26 and MIC27 protein levels in MIC13 KOs. B Representative electron micrographs of WT and MIC13 KO HeLa cells sho...
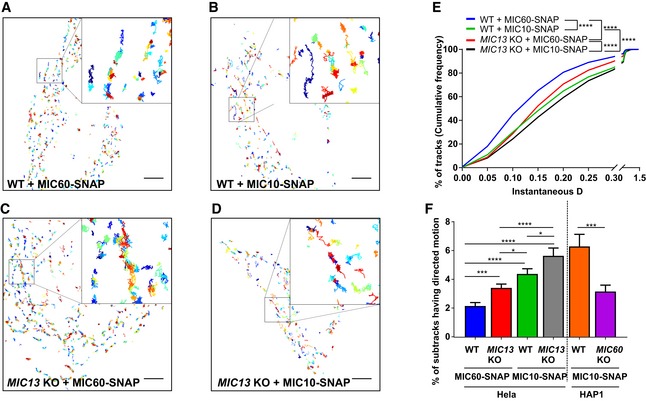
Figure 4
Singleu2010particle tracking reveals requirement of MIC60 for high directionality of MIC10 motion
Au2013D Representative singleu2010particle tracks of cells expressing MIC60u2010 (A) and MIC10u2010SNAP (B) in WT HeLa cells and MIC60u2010 (C) and MIC10u2010SNAP (D) in MIC13 KO HeLa cells, stained w...
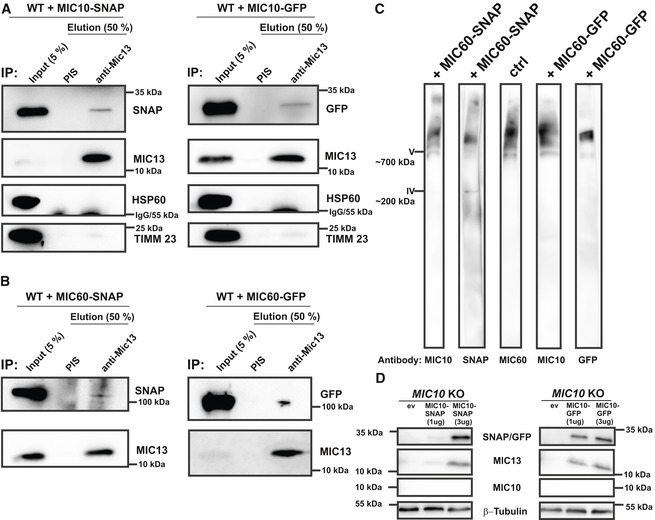
Figure EV2
Functionality and localization of MIC10 and MIC60 are not impaired by Cu2010terminal protein tags
A, B HEK293 cells expressing either MIC10u2010SNAP/GFP (A) or MIC60u2010SNAP/GFP (B) were used for coimmunoprecipitation using antiu2010MIC13 antibody. Endogenous MIC13 could pull down MIC10u2010SNAP ...
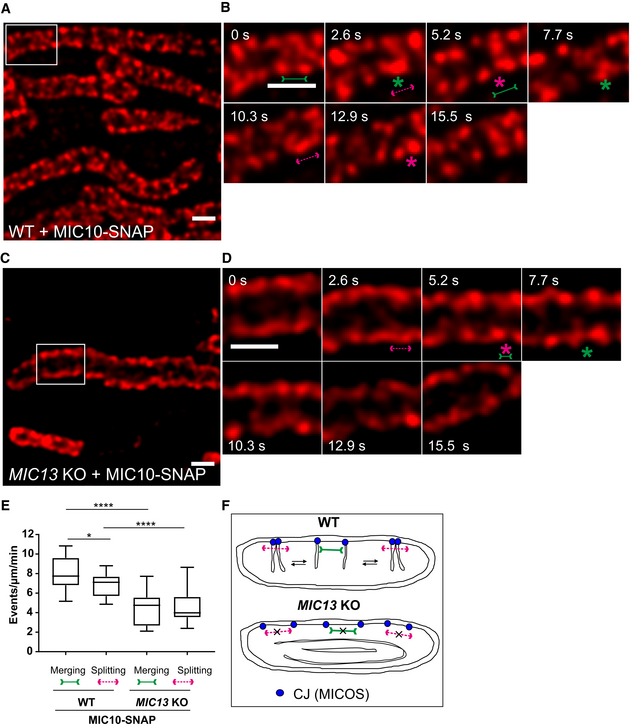
Figure 5
Crista junctions marked by MIC10u2010SNAP dynamically merge and split within a mitochondrion in a MIC13u2010dependent manner
Au2013D Representative liveu2010cell STED superu2010resolution images ( t =u00a00u00a0s) showing WT (A) and MIC13 KO (C) HeLa cells expressing MIC10u2010SNAP stained with silicon rhodamine. Boxu00a0in...
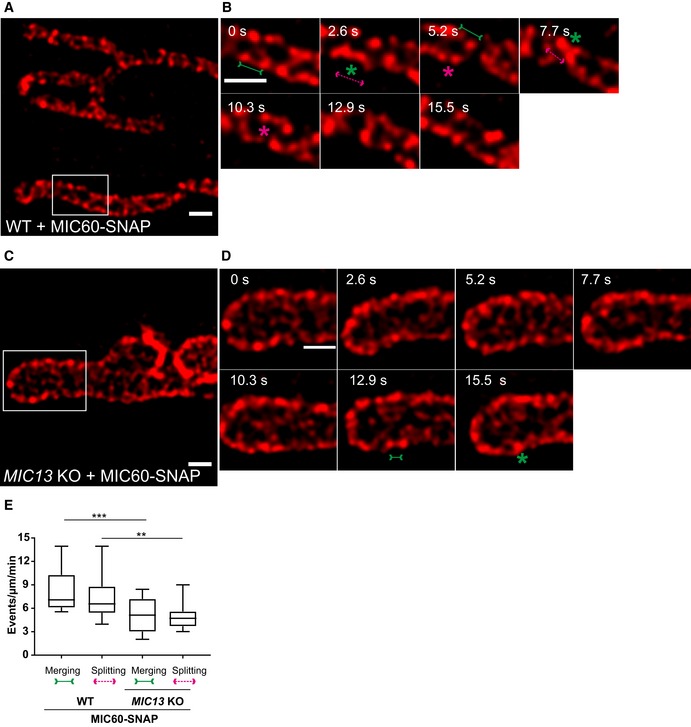
Figure EV3
Crista junctions marked by MIC60u2010SNAP dynamically merge and split within a mitochondrion in a MIC13u2010dependent manner
A Representative liveu2010cell STED superu2010resolution images ( t =u00a00u00a0s) showing WT HeLa cells expressing MIC60u2010SNAP stained with silicon rhodamine. Boxu00a0in (A) marks selection shown ...
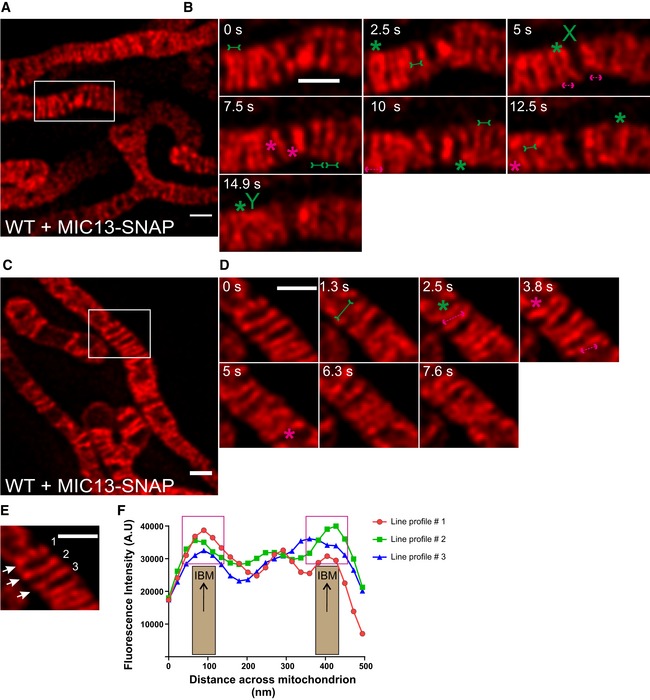
Figure 6
MIC13u2010SNAP shows that CJs and cristae undergo remodelling at a timescale of seconds
A Representative liveu2010cell STED superu2010resolution images ( t =u00a00u00a0s), showing WT HeLa cells expressing MIC13u2010SNAP, from a timeu2010series of images acquired at a time interval of 2.5...
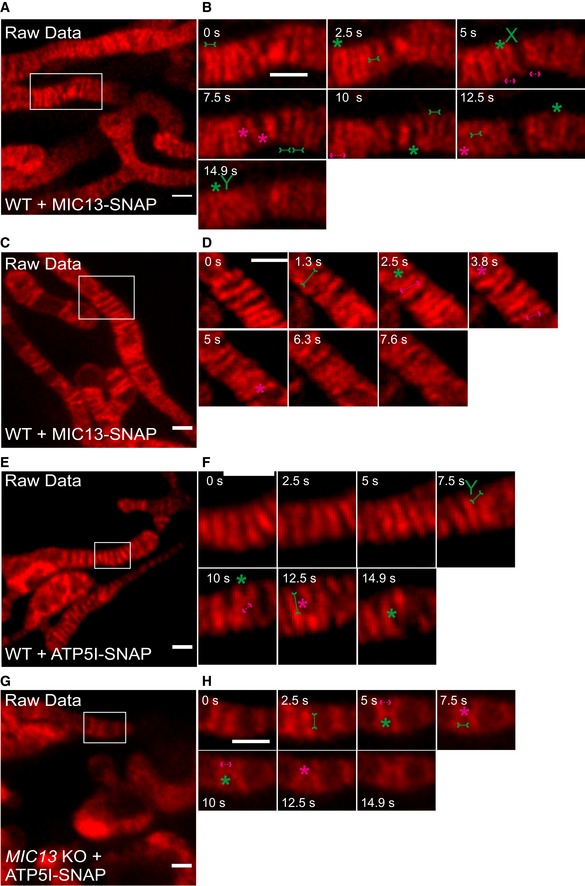
Figure EV4
Raw data of CJ and cristae dynamics
A Raw data of liveu2010cell STED superu2010resolution images ( t =u00a00u00a0s) showing WT HeLa cells expressing MIC13u2010SNAP stained with silicon rhodamine. Boxu00a0in (A) marks selection shown as ...
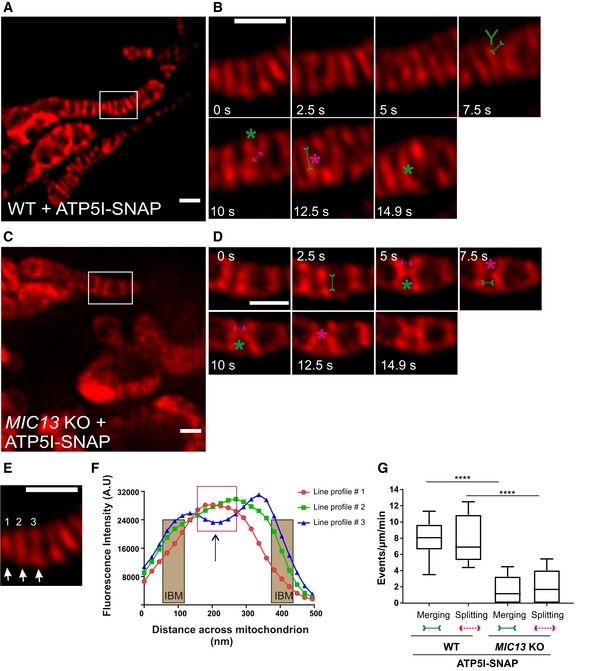
Figure 7
Cristae undergo balanced merging and splitting events in a MICOSu2010dependent manner
A Representative liveu2010cell STED superu2010resolution images ( t =u00a00u00a0s) showing WT HeLa cells expressing ATP5Iu2010SNAP stained with silicon rhodamine. Boxu00a0in (A) marks selection shown ...
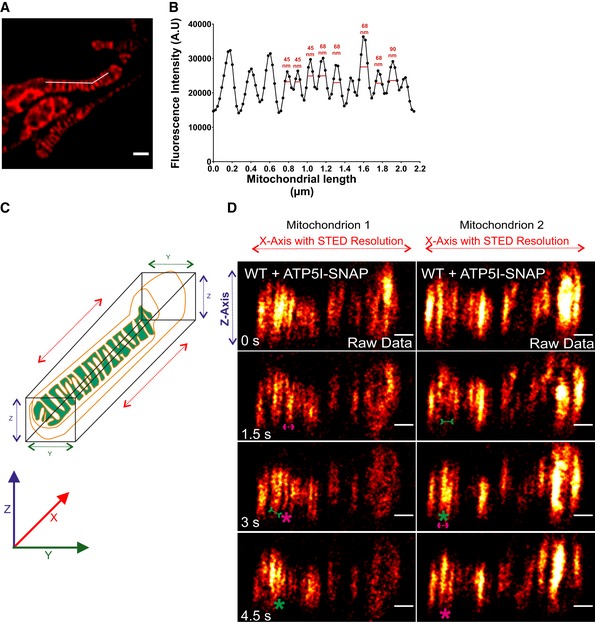
Figure EV5
Image depicting the resolution of liveu2010cell STED nanoscopy and axial dimension (XZ) of mitochondria showing cristae dynamics in lateral dimension (Xu2010axis) at STED resolution
A, B Line scan (white line) along the length of mitochondria (A) from a representative liveu2010cell STED superu2010resolution image from WT HeLa cells expressing ATP5Iu2010SNAP stained with silicon r...
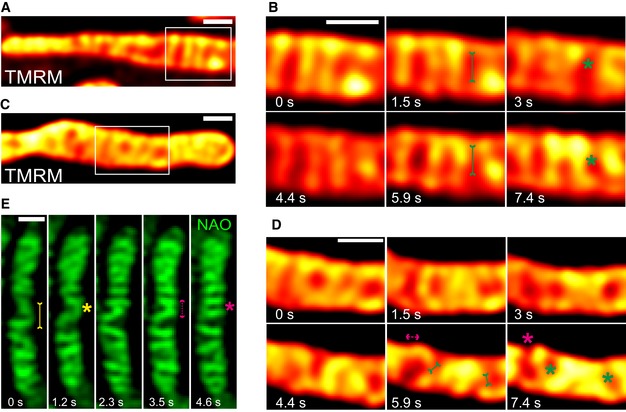
Figure 8
Cristae spatial remodelling is corroborated using mitochondrial inner membraneu2010specific dyes
A Representative liveu2010cell STED superu2010resolution images ( t =u00a00u00a0s) showing WT HeLa cells stained with TMRM. Boxu00a0in (A) marks selection shown as a zoom in panel (B) (red hot LUT). S...
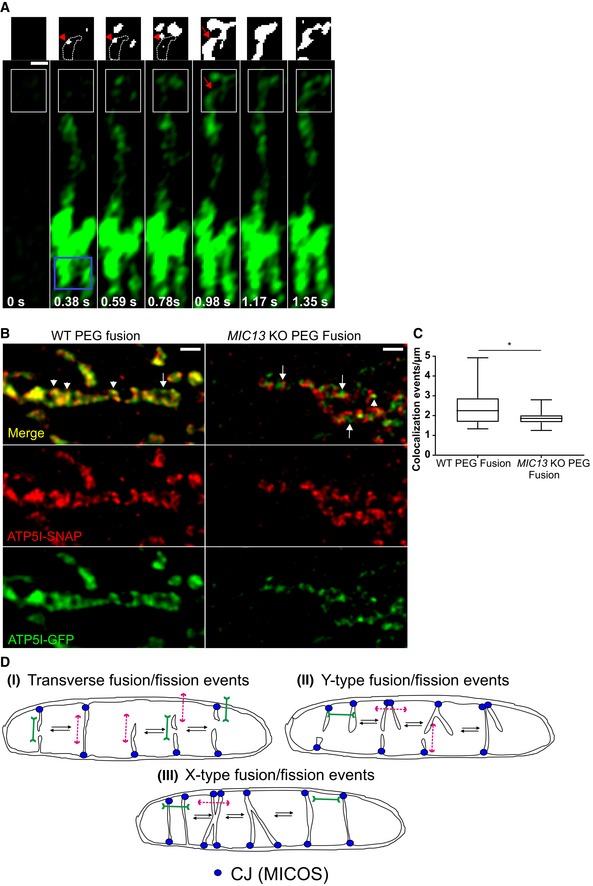
Figure 9
Demonstration of content mixing in mitochondria using intramitochondrial cristae photoactivation and PEG fusion experiments
A Mitochondrion in WT HeLa cells expressing ATP5Iu2010PAGFP was photoactivated, in the area shown by a blue box, at 0u00a0s. Inset of white box at 0.98u00a0s clearly shows fluorescent crista (red arro...
Figure images are served from the NIH/NLM PubMed Central Open Access Subset or Europe PMC; copyright remains with the publishers and authors.
💬 Discussion
0 commentsNo comments yet. Be the first to start a discussion!
Leave a Comment