Abstract
Reassortment of influenza viral RNA (vRNA) segments in co-infected cells can lead to the emergence of viruses with pandemic potential. Replication of influenza vRNA occurs in the nucleus of infected cells, while progeny virions bud from the plasma membrane. However, the intracellular mechanics of vRNA assembly into progeny virions is not well understood. Here we used recent advances in microscopy to explore vRNA assembly and transport during a productive infection. We visualized four distinct vRNA segments within a single cell using fluorescent in situ hybridization (FISH) and observed that foci containing more than one vRNA segment were found at the external nuclear periphery, suggesting that vRNA segments are not exported to the cytoplasm individually. Although many cytoplasmic foci contain multiple vRNA segments, not all vRNA species are present in every focus, indicating that assembly of all eight vRNA segments does not occur prior to export from the nucleus. To extend the observations made in fixed cells, we used a virus that encodes GFP fused to the viral polymerase acidic (PA) protein (WSN PA-GFP) to explore the dynamics of vRNA assembly in live cells during a productive infection. Since WSN PA-GFP colocalizes with viral nucleoprotein and influenza vRNA segments, we used it as a surrogate for visualizing vRNA transport in 3D and at high speed by inverted selective-plane illumination microscopy. We observed cytoplasmic PA-GFP foci colocalizing and traveling together en route to the plasma membrane. Our data strongly support a model in which vRNA segments are exported from the nucleus as complexes that assemble en route to the plasma membrane through dynamic colocalization events in the cytoplasm.
🔬 Techniques
🔭 Microscopes
🧬 Organisms
💻 Software
✨ Fluorophores
🧪 Sample Preparation
🔬 Cell Lines
🏭 Microscope Brands
🧪 Reagent Suppliers
📷 Detectors
🔎 Objectives
💻 Software Details
💾 Data Repositories
🏛️ Research Organizations (ROR)
Affiliated research institutions:
📋 Methods
Cells and viruses Madin-Darby Canine kidney (MDCK) epithelial cells and adenocarcinoma human alveolar basal epithelial cells (A549) obtained from ATCC were maintained in modified Eagle's medium (MEM) with 10% fetal calf serum (FCS) and L-glutamine or Dulbecco's MEM (DMEM) with 10% FCS respectively. 293T cells (from ATCC) were used to rescue recombinant viruses and were maintained in 10% FCS DMEM. Recombinant A/WSN/1933 (H1N1) viruses were rescued using an eight-plasmid (pHW2000) reverse genetics system, a kind gift from Dr. Richard Webby of St. Jude Children's Research Hospital. WSN PA-GFP was constructed by engineering a silent Xba1 site in PA using site-directed mutagenesis (Stratagene Santa Clara, CA) into both pHW2000 WSN PA and pCDNA WSN PA-GFP [33] at position 1986 (WT PA 1984- TC A AGA – 1989; PA XBA1 1984- TC T AGA – 1989). The pCDNA WSN PA-GFP plasmid contained an Xba1 site just after the GFP stop codon, so this plasmid was cut with Xba1, and the C-terminal PA-GFP fusion was inserted into the pHW2000 WSN PA Xba1 digested vector. This strategy will result in a duplication of 165 base pairs of the WSN PA coding region after the GFP stop codon as depicted in Figure 4A . WT WSN and WSN PA-GFP viruses were rescued by transfection in 293T cells with TransIT transfection reagent (Mirus Bio Madison, WI) and then plaque purified on MDCK cells. GFP positive plaques were used to inoculate 10-day old embryonated chicken eggs. Infectivity titers for all virus stocks were calculated the 50% tissue culture infectious dose (TCID 50 ) per mL as described in [52] . Western blot analysis for GFP (mouse anti-GFP antibody, Living Colors, Invitrogen 1∶1,000) or viral NP (mouse anti-Influenza A NP antibody, Millipore 1∶5,000) was performed on purified viruses amplified in embryonated egg allantoic fluid.
Show full methods section
Cells and viruses Madin-Darby Canine kidney (MDCK) epithelial cells and adenocarcinoma human alveolar basal epithelial cells (A549) obtained from ATCC were maintained in modified Eagle's medium (MEM) with 10% fetal calf serum (FCS) and L-glutamine or Dulbecco's MEM (DMEM) with 10% FCS respectively. 293T cells (from ATCC) were used to rescue recombinant viruses and were maintained in 10% FCS DMEM. Recombinant A/WSN/1933 (H1N1) viruses were rescued using an eight-plasmid (pHW2000) reverse genetics system, a kind gift from Dr. Richard Webby of St. Jude Children's Research Hospital. WSN PA-GFP was constructed by engineering a silent Xba1 site in PA using site-directed mutagenesis (Stratagene Santa Clara, CA) into both pHW2000 WSN PA and pCDNA WSN PA-GFP [33] at position 1986 (WT PA 1984- TC A AGA – 1989; PA XBA1 1984- TC T AGA – 1989). The pCDNA WSN PA-GFP plasmid contained an Xba1 site just after the GFP stop codon, so this plasmid was cut with Xba1, and the C-terminal PA-GFP fusion was inserted into the pHW2000 WSN PA Xba1 digested vector. This strategy will result in a duplication of 165 base pairs of the WSN PA coding region after the GFP stop codon as depicted in Figure 4A . WT WSN and WSN PA-GFP viruses were rescued by transfection in 293T cells with TransIT transfection reagent (Mirus Bio Madison, WI) and then plaque purified on MDCK cells. GFP positive plaques were used to inoculate 10-day old embryonated chicken eggs. Infectivity titers for all virus stocks were calculated the 50% tissue culture infectious dose (TCID 50 ) per mL as described in [52] . Western blot analysis for GFP (mouse anti-GFP antibody, Living Colors, Invitrogen 1∶1,000) or viral NP (mouse anti-Influenza A NP antibody, Millipore 1∶5,000) was performed on purified viruses amplified in embryonated egg allantoic fluid.
Immunofluorescence
MDCK or A549 cells grown on circular coverslips (12Cir-1.5, Fisher Scientific Pittsburgh, PA) were infected with virus for the time and multiplicity of infection (MOI) specified in the figure legends. The cells were fixed with 4% paraformaldehyde (PFA) and probed with anti-Influenza A NP antibody (Millipore 1∶2,000) for one hour followed by Alexa Fluor-594 goat anti-mouse Fab' fragment (Invitrogen 1∶2,000) for visualization of viral NP protein. To determine the role of Crm1 on the export of WSN PA-GFP protein, cells were infected with WSN PA-GFP virus and treated 4 hours post infection (hpi) with leptomycin B (2.5 mg/mL) that was kept on for the remainder of the infection. Cells were fixed 16 hpi and stained as described above. Four color fluorescent in situ hybridization (FISH) Probes for FISH were designed and purchased from BioSearch Technologies (Novato, CA) and were directed against each vRNA segment. Each probe is ∼20 base pairs and ∼30 probes cover the length of a given vRNA target. The sequence of each probe was manually compared against the entire WSN influenza genome to ensure specificity to the targeted vRNA segment; any probes with greater than 10 base pairs complementarity to another vRNA target or to a mRNA sequence were excluded prior to purchase. This rigorous evaluation of the FISH probe sequences allowed for high specificity of the FISH probes to the specific vRNA segment. The fluorophores used in our four-color FISH experiments are: Quasar 570, CAL Fluor Red 590, Quasar 670, and Alexa-Fluor 488. FISH probes conjugated to the Alexa-Fluor 488 fluorophore were produced manually to amine-terminal oligos synthesized by BioSearch Technologies and conjugated using the Invitrogen Alexa-Fluor 488 Oligonucleotide Amine Labeling kit per the manufacturer's recommendations. Infected cells were stained with FISH probes from BioSearch using a standard protocol previously described in [53] . Briefly, cells grown on circular coverslips were infected at an MOI = 3 and fixed 8 hpi with 4% PFA stored in ice cold 70% EtOH overnight. The next day the coverslips were rehydrated with the wash buffer (10% formamide and 2× SSC in DEPC-treated water). Cells were incubated overnight in 200 µl of hybridization buffer (10% dextran sulfate, 2 mM vanadyl-ribonucleoside complex, 0.02% RNA-free BSA, 1 mg/ml e.Coli tRNA, 2× SSC, and 10% formamide in DEPC treated water) with 2 µl of labeled probes (probe concentrations ranged from 2.5 µM–10 µM) and incubated overnight in a 28°C incubator. The following day, the hybridization buffer was removed and cells were incubated in wash buffer containing DAPI for 10 minutes, washed then mounted. All incubations were performed in the dark. Spectral separation of the four fluorophores was achieved using a Leica SP5 white-light laser confocal microscope. A sequential scanning program with a line average of 4 between frames was established based on the manufacturer's excitation and emission spectra for each fluorophore. The following parameters were used: PMT1 (DAPI) UV laser (power = 4%) wavelength range 415–470 nm, PMT2 (Alexa-Fluor 488) 488 nm excitation wavelength (λ ex ) (power = 10%) range 500–540 nm, PMT3 (Quasar 570) 545 nm λ ex (12%) range 553–585 nm, PMT4 (Cal Fluor Red 590) 575 nm λ ex (12%) range 590–635 nm, and PMT5 (Quasar 670) 647 nm λ ex (12%) range 675–750 nm. Spectral separation was confirmed in each experiment with single color controls (infected cells stained with only a single vRNA FISH probe set). FISH colocalization WT WSN virus infected cells were probed with different combinations of FISH probes ( Table S1 ) to assess colocalization between individual segments. Cells were imaged using the sequential scanning program on the Leica SP5 white light laser confocal microscope. To obtain close to Nyquist sampling, stacks of each cell were taken with 0.17 µm separation between slices and the height of the stacks was determined for each cell based on the FISH staining. Images were acquired at 1024×1024 pixel resolution with a 63× Leica objective with a numerical aperture (NA) of 1.4 and a zoom of 4; the resulting pixel size was ∼50×50×168 nm. Background subtraction and subsequent deconvolution of each stack was performed manually for each channel using Huygens Essential software (Version 4.3.1p3, Scientific Volume Imaging BV, Hilversum, Netherlands). Imaris software (version 7.6.3, Bitplane AG, Zurich, Switzerland) was used for 3D reconstruction, particle tracking, colocalization and statistical analysis. Pearson coefficients in colocalized volumes were obtained between each vRNA probe set from the deconvolved images using Imaris colocalization analysis. The DAPI stain was used to create a channel mask (smoothing = 0.9) to exclude the vRNA nuclear stain from the colocalization quantification. Thus, we were able to compare the staining of different vRNA segments in the cytoplasm of an infected cell. At least 3 different cell volumes were analyzed for each vRNA pair. To determine the vRNA composition and distance from the nucleus of each cytoplasmic focus we used the Imaris software to create ‘Spots’ from the signal of each channel in the cytoplasm (using the nuclear mask created earlier). All spots from each channel were merged into one ‘Spots’ channel, which created a single spot for every cytoplasmic focus within an infected cell, with intensity values for each channel. This information was used to determine the number of spots positive for all 4 channels versus 3 channels, 2 channels, or a single channel. The frequency of spots from three independent cells was recorded; the numbers were compared using column statistical comparison and a Chi-Squared test using the graphing software, Prism (version 5.0, GraphPad, San Diego, CA), to determine if there was a significant difference between any of the distributions. A separate surface to define the boundary of the cell was created manually based on the vRNA staining pattern in every z-plane. The distance from the nucleus, defined by DAPI staining, was calculated for each spot within this surface and the frequency of spots in 100 nm distance increments was recorded from four independent cells. FISH probe specificity To confirm the specificity of each FISH probe set, two coverslips of A549 cells were transfected with a pPol1 plasmid expressing each vRNA segment of the WSN virus using Fugene HD (Promega, Madison, WI). Cells were fixed 24 hours post-transfection and processed for FISH staining as described above. Transfected cells were stained with FISH probe reactions B and E ( Table S1 ) to ensure coverage of all 8 vRNA segments. FISH stained slides were visualized on a Leica SP5 white light laser microscope using the sequential parameters described above for four color FISH.
Visualization of Rab11a Plasmids expressing Rab11a
GFP were a kind gift from Dr. Julie Donaldson, National Heart Lung and Blood Institute (NHLBI) and were transfected into A549 cells using Fugene HD transfection reagent (Promega, Madison, WI). 24 hours post-transfection the cells were infected with WT WSN virus (MOI = 3) for subsequent FISH analysis as described above. Images of cells transfected with Rab11a-GFP and stained for vRNA segments were taken on a Leica SP5 confocal microscope using a 63× Leica objective with NA of 1.4.
Live cell imaging iSPIM
MDCK or A549 cells were seeded onto rectangular coverslips (VWR, 48393-241) and then placed into an imaging chamber (Applied Scientific Instrumentation, I-3078-2450) that fit into a custom-built inverted selective plane illumination microscope (iSPIM). Cells were infected in the chamber at an MOI = 5 and then placed in a 37°C incubator for 16 hours prior to imaging. The iSPIM system was modified from our original design [38] , equipped with a 0.3 NA excitation objective (Nikon 10×, 3.5 mm working distance) and a higher, 1.0 NA detection objective (Zeiss, W Plan-Apochromat 63×, 2.1 mm working distance) to increase spatial resolution and fluorescence signal collection. The 488 nm excitation power was set at 50 µW (as measured before the excitation objective), and an electron-multiplying charge coupled device (EM-CCD, Andor, iXon DU-897T) was used to capture fluorescence. We recorded 40 planes per volume for each cell, spacing planes every 1 µm. Volumes were acquired every 2 seconds for a total of 30 minutes.
Point scanning confocal microscopy
The spread of influenza was captured on a Leica SP5 point scanning confocal microscope using a 1.4 NA 63× objective. MDCK cells were seeded into an 8-well chambered coverglass slide (Nunc, Rochester, NY) and infected with an MOI = 0.1 with WSN PA-GFP virus. Four hours post-infection, the slides were placed onto the microscope inside a temperature (37°C) and 5% CO 2 controlled incubator (Microscope incubator S-2, PeCon GmbH, Erbach, Germany). We captured 5 slices per field of view, with ∼1 µm separation between slices, every 10 min for 16 hours. The DIC channel was used to determine stack height. Tracking cytoplasmic PA-GFP 3D image stacks captured using the iSPIM were background subtracted and deconvolved using the Huygens software package (SVI, Huygens Professional) using the ‘Classic MLE’ setting with 40 iterations per deconvolution. The resulting datasets were analyzed in ImageJ, generating maximum intensity projections (as displayed in Figure 6A ) and axial intensity profiles ( Figure 6D ). In order to track the motion of cytoplasmic foci, deconvolved datasets were loaded into Imaris for tracking. Manual tracking was performed using the ‘Spots’ function under the Imaris Surpass toolbox and the location of a PA-GFP focus was determined over all frames. A minimum of 30 tracks were collected for each cell type. Statistics for tracks, including the mean track speed, track duration, intensity of the focus over the length of the track, and the xyz position of each focus in each frame throughout the trace were calculated using Imaris. The trajectories for each focus were next analyzed in MATLAB using custom software in order to calculate the mean squared displacements (MSD) vs. time lag ( Figure S4 ). Fusion and transient colocalization events were tallied. Fusions were classified as events wherein two foci came together in a diffraction limited spot and subsequently moved together as a single particle, and confirmed by assessing the axial intensity profile of the particle ( Figure 6D ). Transient colocalizations were scored as events where two foci came together within a diffraction limited spot for a limited period of time, and did not move together afterwards.
Supporting Information Figure S1 Minimal bleed-through between four FISH visualization channels. MDCK cells infected with WT WSN (MOI = 3) for 8 hpi were probed with a single FISH probe and visualized with the four-color imaging parameters. Fluorescence of each probe was only seen in the specified channel, demonstrating our ability to spectrally separate all four FISH probe fluorophores. All scale bars are 10 µm. (PDF) Click here for additional data file. Figure S2 WSN vRNA FISH probe specificity. A549 cells were transfected with individual WSN vRNA Pol1 expression plasmids. Twenty-four hours post-transfection, cells were probed for all eight vRNA segments using the FISH assay. Only cells transfected with the pPol1 plasmid expressing the vRNA that corresponded to the FISH probe had any detectable fluorescence staining. The distribution of vRNA in the transfected cells was different from infected cells, likely because a typical RNP structure was not formed due to lack of NP and polymerase expression. All scale bars are 5 µm. (PDF) Click here for additional data file. Figure S3 The majority of cytoplasmic foci contain at least 4 vRNA segments. The number of total foci containing 1, 2, 3 or 4 vRNA segments were quantified for MDCK cells (MOI = 3) for 8 hpi stained with probe reactions A, C, D, E and F listed on Table S1 . Note that Figure 2B depicts the composition of cells stained with probe B. Each bar represents the percent of foci that contained either 1, 2, 3 or all 4 labeled vRNA segments and is an average of three independent cells that each contained between 1,000–4,000 distinct cytoplasmic foci. The standard error is indicated on each bar. (PDF) Click here for additional data file. Figure S4 Cytoplasmic localization of WSN PA-GFP, NP, and vRNA is CRM1 dependent. Visualization of PA-GFP, PB2 vRNA segment, and HA vRNA segment in MDCK cells infected with WSN PA-GFP virus and treated with or without leptomycin B (LMB) (A). All scale bars are 5 µm. The percent of WSN PA-GFP infected MDCK cells with cytoplasmic staining of PA-GFP, PB2 vRNA segment, or α-NP in the presence or absence of LMB was calculated (B). Percentage is based on at least 40 cells. (PDF) Click here for additional data file. Figure S5 Mean squared displacement (MSD) curves for PA-GFP tracks in MDCK and A549 cells. The MSD over time was calculated for each track from MDCK and A549 cells and a representative track demonstrating active transport (A and C) and diffusive transport (B and D) are presented. Polynomial or linear lines of best-fit, dashed black line on each graph, are shown on active or diffusive curves respectively. The equation for the line of best-fit and R-value are displayed and was used to confirm whether the trajectory was active or diffusive. The standard deviation is presented for each time lag. (PDF) Click here for additional data file. Figure S6 Colocalization of influenza vRNA with Rab11a. A549 cells were transfected with Rab11a-GFP and then infected with WT WSN (MOI = 1). Cells were probed 16 hpi for PB2 vRNA segment using FISH. The images on the right are enlarged from the area denoted by the dashed box. All scale bars are 10 µm. (PDF) Click here for additional data file. Movie S1 iSPIM movie of MDCK cells infected with WSN PA-GFP. MDCK cells were infected for 16 hours and imaged for 30 min with an entire cell volume captured every 2 seconds. Scale bar: 10 µm. (AVI) Click here for additional data file. Movie S2 iSPIM movie of A549 cells infected with WSN PA-GFP. A549 cells were infected for 16 hours and then imaged for 30 min with an entire cell volume captured every 2 seconds. Scale bar: 10 µm. (AVI) Click here for additional data file. Movie S3 Overnight confocal movie of WSN PA-GFP spread in MDCK cells. MDCK cells were infected with WSN PA-GFP (MOI = 0.1) and imaging was initiated 4 hpi. A z stack (5 slices) was taken every 10 min for 16 hours with the cells maintained in a temperature and CO 2 controlled microscope chamber. The GFP and DIC channels are overlaid to allow for identification of infected cells. This movie displays the spread of WSN PA-GFP and the initiation of infection. Scale bar: 5 µm. (AVI) Click here for additional data file. Table S1 Strategy for multiplexing FISH probes to compare all vRNA segments to each other. (PDF) Click here for additional data file. Table S2 Number of transient colocalization and fusion events in PA-GFP tracks in MDCK cells. (PDF) Click here for additional data file. Table S3 Number of transient colocalization and fusion events in PA-GFP tracks in A549 cells. (PDF) Click here for additional data file.
📊 Figures
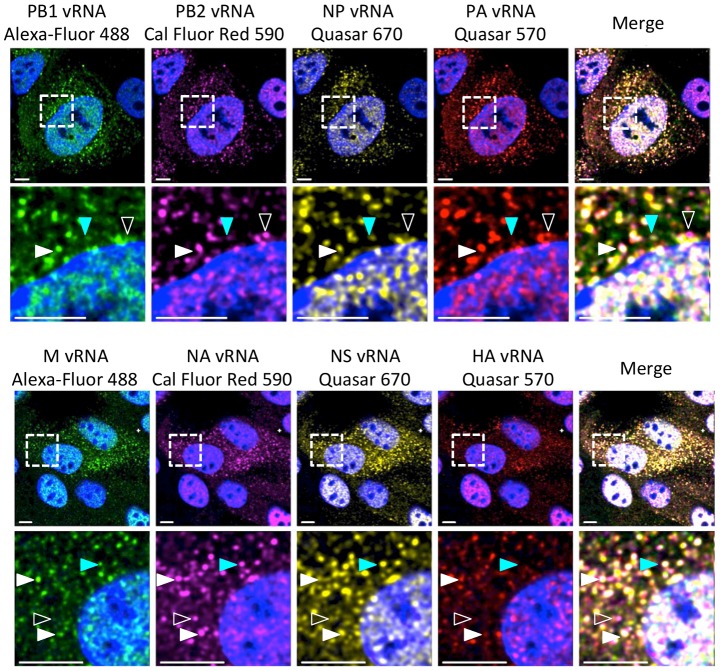
Figure 1
Visualization of four distinct influenza viral gene segments within a single cell.
MDCK cells were infected with wild type (WT) WSN at a multiplicity of infection (MOI) of 3 for 8 hours post infection (hpi) and then imaged with FISH probes directed against four distinct vRNA species...
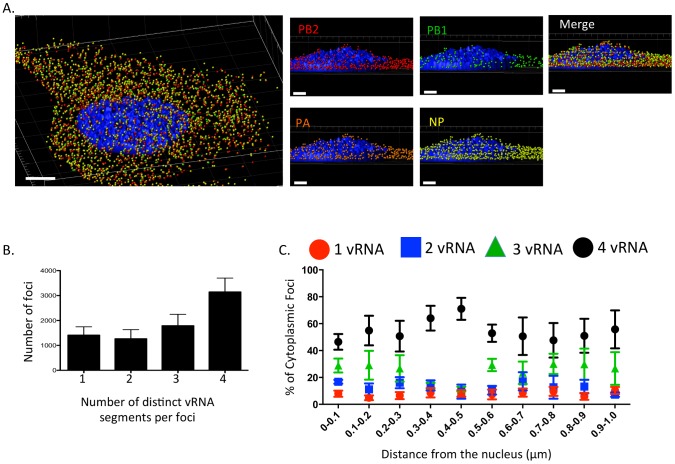
Figure 2
Viral RNA composition and spatial location of cytoplasmic foci.
3D rendering of an MDCK cell infected with WT WSN (MOIu200a=u200a3) for 8 hpi were stained with probe B from Table S1 : WSN PB2 Quasar 570 (red spots), PB1 Alexa-Fluor 488 (green spots), PA Cal Fluor ...
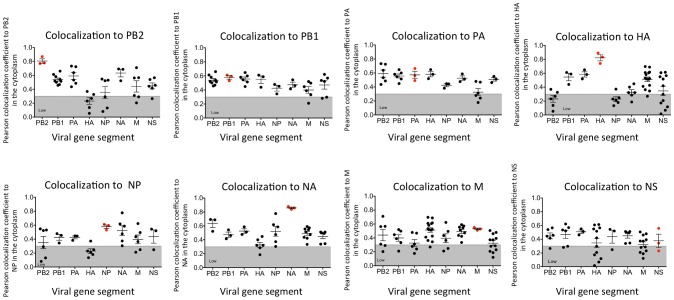
Figure 3
Colocalization coefficients between influenza vRNA segments.
Graphical representation of the Pearson correlation coefficient values between each vRNA segment and all other vRNA segments from exclusively cytoplasmic staining. Dual staining of infected cells with...
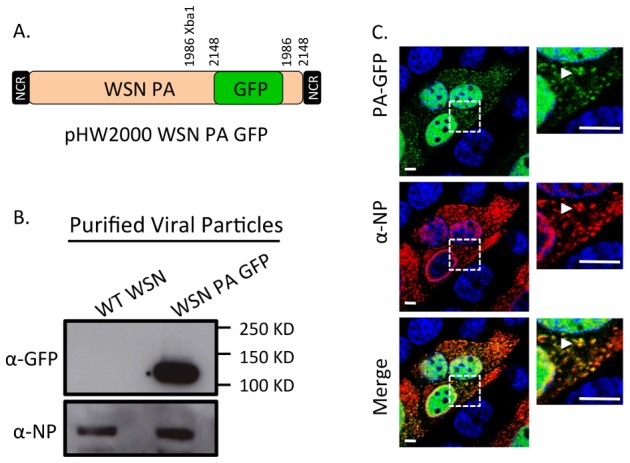
Figure 4
Generation of WSN PA-GFP influenza virus.
Schematic of the reverse genetics pHW2000 plasmid created by inserting the coding region of full length GFP into the C-terminal domain of the WSN PA open reading frame (A). This insertion included a d...
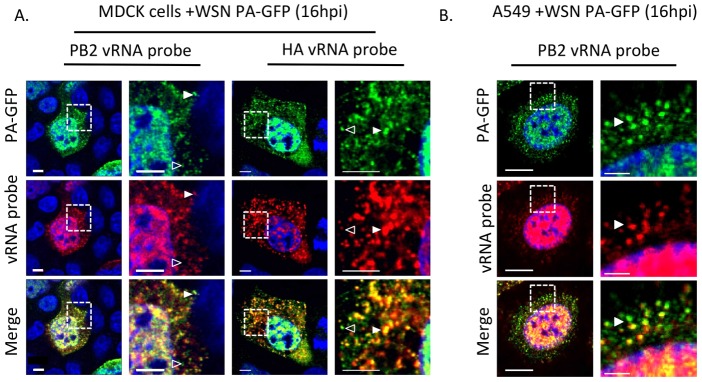
Figure 5
Colocalization of WSN PA-GFP and influenza vRNA segments.
Fluorescent in situ hybridization (FISH) for viral RNA segments 1 (PB2) and 4 (HA) on MDCK (A) or A549 cells (B) cells 16 hpi with WSN PA-GFP (MOIu200a=u200a0.5). Images to the right are enlarged regi...
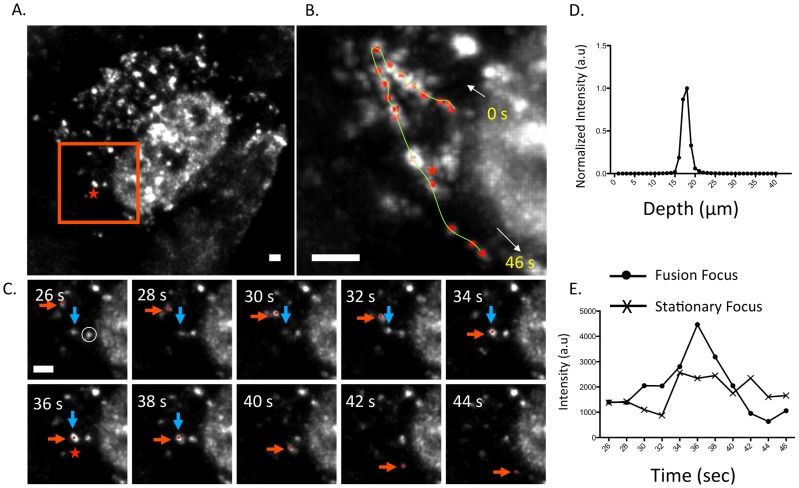
Figure 6
Fusion event of an WSN PA-GFP focus in the cytoplasm of MDCK cells.
Maximum intensity projection from inverted selective-plane illumination microscopy (iSPIM) movie of MDCK cells infected with WSN PA-GFP (MOIu200a=u200a5) at 16 hpi, 36 seconds (s) after onset of track...
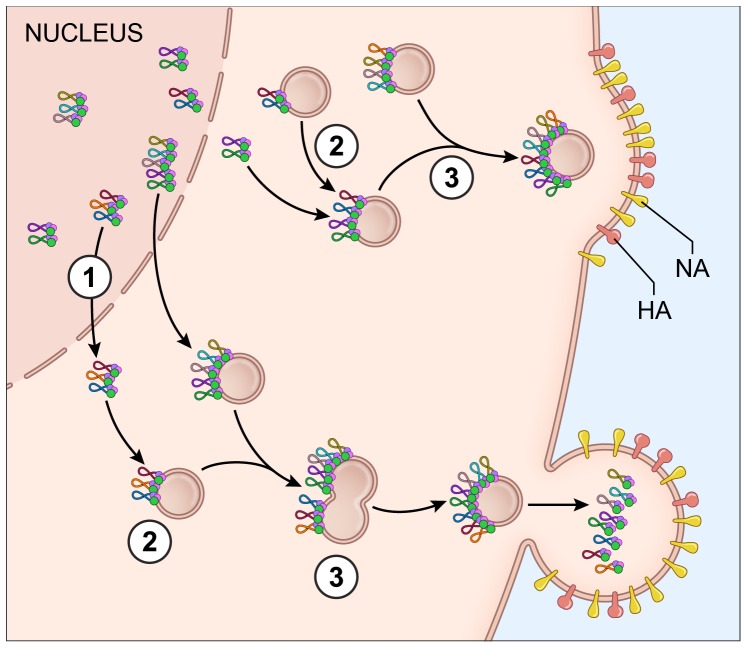
Figure 7
Proposed model for vRNA assembly.
The data presented in this paper supports a model of vRNA assembly whereby 1) vRNA segments export from the nucleus as complexes containing multiple vRNA segments, 2) cytoplasmic foci containing vRNA ...
Figure images are served from the NIH/NLM PubMed Central Open Access Subset or Europe PMC; copyright remains with the publishers and authors.
💬 Discussion
0 commentsNo comments yet. Be the first to start a discussion!
Leave a Comment