Abstract
Tight junctions (TJs) between blood-brain barrier (BBB) endothelial cells construct a robust physical barrier, whose damage underlies BBB dysfunctions related to several neurodegenerative diseases. What makes these highly specialized BBB-TJs extremely restrictive remains unknown. Here, we use super-resolution microscopy (dSTORM) to uncover new structural and functional properties of BBB TJs. Focusing on three major components, Nano-scale resolution revealed sparse (occludin) vs. clustered (ZO1/claudin-5) molecular architecture. In mouse development, permeable TJs become first restrictive to large molecules, and only later to small molecules, with claudin-5 proteins arrangement compacting during this maturation process. Mechanistically, we reveal that ZO1 clustering is independent of claudin-5 in vivo. In contrast to accepted knowledge, we found that in the developmental context, total levels of claudin-5 inversely correlate with TJ functionality. Our super-resolution studies provide a unique perspective of BBB TJs and open new directions for understanding TJ functionality in biological barriers, ultimately enabling restoration in disease or modulation for drug delivery.
🔬 Techniques
🔭 Microscopes
💻 Software
✨ Fluorophores
🧪 Sample Preparation
🔬 Cell Lines
🏭 Microscope Brands
🧪 Reagent Suppliers
💻 Software Details
💻 Code & Software
💾 Data Repositories
🏷️ Research Resource Identifiers (RRIDs)
Verified research resources used in this paper:
🏛️ Research Organizations (ROR)
Affiliated research institutions:
📋 Methods
Animals ICR (CD-1, Envigo, Rehovot, Israel) mice were used for embryonic and post-natal BBB functionality assays and dSTORM imaging. Pregnant mice were obtained following overnight mating (day of vaginal plug is defined as embryonic day 0.5). All animals were housed in SPF conditions and treated according to institutional guidelines approved by the Institutional Animal Care and Use Committee (IACUC) at Hebrew University. The claudin-5 mutant mice ( Nitta et al., 2003 ) were kindly provided by Dr. Mikio Furuse (National Institute for Physiological Sciences, Japan). Mice were housed in individually ventilated cages under specific pathogen-free conditions at 22 °C with free access to chow and water. E16 claudin-5 wild-type and null embryos were obtained according to procedures approved by the Veterinary Office of the Canton Bern, Switzerland. Claudin-5 null mutant and wild-type embryos were genotyped using lysates prepared from tips of tails using the following 3 PCR primers: Cldn5 _UPS: GCCCCTACTAGGACAGAAACTGGTAG ; Cldn5 _REV1: CAGACCCAGAATTTCCAACGCTGC and PGK-pA-FW1: GCCTGCTCTTTACTGAAGGCTCTT , which provide a 422 bp product for the claudin-5 wild-type allele and a 630 bp product for the claudin-5-knockout allele. PCR cycling conditions were: 4 min 94 °C; 1 min each at 94 °C, 64°C and 72°C; repeated 35 times and a final 5 min elongation step at 72 °C.
Tissue preparation
After dissection, brains were placed in 4% paraformaldehyde (PFA, Sigma Aldrich) at 4 °C overnight, cryopreserved in 30% sucrose and frozen in TissueTek OCT (Sakura). Frozen brains were cut to 5–8 µm slices for immunofluorescent staining (CM1950, Leica) to produce coronal brain sections.
Show full methods section
Animals ICR (CD-1, Envigo, Rehovot, Israel) mice were used for embryonic and post-natal BBB functionality assays and dSTORM imaging. Pregnant mice were obtained following overnight mating (day of vaginal plug is defined as embryonic day 0.5). All animals were housed in SPF conditions and treated according to institutional guidelines approved by the Institutional Animal Care and Use Committee (IACUC) at Hebrew University. The claudin-5 mutant mice ( Nitta et al., 2003 ) were kindly provided by Dr. Mikio Furuse (National Institute for Physiological Sciences, Japan). Mice were housed in individually ventilated cages under specific pathogen-free conditions at 22 °C with free access to chow and water. E16 claudin-5 wild-type and null embryos were obtained according to procedures approved by the Veterinary Office of the Canton Bern, Switzerland. Claudin-5 null mutant and wild-type embryos were genotyped using lysates prepared from tips of tails using the following 3 PCR primers: Cldn5 _UPS: GCCCCTACTAGGACAGAAACTGGTAG ; Cldn5 _REV1: CAGACCCAGAATTTCCAACGCTGC and PGK-pA-FW1: GCCTGCTCTTTACTGAAGGCTCTT , which provide a 422 bp product for the claudin-5 wild-type allele and a 630 bp product for the claudin-5-knockout allele. PCR cycling conditions were: 4 min 94 °C; 1 min each at 94 °C, 64°C and 72°C; repeated 35 times and a final 5 min elongation step at 72 °C.
Tissue preparation
After dissection, brains were placed in 4% paraformaldehyde (PFA, Sigma Aldrich) at 4 °C overnight, cryopreserved in 30% sucrose and frozen in TissueTek OCT (Sakura). Frozen brains were cut to 5–8 µm slices for immunofluorescent staining (CM1950, Leica) to produce coronal brain sections.
Immunohistochemistry
Tissue sections or cell cultures were blocked with 20% goat serum and 20% horse serum, permeabilized with 0.5% Triton X-100, and stained with primary and secondary antibodies (see antibodies table for details). Sample were mounted with freshly made imaging buffer for dSTORM (describe in the dSTORM imaging section) and visualized by dSTORM and epifluorescence, or mounted in Fluoromount G (EMS) and visualized by confocal microscopy. Both a polyclonal and a monoclonal anti-claudin-5 antibody were found to be highly specific in dSTORM, validated with claudin-5 null mice staining, as in confocal imaging ( Figure 7a and b ). Epitope Class Host Catalogue number Company Dilution * Claudin 5 Monoclonal Mouse 35–2500 Life Technologies 1:100 ** Claudin 5 Polyclonal Rabbit 34–1600 Zymed 1:50 ZO1/TJP1 Polyclonal Rabbit 61–7300 Thermo Fisher Scientific 1:200 Occludin Monoclonal Mouse 33–1500 Thermo Fisher Scientific 1:50 ERG Monoclonal Rabbit monoclonal ab92513/ EPR3864 Abcam 1:200 Lamp1 Monoclonal Rat ID4B DSHB/ AB_528127 1:200 BiP Monoclonal Rabbit C50B12#3,177 Cell Signaling Technology 1:100 GAPDH Monoclonal Rabbit ab181602 Abcam 1:400 Fluorophore Isotype Catalogue number Company Dilution Alexa fluor647 Anti-rabbit IgG 711-605-152 Jackson 1:1,000 Alexa fluor647 Anti-mouse IgG 711-605-151 Jackson 1:1,000 Alexa fluor568 Anti-rabbit IgG A11011 Life Technologies 1:1,000 Alexa fluor568 Anti-mouse IgG A1103-1 Life Technologies 1:1,000 Alexa fluor488 Anti-mouse IgG 715-545-151 Jackson 1:1,000 Streptavidin Alexa fluor647 Biotin S32357 Molecular Probes 1:800 Alexa fluor647 Anti-rat IgG 712-605-153 Jackson 1:1,000 Embryonic BBB permeability assay We used the method we developed and fully described in our previous publication ( Ben-Zvi et al., 2014 ). In brief, dams were deeply anesthetized with ketamine-xylazine i.p. (8.5 mg/ml ketamine, 1.5 mg/ml xylazine, in 100 µl saline). Embryos were injected with 5 µl of Dextran, Alexa Fluor647 anionic fixable ( D22914 , Molecular Probes, 2 mg/ml) or 5 µl of EZ-Link Sulfo-NHS-Biotin (21217, Thermo Fisher Scientific, 1 µg/20 µl), while still attached via the umbilical cord to the mother’s blood circulation. Taking advantage of the sinusoidal, fenestrated and highly permeable liver vasculature, dye was injected using a Hamilton syringe into the embryonic liver and was taken up into the circulation in a matter of seconds. After 5 min of circulation, embryonic heads were fixed by 4 hr immersion in 4% PFA at 4 °C, cryopreserved in 30% sucrose and frozen in TissueTek OCT (Sakura).
Postnatal BBB permeability assay
P9 pups were deeply anaesthetized and 10 µl of Dextran, Alexa Fluor647 anionic fixable ( D22914 , Molecular Probes, 2 mg/ml) or EZ-Link Sulfo-NHS-Biotin (21217, Thermo Fisher Scientific, 1 µg/20 µl), were injected into the left ventricle with a Hamilton syringe. After 5 min of circulation, brains were dissected and fixed by immersion in 4% PFA at 4 °C overnight, cryopreserved in 30% sucrose and frozen in TissueTek OCT (Sakura). In vivo permeability quantifications Relative leakage index was calculated as tracer signal density (signals/area) in a arbitrary fixed area and distance from the abluminal side of the claudin-5 signal (in ranges of 100–300 nm). For each tracer and each age, average abluminal signal density of 10 capillaries (from three pups/embryos) was normalized to the average signal density at P9 (set as leakage index = 1).
Cell culture
The mouse brain endothelioma cell line (bEnd.3) was purchased from American Type Culture Collection (CRL-2299 Manassas, VA, USA) at two occasions, on 2016 and 2019 and was used at 1–2 passages from the original purchased-passage within a year from the purchase. Cells were tested negative for mycoplasma contamination routinely. bEnd.3 cells were cultured with Dulbecco’s Modified Eagle’s medium high glucose (DMEM), supplemented with 10% fetal bovine serum and 1% penicillin-streptomycin solution (Biological Industries, Beit HaEmek, Israel). Cells were incubated at 37 °C in a humid atmosphere in the presence of 5% CO 2 . Cells at passages 26–27 were suspended (0.25% Trypsin EDTA B, Biological Industries) and seeded on 24 mm precision coverslips (no. H, Marienfeld-superior, Lauda-Königshofen, Germany). Cells were washed with PBS and fixed with 4% PFA (at indicated time point; up to 7 days or more than 11 days post-confluence). iPSC differentiation to brain microvascular endothelial-like cells (iBMECs) iPSCs from a healthy individual (BGUi012-A) ( Falik et al., 2020 ) were cultured between passages 10–17, seeded on Matrigel (Corning) with daily replacement of NutriStem medium (Biological Industries) as previously described ( Falik et al., 2020 , PMID: 32905996). iPSCs were passaged every 6–7 days with Versene (Life Technologies) at a 1:12 ratio. Differentiation into iBMECs was carried out as previously described ( Jagadeesan et al., 2020 ; Vatine et al., 2017 ; Vatine et al., 2019 ); cells were passaged and cultured for 2–3 days until reaching a density of 2–3 × 10 5 cells/well. Next, medium was replaced with unconditioned medium without bFGF (UM/F: 200 mL of DMEM/F12 [1:1; Gibco], 50 mL knock-out serum replacement [Gibco], 2.5 mL non-essential amino acids [Gibco], 1.25 mL of gluta-max [Gibco], 3.8 uL of β-mercapto-ethanol [Sigma], and 2.5 mL PSA [BI]) and changed daily for 6 days. Medium was then replaced with human endothelial serum-free medium (hESFM, Life Technologies) supplemented with 20 ng/mL bFGF and 10 mM All-trans retinoic acid (RA) (Sigma) (Biomedical Technologies, Inc) for 2 days. Cells were then gently dissociated into single cells with Accutase (StemPro) and plated in hESFM medium at a density of 1 × 10 6 cells on transwells (0.4 µm pore size; Corning), coverslips or petri dishes that were pre-coated with a mixture of collagen IV (400 ug/mL; Sigma) and fibronectin (100 ug/mL; Sigma).
TEER measurements
Trans-endothelial electrical resistance (TEER) was measured every 24 hr following iBMEC seeding. Resistance was recorded using an EVOM ohmmeter with STX2 electrodes (World Precision Instruments). TEER values were presented as Ωxcm2 following the subtraction of an empty transwell and multiplication by 1.12 cm 2 to account for the surface area. TEER measurements were measured three independent times for each sample and at least twice for each experimental condition.
Paracellular permeability measurements
Sodium fluorescein (10 mM) was added to the upper chamber of the Transwells. Aliquots (100 µl) were collected from the bottom chamber every 15 min and replaced with fresh medium. Fluorescence (485 nm excitation and 530 nm emission) was quantified at the end of the experiment with a plate reader. Rate of tracer accumulation was used to calculate Pe values was as previously described ( Vatine et al., 2017 ). Monolayer fidelity was confirmed at the beginning and at the end of each experiment by TEER measurements. iBMECs STORM imaging iBMECs were seeded on 24 mm precision coverslips (no. H, Marienfeld-Superior, Lauda-Königshofen, Germany), pre-coated with a mixture of collagen IV (400 µg/mL; Sigma) and fibronectin (100 µg/mL; Sigma). Cultures were fixed in 4% paraformaldehyde for 20 min at room temperature (RT), washed three times with PBS and kept in 4 °C until processing.
Western blot analysis
Whole cell extracts were isolated using RIPA buffer (50 mM Tris pH 7.4, 150 mM NaCl, 5 mM EDTA pH 8.0, and 1% Nonidet-P40) supplemented with protease inhibitors (Roche). The concentration of the isolated proteins was determined using Bradford reagent (Sigma). A total of 30–50 micrograms of the protein were separated on a 15% polyacrylamide gel and electrophoretically transferred to PVDF membranes (Millipore). Membranes incubated with the primary antibodies against claudin-5 (1:1000, Zymed 1600–34) or GAPDH (1:400, ab181602, ABCAM) and the appropriate secondary antibodies. dSTORM imaging We used a dSTORM system, which allows imaging at approximately 20 nm resolution by using photo-switchable fluorophores (all dSTORM imaging was done on TIRF mode). Five μm brain slices were mounted on poly-D-lysine coated coverslips (no. H, Marienfeld-superior, Lauda-Königshofen, Germany). dSTORM imaging was performed in a freshly prepared imaging buffer containing 50 mM Tris (pH 8.0), 10 mM NaCl and 10% (w/v) glucose with an oxygen-scavenging GLOX solution (0.5 mg/ml glucose oxidase (Sigma-Aldrich)), 40 μg/ml catalase (Sigma-Aldrich), 10 mM cysteamine MEA (Sigma-Aldrich), and 1% β mercaptoethanol ( Barna et al., 2016 ; Dempsey et al., 2011 ; Zhang et al., 2016 ). A Nikon Ti-E inverted microscope was used. The N-STORM Nikon system was built on TIRF illumination using a 1.49 NA X100 oil immersion objective and an ANDOR DU-897 camera. 488, 568 and 647 nm laser lines were used for activation with cycle repeat of ~8000 cycles for each channel. Nikon NIS Element software was used for acquisition and analysis; analysis was also performed by ThunderSTORM (NIH ImageJ [ Ovesný et al., 2014 ]). Images in 2D were Gaussian fit of each localization; in the N-STORM software. dSTORM quantifications The dSTORM approach we used is based on labeling the target protein with a primary antibody and then using a secondary antibody conjugated to a fluorophore. Thus, resolved signals represent a location that is approximately 40 nm from the actual epitope (assuming the approximation of the two antibodies’ length in a linear conformation). The number of signals represents an amplification of the actual target numbers. Amplification corresponds to the primary antibody in the case of a polyclonal antibody (assuming binding to several epitopes in the same protein, which could be reduced by the use of monoclonal antibodies). Amplification also corresponds to several secondary antibodies binding to a single primary antibody and to several fluorophores attached to a single secondary antibody. Nevertheless, resolution of approximately 20 nm allows us to separate signals and to use these as proxies to the abundance of target molecules, which can reliably be used to compare different states. Cellular expression level quantifications We defined the capillary cross-section as an endothelial unit and quantified claudin-5 signals within capillary cross-sections as proxy to total cellular claudin-5 expression levels. Cluster area, signal numbers, and signal densities Single molecule localization microscopy (SMLM) results in point patterns having specific coordinates of individual detected molecules. These coordinates are typically summarized in a 'molecular list' (provided by ThunderSTORM analysis (NIH ImageJ) [ Ovesný et al., 2014 ]). In order to define molecular clusters, we analyzed the molecular lists through a custom Matlab code (MathWorks) using the Matlab functions ‘Cluster’ and ‘Linkage’, as follows: First, our code calculated distances between each point and all other points in the point pattern of the SMLM image. Then, we set a distance threshold for defining molecules that belong to the same cluster: two points were defined to be clustered if their distance was smaller than the threshold distance (e.g. 70 nm). All points that were clustered with a specific point belong to one cluster (as defined by linkage function). Hence, a point could only be within one cluster. The code then defined and saved the properties of each cluster, such as the area of the cluster, the number of points within the cluster, and the number of clusters. Cluster densities were calculated as number of points divided by each cluster area. Finally, the point patterns were visualized, while showing all points that belong to the same cluster with the same identifying color ( Figures 1c and 2d , Figure 1—figure supplement 1 , Figure 5—figure supplement 1 ). The 70 nm threshold distance used for quantifications was determined based on the following parameters: minimal distance could not be below 40 nm (see above antibody labeling strategy); BBB TJs covering continuous contact points, as we evaluated in published TEM imaging data, range approximately up to 100 nm; simulation of claudin-5 density in clusters, measured in different threshold distances between 50 and 100 nm did not yield significant differences ( Figure 1—figure supplement 1 ). Code availability - All custom codes used in this work are freely available at https://github.com/ShermanLab/Cluster-analysis ( Shermanlab, 2021 ). These codes use MATLAB 2018b(MathWorks).
Confocal imaging
Images were captured using Nikon Eclipse Ni confocal microscope, objective X20 with Nikon C2 camera and Nis-Elements software. Images are maximal z-projection of optical sections taken from a 12 µm tissue section imaged with 0.85 µm intervals.
Epi-fluorescence microscopy
Images presented in Figures 1a and 4a , were taken using an Olympus BX51, 10 X/0.3 and 20 X/0.5, with Andor Zyla camera, and Nikon NIS elements software (version D4.5) for both image acquisition and analysis.
Statistical analysis
All comparisons were performed by two-tailed Mann–Whitney U-tests, or by two tailed pair t- test (as indicated in the figure legends), p < 0.05 was considered significant (GraphPad Prism 8.0.1 [244] for Windows, GraphPad Software, San diego, California, USA). For multiple comparisons of leakage index ( Figure 8 ), the Kruskal-Wallis test and Dunn’s tests for multiple comparisons were used. For the comparison between post confluence and super confluence, we used cluster densities across experiments, for the comparison between ZO1 paired and unpaired claudin-5 clusters we used cluster densities across experiments, for comparisons related to capillaries diameter and total claudin-5 levels we used capillaries across experiments and for comparisons of total occludin levels in wild-type and caludin-5 null embryos we used capillaries across experiments (for exact repetitions see figure legends). Sample size for all immunofluorescence experiments was determined empirically using standards generally employed by the field: a minimum of three animals per group in each experiment, a minimum of four tissue sections of each tissue and a minimum of 10 capillaries per group. In the data set of claudin-5 null and control littermates, the person collecting the data and analyzing was blind to the animal’s genotype.
Additional files Transparent reporting form
📊 Figures
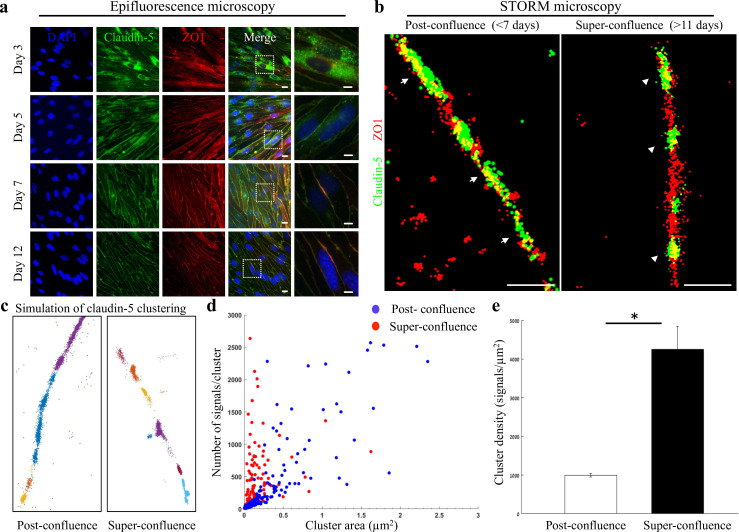
Figure 1.
Super-resolution microscopy of endothelial tight junctions.
In vitro process of TJ maturation is accompanied by TJ architectural changes characterized by the formation of smaller, denser and more discrete clusters of TJ proteins. ( a ) Epi-fluorescent imaging ...
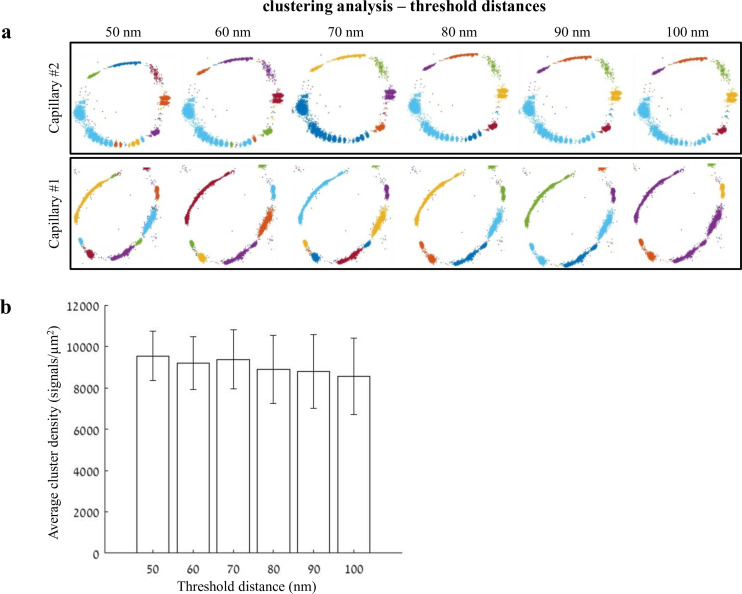
Figure 1u2014figure supplement 1.
Distance threshold used for quantifications of clustering properties.
Analysis of claudin-5 clustering properties was done using a custom clustering Matlab code (see Materials and methods for details); our code calculated distances between each point and all other point...
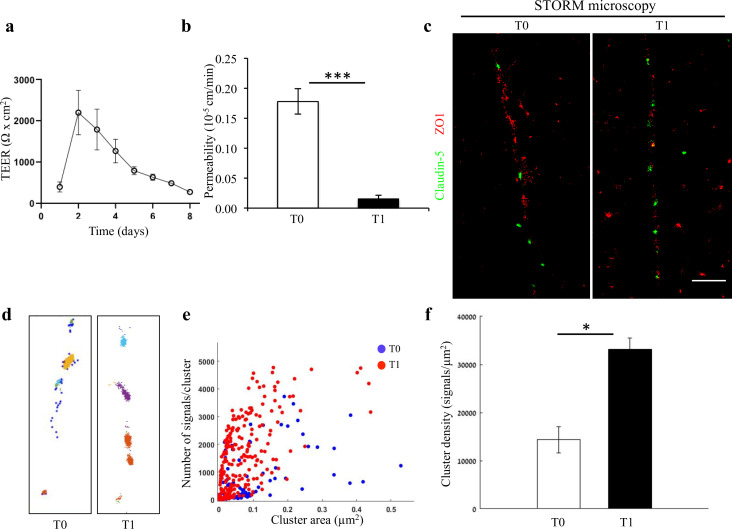
Figure 2.
Changes in nano-scale architecture correlates with tight junction function.
Enhanced TJ function is accompanied by formation of smaller and denser clusters of claudin-5. ( a ) Enhanced TJ function demonstrated by increase in TEER, along the first days of induced human brain m...
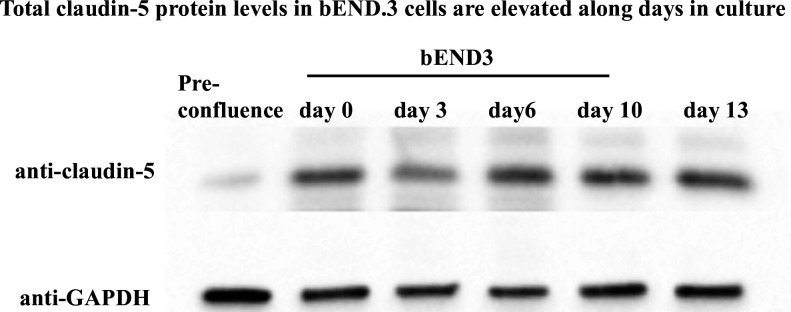
Figure 2u2014figure supplement 1.
Total claudin-5 protein levels in bEND.3 cells are levated along days in culture.
Total claudin-5 protein levels in bEND.3 cells is elevated with time in culture. Total claudin-5 protein levels in bEND.3 cells rise with time in culture as shown in a representative western blot anal...
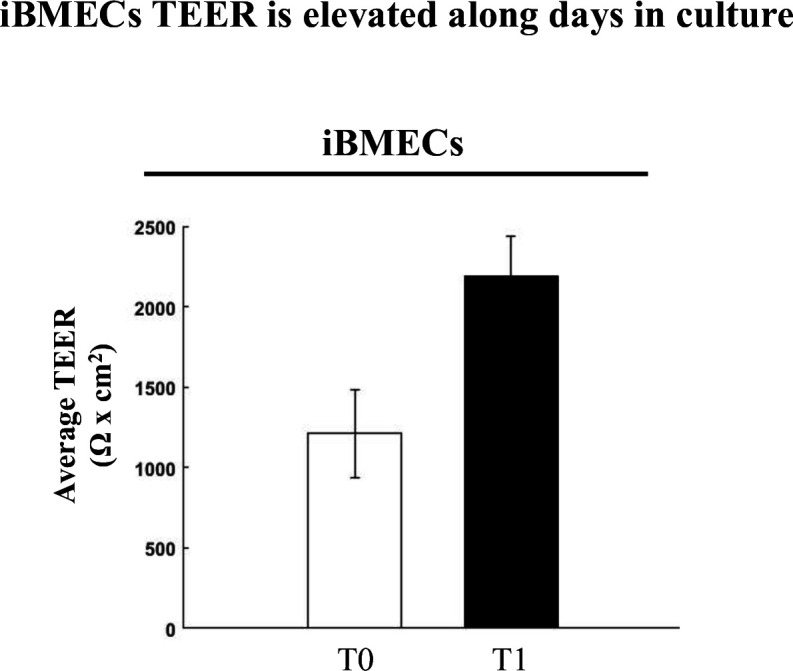
Figure 2u2014figure supplement 2.
iBMECs TEER is elevated with time in culture.
Enhanced TJ function demonstrated by doubling of TEER (average change in TEER across all experiments) along 2u20133 days of human brain microvascular endothelial-like cell (iBMECs) culture (n = 3 expe...
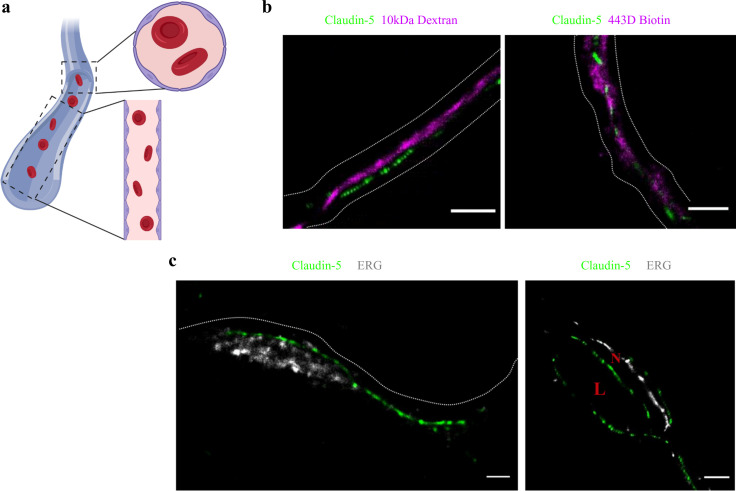
Figure 3.
Claudin-5 signals in dSTORM imaging are exclusively localized to vascular structures.
dSTORM imaging in cortical fixed tissue sections of post-natal day 9 mice. ( a ) Illustration of a vascular structure with cross versus sagittal section directions, and the projected orientation of en...
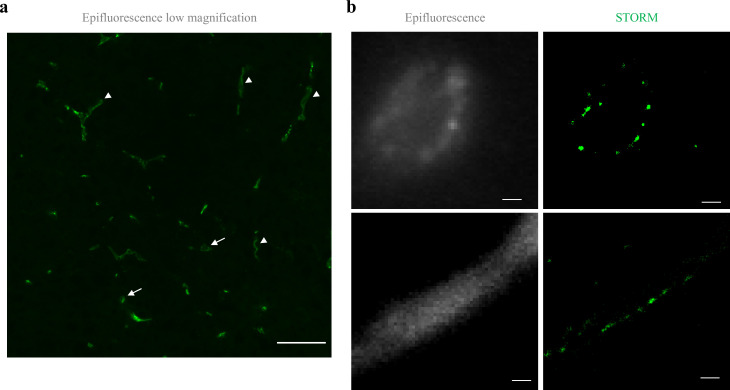
Figure 4.
Claudin-5 exhibits clustered organization in cortical capillaries.
Imaging in cortical fixed tissue sections of post-natal day 9 mice. ( a ) Low-magnification view of claudin-5 staining imaged by epi-fluorescent microscopy showing vascular fragments in cross-sections...
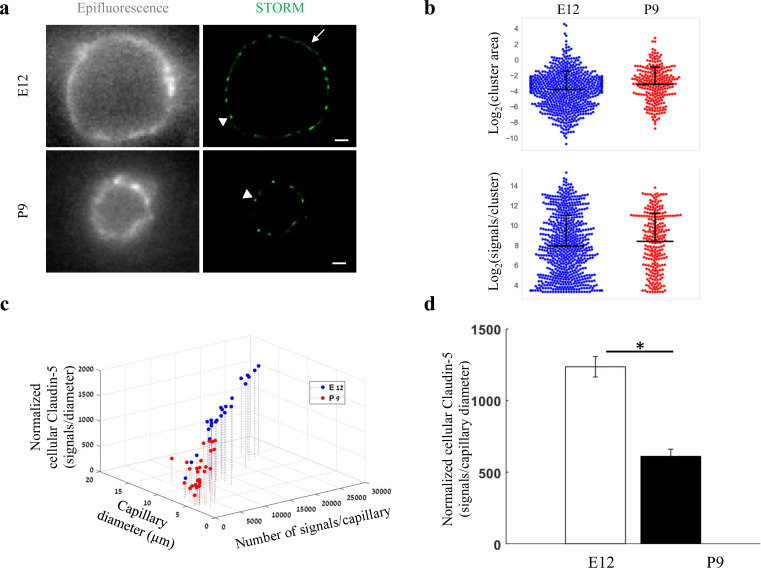
Figure 5.
Total cellular claudin-5 abundance does not correlate with BBB restrictive properties.
Quantifications of claudin-5 levels and clustering properties along developmental BBB maturation ( a ) dSTORM (right) compared to epi-fluorescent images (left) of claudin-5 immunostaining in E12 and P...
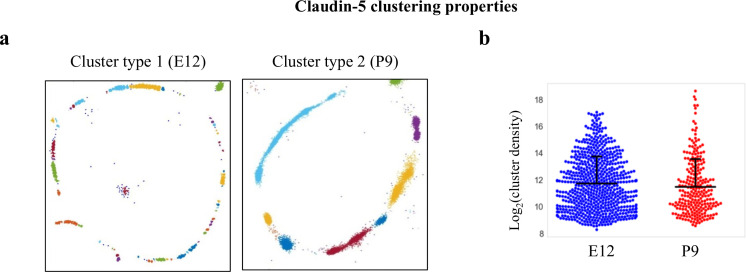
Figure 5u2014figure supplement 1.
Claudin-5 clustering properties.
Analysis of Claudin-5 clustering properties along the developmental BBB maturation axis, using custom clustering Matlab code (see methods for details). ( a ) dSTORM imaging simulation of claudin-5 imm...
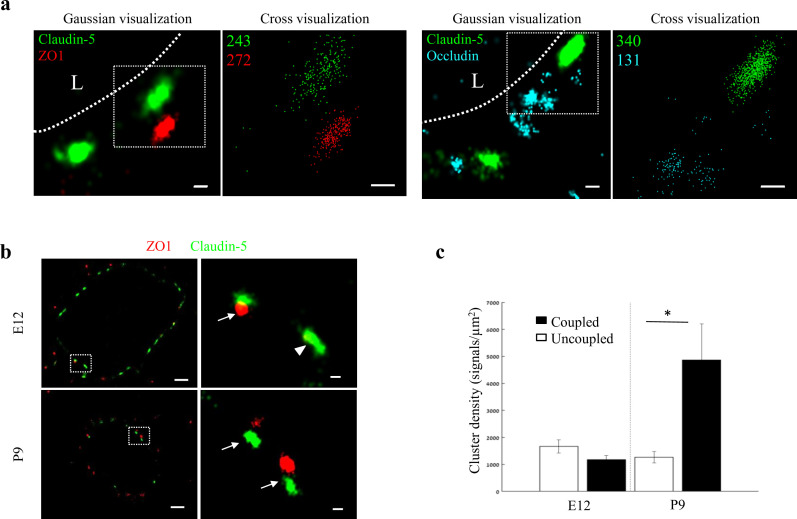
Figure 6.
Molecular organization of mouse cortical BBB TJs.
Nano-scale molecular organization of TJ proteins in cortical capillaries of postnatal wild-type mice (P9). ( a ) Claudin-5 and ZO1 display clustered organization (left) whereas occludin was much less ...
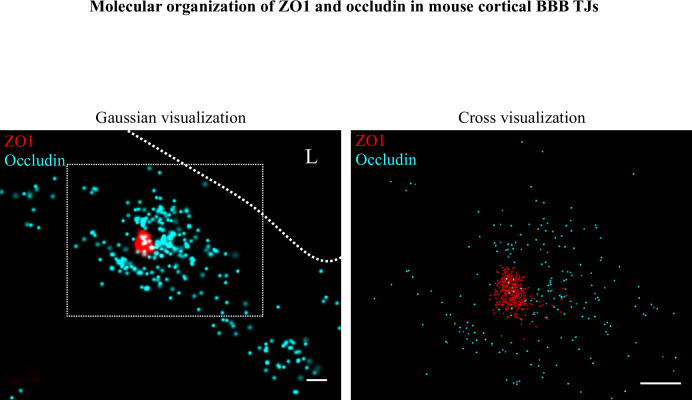
Figure 6u2014figure supplement 1.
Molecular organization of ZO1 and occludin in mouse cortical BBB TJs.
Nano-scale molecular organization of TJ proteins in cortical capillaries of wild-type mice ( E16 ). ZO1 display clustered organization (red) whereas occludin (cyan) was much less organized in discrete...
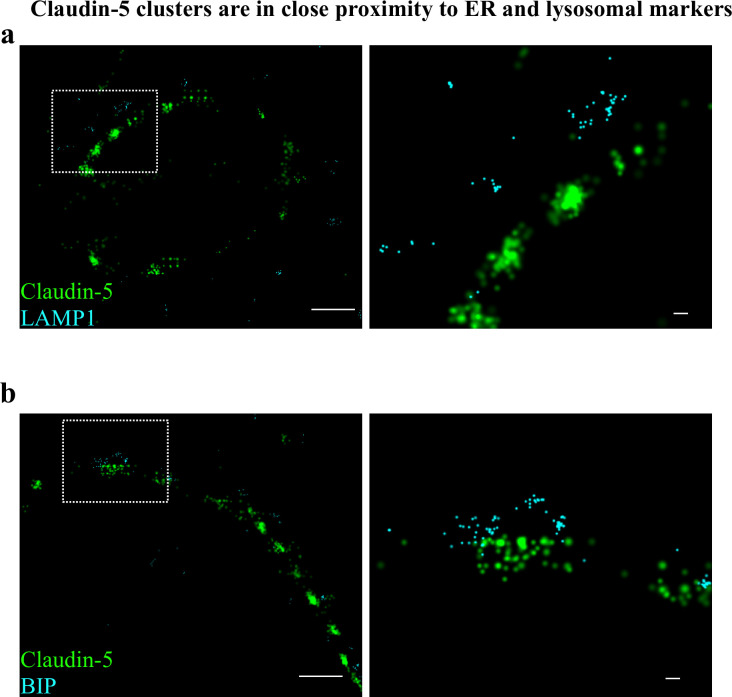
Figure 6u2014figure supplement 2.
Claudin-5 clusters are in close proximity to ER and lysosomal markers.
Capillary cross-sections presented multiple claudin-5 clusters, therefore we tested potential claudin-5 localization to different cellular compartments. ( a ) Claudin-5 clusters in close proximity wit...
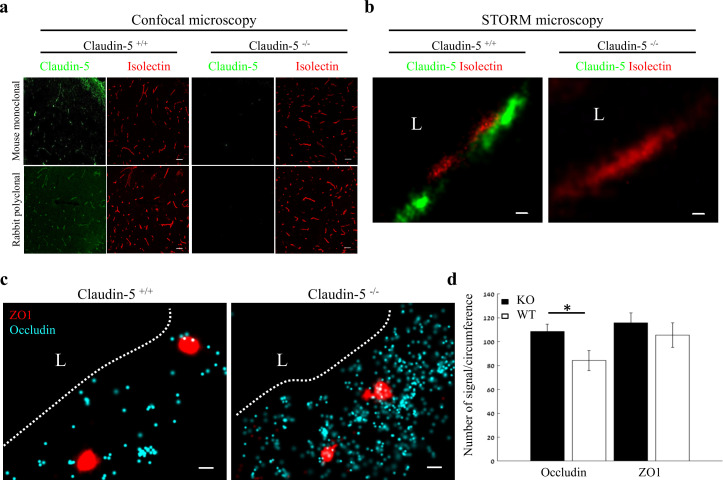
Figure 7.
Nano-scale organization of both ZO1 and occludin are independent of claudin-5 expression.
( a-b ) Claudin-5 antibodies specificity was confirmed by both confocal microscopy ( a ) Scale bars, 50 u00b5m and dSTORM microscopy ( b ) Scale bars, 0.1 u00b5m, with no detectable staining in E16 co...
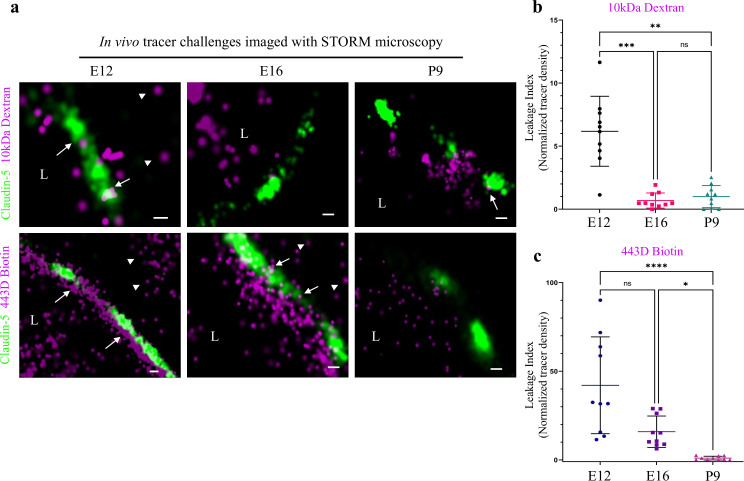
Figure 8.
Investigating BBB TJ function using super-resolution microscopy.
Tracer challenges testing cortical capillaries permeability with dSTORM imaging, provides evidence of leakage across immature TJs. ( a ) E12 TJ function tested with an in utero embryonic liver tracer ...
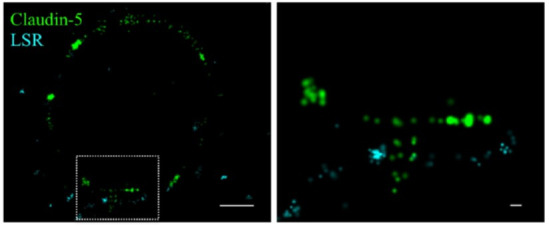
Author response image 1.
Claudin-5 signals in close proximity to the tricellular marker LSR.
Cortical capillary cross-sections of P9 mice presented multiple claudin-5 clusters, of which the minority was in close proximity with the tricellular marker LSR. The majority of LSR signals were diffu...
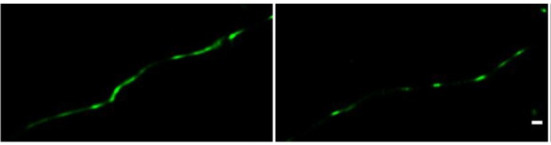
Author response image 2.
Direct STORM imaging of EYFP-fused claudin-5, overexpressed in bEND.
3 cells. bEND.3 cells were infected with a lenti-viral vector to stably express ctermini EYFP-tagged human claudin-5. Super-confluent monolayers were imaged with STORM to localize the EYFP signals. Ab...
Figure images are served from the NIH/NLM PubMed Central Open Access Subset or Europe PMC; copyright remains with the publishers and authors.
💬 Discussion
0 commentsNo comments yet. Be the first to start a discussion!
Leave a Comment