Abstract
AbstractThe precise mechanisms that lead to cognitive decline in Alzheimer’s disease are unknown. Here we identify amyloid-plaque-associated axonal spheroids as prominent contributors to neural network dysfunction. Using intravital calcium and voltage imaging, we show that a mouse model of Alzheimer’s disease demonstrates severe disruption in long-range axonal connectivity. This disruption is caused by action-potential conduction blockades due to enlarging spheroids acting as electric current sinks in a size-dependent manner. Spheroid growth was associated with an age-dependent accumulation of large endolysosomal vesicles and was mechanistically linked with Pld3—a potential Alzheimer’s-disease-associated risk gene1 that encodes a lysosomal protein2,3 that is highly enriched in axonal spheroids. Neuronal overexpression of Pld3 led to endolysosomal vesicle accumulation and spheroid enlargement, which worsened axonal conduction blockades. By contrast, Pld3 deletion reduced endolysosomal vesicle and spheroid size, leading to improved electrical conduction and neural network function. Thus, targeted modulation of endolysosomal biogenesis in neurons could potentially reverse axonal spheroid-induced neural circuit abnormalities in Alzheimer’s disease, independent of amyloid removal.
🔬 Techniques
🔭 Microscopes
💻 Software
✨ Fluorophores
🧪 Sample Preparation
🔬 Cell Lines
🏭 Microscope Brands
🧪 Reagent Suppliers
🔴 Lasers
📷 Detectors
💻 Software Details
💾 Data Repositories
🏛️ Research Organizations (ROR)
Affiliated research institutions:
📋 Methods
Mice 5xFAD (34840-JAX, The Jackson Laboratory) mice were used in this study. Rosa26-LSL-Cas9 (026175, The Jackson Laboratory) mice were crossed with 5xFAD mice for CRSIPR–Cas9-mediated gene deletion. The genotyping of 5xFAD mice was performed according to the instructions provided by The Jackson Laboratory. All of the animal procedures were approved by the Institutional Animal Care and Use Committee at Yale University.
Antibodies and reagents
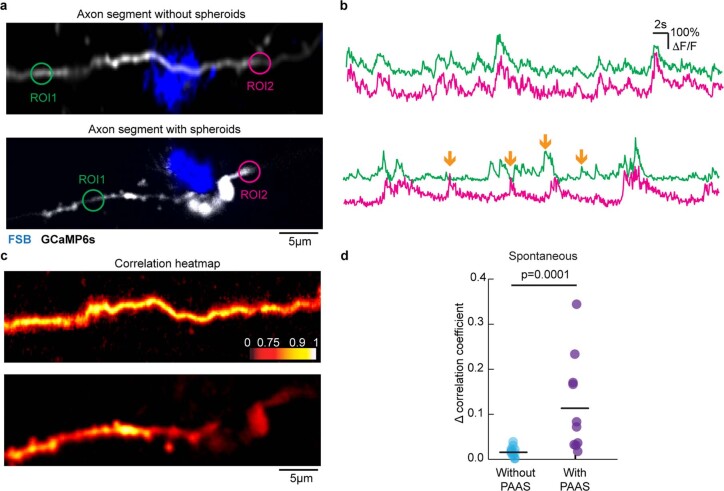
The following primary antibodies were used in this study: anti-LAMP1 (DSHB, 1D4B, 1:200), anti-GFP (Aves Labs, GFP-1020, 1:500), anti-cathepsin D (Abcam, EPR3057Y, ab75852, 1:250), anti-ATP6V0A1 (Thermo Fisher Scientific, PA5-54570, 1:200), anti-APP (Thermo Fisher Scientific, LN27, 13-0200, 1:100), anti-PLD3 (Sigma-Aldrich, HPA012800, 1:200), anti-Aβ(1–42) (Abcam, ab10148, 1:200), anti-Aβ(1–42) (Abcam, mOC98, ab201061, 1:200), anti-MAP2 (Abcam, ab5392, 1:200), anti-IBA1 (Novus Biologicals, NB100–1028, 1:200), anti-S100B (R&D Systems, AF1820, 1:100), anti-ALDH1L1 (NeuroMab, P28037 , 1:250) and FM 1–43 (Life Technologies, F35355 ). All secondary antibodies used were conjugated with Alexa dyes from Thermo Fisher Scientific (1:500). Thioflavin S (Sigma Aldrich, T1892) was used to stain amyloid plaques in fixed tissue. FSB (Santa Cruz, CAS 760988-03-2) was used to label plaques in live mice. To study spheroid endocytosis of extracellular Aβ, fluorescently labelled Aβ(1–42) (AnaSpec) was used. Pitstop2 (Abcam, ab120687) was used to inhibit endocytosis. AAV production and delivery The GCaMP6f and GCaMP6s viruses were purchased (UPenn Virus Core, AV-9-PV2822 and AV-9-PV2824; Addgene, 100837 and 100843). The ASAP3 construct was purchased from Addgene (Addgene, 132331). Customized AAV vectors for overexpression were constructed based on plasmid 28014 from Addgene, in which the GFP sequence was deleted and replaced by the customized sequences described below. In many cases in which the virus transduced both a target protein and a fluorescent protein reporter, a GFP without the stop codon and P2A sequence was placed in front of the target protein sequence in the same open reading frame, as described previously 51 . The target proteins used in this study were as follows: tdTomato : sequence is available online ( http://www.tsienlab.ucsd.edu/Samples/PDF/tdTomato-map%20&%20sequence.pdf ), synthesized by Integrated DNA Technologies; mCherry-SEpHluorin : the sequence was cut from Addgene 32001; Lamp1-GFP : the Lamp1 sequence was amplified from mouse brain mRNA, using the 5′ primer TGCGTCGCGCCATGGCGGCC and 3′ primer GATGGTCTGATAGCCGGCGT; GFP-P2A-Pld3 : the Pld3 sequence was amplified from mouse Pld3 cDNA (GE open biosystem), using the 5′ primer ATGAAGCCCAAACTGATGTACCAGG and the 3′ primer TCAAAGCAGGCGGCAGGC. The sgRNA constructs for Pld3 deletion were cloned using plasmid 60229 from Addgene. The sequences of the sgRNAs were: Pld3 sgRNA 1: GTCCTGATCCTGGCGGTAGT; Pld3 sgRNA 2: GCTAGTGGAGGGGTTGCTCG and control scrambled sgRNA: GGAAGAGCGAGCTCTTCT. All of the constructs were verified by DNA sequencing, and the expression or deletion of the target proteins was tested using immunohistochemistry. AAV2 viruses were produced in HEK293T cells (American Type Culture Collection (ATCC)) and purified according to previously described procedures 52 using a two-plasmid helper-free system (PlasmidFactory). The virus titre was determined by counting the infection in HEK293 cells. AAV vectors were injected into the subarachnoid space in one hemisphere as previously described 51 . The total viral particles injected per mouse was approximately 10 7 . Cranial window implant Eight-month-old 5xFAD mice were anaesthetized with ketamine/xylazine solution (100 mg per kg and 10 mg per kg, respectively) and hair was removed from the skull area. Buprenex (0.1 mg per kg), dexamethasone (2 mg per kg) and carprofen (5 mg per kg) were given subcutaneously at this point. The mouse was placed on a heating pad during the surgery and anaesthesia was checked periodically. Povidone-iodine solution was applied to the skin and cleaned with ethanol, and eye ointment was applied to the eyes. A small piece of skin was removed to expose the skull, and the membranous layer on the skull surface was removed by forceps. A 4 mm diameter circle was drilled on the contralateral hemisphere of virus infusion (approximate location of the centre is −2.5 mm from bregma and 2.5 mm from the midline). The skull was rinsed with sterile PBS periodically to avoid excessive heating. The skull was thinned in a circumferential area and then lifted with fine forceps without causing injury to the underlying pila surface. Gelfoam sponge (Pfizer) was used to absorb blood after lifting the skull. Using a pair of very fine forceps, the dura was removed within the circle area and a 4 mm cover glass was gently pressed onto the brain surface and glued to the skull. A customized head bar was glued (for acute imaging) or chronically implanted (with dental cement, for chronic imaging) onto the skull. For chronic imaging, mice were placed onto a heating pad to recover after the surgery and given buprenex (0.1 mg per kg) and carprofen (5 mg per kg) for 3 days. Imaging procedures started 1 month after the surgery. In vivo two-photon imaging In vivo imaging was performed using a two-photon microscope equipped with a Ti-sapphire tuneable laser (Spectra Physics), a gallium arsenide phosphide (GaAsP) detector (Prairie technology) and a ×20/1.0 NA water-immersion objective (Leica), or the Ultima Investigator multiphoton microscope (Bruker) with the Insight X3 tuneable ultrafast laser (Spectra Physics) and a ×20/1.0 NA water-immersion objective (Olympus), using the associated Prairie View software. GFP was excited at 920 nm; dTomato and tdTomato were excited at 920 nm/1,045 nm; and FSB was excited at 850 nm. For chronic imaging, a location close to the centre of the cranial window was selected as the starting point and the blood vessel pattern was recorded. The coordinates of each ROI were recorded as well. To relocate in the next imaging session, the starting point was relocated on the basis of the recorded coordinates and the field of view was adjusted to match the recorded blood vessel pattern. Aβ(1–42) preparation and injection Fluorescently tagged Aβ(1–42) peptide (AnaSpec, 60480-1) was reconstituted in DMSO to a final concentration of 1 mg ml −1 . The solution was 1:10 (v/v) diluted in fresh artificial cerebrospinal fluid before being injected into the subarachnoid space as previously described 53 . We injected 10 µl of Aβ(1–42) solution into each mouse and collected the brain the next day. Brain tissue was prepared for immunohistochemistry analysis. Calcium imaging of cortical axons and related analysis Six-to-eight-month-old 5xFAD mice were injected with GCaMP6 virus through the subarachnoid space on one hemisphere to label cortical neurons and measure local axonal conduction properties. For measurements of interhemispheric axonal conduction, GCaMP6f virus was injected stereotaxically with the following coordinates: bregma (AP, −0.34; ML, 1.65; DV, 0.45; angle, 0°) 54 (Allen Mouse Brain Connectivity Atlas (2011)). After more than 2 weeks of the injection, an acute cranial imaging window was implanted onto the contralateral hemisphere as described above. For stimulated calcium imaging, an additional opening on the skull was made on the ipsilateral side of the virus infusion. A glass electrode was inserted through this opening using a motorized micromanipulator and used for electrical stimulation. The ROI was identified under a two-photon microscope. GCaMP6-labelled neurons were imaged through excitation at a wavelength of 920 nm. A limited field of view was used to improve the sampling rate. GCaMP6s was imaged at 2 Hz and GCaMP6f was imaged at 10 to 20 Hz. Only axons that displayed spontaneous calcium transients at least once per minute were used for analysis. For stimulated calcium events, mice were anaesthetized using 0.5% isoflurane. Stimulation trains of 2 ms pulses were delivered to the glass electrode at 50 Hz (18 ms interval) with 10 to 60 μA currents for 500 ms. The calcium responses within the imaging window were monitored after stimulation. The stimulating electrode was adjusted to different depths within the cortex to trigger responses in contralateral hemisphere axons. Three consecutive trials were acquired for each axon and the responses were averaged. The raw GCaMP6 fluorescence intensity was normalized to Δ F / F for analysis. Images were then spatially smoothed with a 3 × 3 window. Several ROIs were selected on each axon. The average Δ F before stimulation was used as the baseline measurement. To estimate the calcium rise time (a surrogate for AP spike time 55 ), the calcium trace from the event-specific peak to the first data point exceeding the baseline was used as the rising phase of the event. This rising phase trace was fitted to an exponential equation: Y = 1 − exp( −k × ( x − t )). The spike timing estimation ( t 0 ) was then calculated by extrapolating the x -intercept. For analysis of the spontaneous Ca 2+ transients, we calculated the correlation coefficients between two ROIs chosen on each axonal side of a particular spheroid using the Pearson correlation coefficient.
Show full methods section
Mice 5xFAD (34840-JAX, The Jackson Laboratory) mice were used in this study. Rosa26-LSL-Cas9 (026175, The Jackson Laboratory) mice were crossed with 5xFAD mice for CRSIPR–Cas9-mediated gene deletion. The genotyping of 5xFAD mice was performed according to the instructions provided by The Jackson Laboratory. All of the animal procedures were approved by the Institutional Animal Care and Use Committee at Yale University.
Antibodies and reagents
The following primary antibodies were used in this study: anti-LAMP1 (DSHB, 1D4B, 1:200), anti-GFP (Aves Labs, GFP-1020, 1:500), anti-cathepsin D (Abcam, EPR3057Y, ab75852, 1:250), anti-ATP6V0A1 (Thermo Fisher Scientific, PA5-54570, 1:200), anti-APP (Thermo Fisher Scientific, LN27, 13-0200, 1:100), anti-PLD3 (Sigma-Aldrich, HPA012800, 1:200), anti-Aβ(1–42) (Abcam, ab10148, 1:200), anti-Aβ(1–42) (Abcam, mOC98, ab201061, 1:200), anti-MAP2 (Abcam, ab5392, 1:200), anti-IBA1 (Novus Biologicals, NB100–1028, 1:200), anti-S100B (R&D Systems, AF1820, 1:100), anti-ALDH1L1 (NeuroMab, P28037 , 1:250) and FM 1–43 (Life Technologies, F35355 ). All secondary antibodies used were conjugated with Alexa dyes from Thermo Fisher Scientific (1:500). Thioflavin S (Sigma Aldrich, T1892) was used to stain amyloid plaques in fixed tissue. FSB (Santa Cruz, CAS 760988-03-2) was used to label plaques in live mice. To study spheroid endocytosis of extracellular Aβ, fluorescently labelled Aβ(1–42) (AnaSpec) was used. Pitstop2 (Abcam, ab120687) was used to inhibit endocytosis. AAV production and delivery The GCaMP6f and GCaMP6s viruses were purchased (UPenn Virus Core, AV-9-PV2822 and AV-9-PV2824; Addgene, 100837 and 100843). The ASAP3 construct was purchased from Addgene (Addgene, 132331). Customized AAV vectors for overexpression were constructed based on plasmid 28014 from Addgene, in which the GFP sequence was deleted and replaced by the customized sequences described below. In many cases in which the virus transduced both a target protein and a fluorescent protein reporter, a GFP without the stop codon and P2A sequence was placed in front of the target protein sequence in the same open reading frame, as described previously 51 . The target proteins used in this study were as follows: tdTomato : sequence is available online ( http://www.tsienlab.ucsd.edu/Samples/PDF/tdTomato-map%20&%20sequence.pdf ), synthesized by Integrated DNA Technologies; mCherry-SEpHluorin : the sequence was cut from Addgene 32001; Lamp1-GFP : the Lamp1 sequence was amplified from mouse brain mRNA, using the 5′ primer TGCGTCGCGCCATGGCGGCC and 3′ primer GATGGTCTGATAGCCGGCGT; GFP-P2A-Pld3 : the Pld3 sequence was amplified from mouse Pld3 cDNA (GE open biosystem), using the 5′ primer ATGAAGCCCAAACTGATGTACCAGG and the 3′ primer TCAAAGCAGGCGGCAGGC. The sgRNA constructs for Pld3 deletion were cloned using plasmid 60229 from Addgene. The sequences of the sgRNAs were: Pld3 sgRNA 1: GTCCTGATCCTGGCGGTAGT; Pld3 sgRNA 2: GCTAGTGGAGGGGTTGCTCG and control scrambled sgRNA: GGAAGAGCGAGCTCTTCT. All of the constructs were verified by DNA sequencing, and the expression or deletion of the target proteins was tested using immunohistochemistry. AAV2 viruses were produced in HEK293T cells (American Type Culture Collection (ATCC)) and purified according to previously described procedures 52 using a two-plasmid helper-free system (PlasmidFactory). The virus titre was determined by counting the infection in HEK293 cells. AAV vectors were injected into the subarachnoid space in one hemisphere as previously described 51 . The total viral particles injected per mouse was approximately 10 7 . Cranial window implant Eight-month-old 5xFAD mice were anaesthetized with ketamine/xylazine solution (100 mg per kg and 10 mg per kg, respectively) and hair was removed from the skull area. Buprenex (0.1 mg per kg), dexamethasone (2 mg per kg) and carprofen (5 mg per kg) were given subcutaneously at this point. The mouse was placed on a heating pad during the surgery and anaesthesia was checked periodically. Povidone-iodine solution was applied to the skin and cleaned with ethanol, and eye ointment was applied to the eyes. A small piece of skin was removed to expose the skull, and the membranous layer on the skull surface was removed by forceps. A 4 mm diameter circle was drilled on the contralateral hemisphere of virus infusion (approximate location of the centre is −2.5 mm from bregma and 2.5 mm from the midline). The skull was rinsed with sterile PBS periodically to avoid excessive heating. The skull was thinned in a circumferential area and then lifted with fine forceps without causing injury to the underlying pila surface. Gelfoam sponge (Pfizer) was used to absorb blood after lifting the skull. Using a pair of very fine forceps, the dura was removed within the circle area and a 4 mm cover glass was gently pressed onto the brain surface and glued to the skull. A customized head bar was glued (for acute imaging) or chronically implanted (with dental cement, for chronic imaging) onto the skull. For chronic imaging, mice were placed onto a heating pad to recover after the surgery and given buprenex (0.1 mg per kg) and carprofen (5 mg per kg) for 3 days. Imaging procedures started 1 month after the surgery. In vivo two-photon imaging In vivo imaging was performed using a two-photon microscope equipped with a Ti-sapphire tuneable laser (Spectra Physics), a gallium arsenide phosphide (GaAsP) detector (Prairie technology) and a ×20/1.0 NA water-immersion objective (Leica), or the Ultima Investigator multiphoton microscope (Bruker) with the Insight X3 tuneable ultrafast laser (Spectra Physics) and a ×20/1.0 NA water-immersion objective (Olympus), using the associated Prairie View software. GFP was excited at 920 nm; dTomato and tdTomato were excited at 920 nm/1,045 nm; and FSB was excited at 850 nm. For chronic imaging, a location close to the centre of the cranial window was selected as the starting point and the blood vessel pattern was recorded. The coordinates of each ROI were recorded as well. To relocate in the next imaging session, the starting point was relocated on the basis of the recorded coordinates and the field of view was adjusted to match the recorded blood vessel pattern. Aβ(1–42) preparation and injection Fluorescently tagged Aβ(1–42) peptide (AnaSpec, 60480-1) was reconstituted in DMSO to a final concentration of 1 mg ml −1 . The solution was 1:10 (v/v) diluted in fresh artificial cerebrospinal fluid before being injected into the subarachnoid space as previously described 53 . We injected 10 µl of Aβ(1–42) solution into each mouse and collected the brain the next day. Brain tissue was prepared for immunohistochemistry analysis. Calcium imaging of cortical axons and related analysis Six-to-eight-month-old 5xFAD mice were injected with GCaMP6 virus through the subarachnoid space on one hemisphere to label cortical neurons and measure local axonal conduction properties. For measurements of interhemispheric axonal conduction, GCaMP6f virus was injected stereotaxically with the following coordinates: bregma (AP, −0.34; ML, 1.65; DV, 0.45; angle, 0°) 54 (Allen Mouse Brain Connectivity Atlas (2011)). After more than 2 weeks of the injection, an acute cranial imaging window was implanted onto the contralateral hemisphere as described above. For stimulated calcium imaging, an additional opening on the skull was made on the ipsilateral side of the virus infusion. A glass electrode was inserted through this opening using a motorized micromanipulator and used for electrical stimulation. The ROI was identified under a two-photon microscope. GCaMP6-labelled neurons were imaged through excitation at a wavelength of 920 nm. A limited field of view was used to improve the sampling rate. GCaMP6s was imaged at 2 Hz and GCaMP6f was imaged at 10 to 20 Hz. Only axons that displayed spontaneous calcium transients at least once per minute were used for analysis. For stimulated calcium events, mice were anaesthetized using 0.5% isoflurane. Stimulation trains of 2 ms pulses were delivered to the glass electrode at 50 Hz (18 ms interval) with 10 to 60 μA currents for 500 ms. The calcium responses within the imaging window were monitored after stimulation. The stimulating electrode was adjusted to different depths within the cortex to trigger responses in contralateral hemisphere axons. Three consecutive trials were acquired for each axon and the responses were averaged. The raw GCaMP6 fluorescence intensity was normalized to Δ F / F for analysis. Images were then spatially smoothed with a 3 × 3 window. Several ROIs were selected on each axon. The average Δ F before stimulation was used as the baseline measurement. To estimate the calcium rise time (a surrogate for AP spike time 55 ), the calcium trace from the event-specific peak to the first data point exceeding the baseline was used as the rising phase of the event. This rising phase trace was fitted to an exponential equation: Y = 1 − exp( −k × ( x − t )). The spike timing estimation ( t 0 ) was then calculated by extrapolating the x -intercept. For analysis of the spontaneous Ca 2+ transients, we calculated the correlation coefficients between two ROIs chosen on each axonal side of a particular spheroid using the Pearson correlation coefficient.
Calcium imaging of cortical neuronal networks and related analysis
AAV2 viruses encoding either Pld3 sgRNA or control sgRNA were injected stereotaxically into the basal forebrain of 5xFAD mice (aged 6 to 8 months) with the following coordinates: bregma (AP, 0.62; ML, 1.2; DV, 4.85; angle, 0°) 54 (Allen Mouse Brain Connectivity Atlas (2011)). GCaMP6 virus was injected through the subarachnoid space on the ipsilateral hemisphere of basal forebrain to label cortical neurons. The ROI with intermingled projecting axons from the basal forebrain and GCaMP6f-labelled cortical neurons was identified under a two-photon microscope. Calcium imaging was performed in cortical neurons of awake mice in the same region as those projecting forebrain axons. Spontaneous calcium activities of neurons were recorded at 25 Hz for 30 min. To analyse the cortical neuron activities, we applied a rigid motion correction 56 to the raw time-lapse data and segmented the neuronal signal using a previously established algorithm based on robust estimation 57 . Cell locations were defined as the centroid points from the spatial masks of each cell. We further estimated the neuronal spikes on the basis of calcium traces as previously shown 58 . To calculate the pairwise mutual information, we used previously described methodologies 59 . Mutual information from each cell pair in the same imaging session was grouped by the distances between neurons. To calculate neuron clusters with similar activity patterns, we used previously described graph-theory-based community detection algorithms 60 , with forced deterministic behaviour for better reproducibility, and determined the sizes of each cluster of cells identified in a single imaging session. Calculation of population entropy as performed according to a previously reported method 61 . To account for different numbers of cells imaged, we drew a random subsample of 100 neurons from each mouse and calculated the population entropy. This process was repeated 100 times and the average results were recorded.
Voltage imaging and analysis
AAV2-Syn-ASAP3 virus was injected stereotaxically into 5xFAD mice (aged 6 to 8 months) with the following coordinates: bregma (AP, −0.34; ML, 1.65; DV, 0.45; angle, 0°) 54 (Allen Mouse Brain Connectivity Atlas (2011)). After more than 2 weeks of the injection, an acute cranial imaging window was implanted onto the ipsilateral hemisphere as described above. An additional opening on the skull was made on the contralateral side of the virus infusion. A glass electrode was inserted through this opening using a motorized micromanipulator and used for electrical stimulation. The ROI was identified under a two-photon microscope. Line scan imaging of ASAP3-labelled neuronal soma was performed through excitation at a wavelength of 920 nm. The scanning speed was set to 1 kHz. Stimulation trains of 5 ms pulses were delivered at 10 Hz (95 ms intervals) with 10 to 100 μA currents for 1 s. Line scan images were used to extract the voltage response of ASAP3. On each line of the kymograph, the intensity of the pixels covering the ASAP3-labelled neuronal soma was averaged to represent the membrane potential of the neuron at given time, which was used to generate the voltage response trace later. The response trace showed a large dip after each electrical stimulation pulse. The time of the dip indicated the antidromic AP time 62 on the neuronal soma. To quantify the AP conduction failure, we performed FFT of the voltage response curve and took the 10 Hz (the same frequency as the electrical stimulation) component power as an indicator. The amplitude of the electrical current pulse was gradually increased; and the FFT power–current amplitude could be plotted. We fit the plot with a logistic function: Y = a /(1 + exp(− k × ( x − b ))). The current amplitude at the half-height of the logistic curve was defined as the threshold of the electrical stimulation.
Human post-mortem brain tissues
Formalin-fixed human post-mortem brain tissue blocks were acquired from brain banks, with ethics approval from each providing organization. The middle frontal gyrus, a cortical region affected in early stages of Alzheimer’s disease 63 , was used for this study. Detailed information is provided in Extended Data Fig. 4 , including 12 cases of AD, four cases of AD with PLD3 variants and six cases of MCI. Cases were matched for age, sex and APOE genotype for most quantifications except for PLD3(V232M)-variant samples. For immunohistochemistry analysis of human tissue, 30-μm-thick slices were prepared and treated with sodium citrate solution at 95 °C for 45 min, before staining with primary antibodies for 3 days.
Acute organotypic brain-slice culture
Brain-slice cultures were prepared from 5xFAD mice (aged 8 months) according to a previously established protocol 64 . In brief, we dissected the hippocampal region in a sterile hood from anaesthetized mice. We then manually cut coronal sections approximately 300 μm thick and transferred the slices onto a Millicell culture membrane (Thermo Fisher Scientific, PICM03050). The culture membrane was placed in a six-well plate filled with 1 ml of the culture medium, and was placed in an incubator at 37 °C under 5% CO 2 . We examined the slice condition after 7 days with a light microscope. Healthy slices were then used for experiments. To measure endocytosis, we added endocytosis marker FM 1-43 dye (Thermo Fisher Scientific, T35356 ) to the culture medium to a final concentration of 1 µM. We incubated the slices with the dye for 1.5 h and then washed the slices with fresh medium twice before fixing the slice in 4% paraformaldehyde. For experiments blocking endocytosis, we dissolved Dynasore (Tocris Bioscience) or the endocytosis inhibitor PitStop2 (Abcam, ab120687) in dimethyl sulfoxide (DMSO) and added it to the culture medium with different final concentrations of FM 1-43 dye. The control groups used DMSO with no drug following the same dilutions.
Plaque-associated axonal spheroid imaging and quantification
Fixed-tissue imaging was performed using a confocal microscope (Leica SP5 or Lecia SP8), and the images were taken using a ×63/1.4 NA oil-immersion objective (Leica). Individual PAAS sizes were measured on the basis of LAMP1, APP or V0A1 immunohistochemistry. Specifically, we examined the cross-sections of the target PAASs through the high-resolution z -stack and selected the outlines of individual cross-sections using NIH/Fiji software. The largest cross-sectional area was recorded as the PAAS size. For quantification of the proportion of PAASs with ELPVs, we defined PAASs in a binary manner as either having or not having at least one obvious LAMP1-positive enlarged ring, consisting of a clear LAMP1-labelled circular outline and a darker lumen with an area greater than 0.25 µm 2 , as measured using NIH/Fiji. To classify PAASs into neutral versus acidic, using the genetically encoded pH sensor SEpHluorin 65 , we established an arbitrary threshold of green/red fluorescence intensity ratio of 0.75. To classify PAASs into cathepsin D low versus high groups using immunofluorescence, we used an arbitrary threshold of 100 fluorescence intensity as measured using NIH ImageJ/Fiji.
Expansion microscopy
Expansion of brain sections was performed according to conventional immunostaining. Brain sections were treated with glutaraldehyde (TCI Chemicals, G0068) and then processed for gelation, digestion and expansion, as described previously 66 , 67 . In brief, brain sections were first incubated with monomer solution (1× PBS, 2 M NaCl, 8.625% (w/w) sodium acrylate, 2.5% (w/w) acrylamide, 0.15% (w/w) N , N ′-methylenebisacrylamide) at 4 °C for 45 min. The sections were then transferred into a gel chamber and incubated in gelling solution (concentrated stocks (10%, w/w) of ammonium persulfate initiator and tetramethyl-ethylenediamine accelerator added to the monomer solution for up to 0.2% (w/w) each and the inhibitor 4-hydroxy-2,2,6,6-tetramethylpiperidin-1-oxyl added up to 0.01% (w/w) from a 0.5% (w/w) stock) at 37 °C for 1.5–2 h for gelation. The gels were then fully immersed in proteinase solution (proteinase K (New England Biolabs, P8107S) diluted 1:100 to 8 U ml −1 in digestion buffer (50 mM Tris (pH 8), 1 mM EDTA, 0.5% Triton X-100, 1 M NaCl)) at 37 °C overnight. Digested gels were next placed in excess volumes of double deionized water (double-distilled H 2 O) for 25 min to expand. This step was repeated 3−5 times in double-distilled H 2 O, until the size of the expanding sample plateaued. Transmission electron microscopy Twelve-month-old 5xFAD mice were perfused with 4% PFA and the brain tissues were sectioned into 50-μm-thick slices using a vibratome (VT1000S, Leica). The slices were refixed in 2% glutaraldehyde in 0.1 M cacodylate buffer (pH 7.4) for 1 h, then post-fixed in 1% OsO 4 in the same buffer at room temperature for 1 h. After en bloc staining with 2% aqueous uranyl acetate for 30 min, tissues were dehydrated in a graded series of ethanol to 100%, followed by propylene oxide and finally embedded in EMBed 812 resin. Tissue blocks were polymerized overnight in an oven at 60 °C. Thin sections (60 nm) were cut by a Leica ultramicrotome (UC7) and post-stained with 2% uranyl acetate and lead citrate. Sample grids were examined on the FEI Tecnai transmission electron microscope with an accelerating voltage of 80 kV, and digital electron micrographs were recorded with an Olympus Morada CCD camera and iTEM imaging software.
AAV-mediated molecular manipulations
AAV vectors were injected into approximately 3-month-old and approximately 7-month-old 5xFAD mice. AAVs were infused through the subarachnoid space as previously shown 51 . Brain tissues were collected around 1.5 months and 3 months after virus injection for treatments initiated at 3 and 7 months of age, respectively, and fixed with 4% paraformaldehyde. Brain slices of 50 μm thickness were prepared and stained with anti-LAMP1 antibodies (DSHB, 1D4B) and thioflavin S. Imaging and quantification of PAASs were performed as described previously 51 , 66 . In brief, tiled z -stack images of the infected cortical regions were taken at zoom 1 and 1 μm z -steps. Individual plaques were segmented from the tiled images and blinded to the mouse and treatment information. For measurement of PAAS bulb size, the z plane with the largest cross-sectional area of each individual spheroid was selected, and the cross-sectional area was measured using NIH ImageJ/Fiji by manually selecting the outlines of that cross-section based on the outline of virally expressed cytoplasmic GFP fluorescence.
Computational modelling
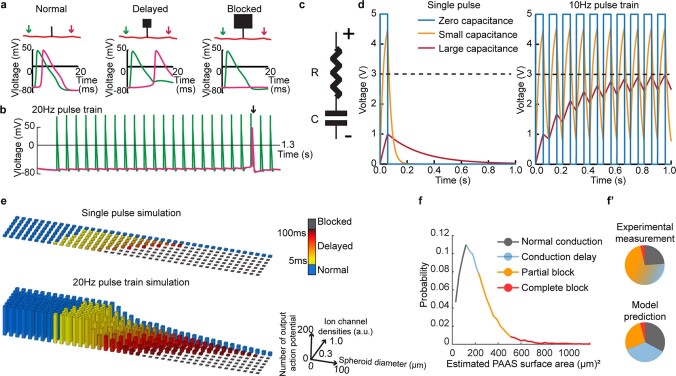
All modelling experiments of axon spheroids used methodologies that were previously validated 68 , 69 . The chosen morphology parameters and ion-channel distributions were held constant within each compartment for each simulation. The axon length was 566 μm and diameters were set from 0.1 to 0.9 μm. The spheroids were modelled as a ‘cylinder and stick’. The stick (5 μm length and diameter varying from 0.3 to 8.3 μm) was connected to the middle of the axon and on the other end to the cylinder (a bulb head) of which the surface area varied from 0 to 7,100 μm 2 (equivalent spherical diameter varied from 0 to 150 μm). In most simulations, the axon contained voltage-gated sodium and potassium channels and a leak current. The densities of the voltage-gated channels were varied from 0 to an amount 1.1× as strong as needed to produce regenerative (sustained) APs in the axon. Channel conductances were set in the spheroids with the same (varying) strength as was present in the axon. One or more strong-current injections (0.2 ms, 2 nA) were applied to one end of the axon to reliably evoke a single or multiple input AP(s) that subsequently propagated to the spheroids. Current injections just over the threshold generated qualitatively similar results (larger diameter axons required more current to evoke an AP). We checked for the presence of output APs on the other side of the spheroids by testing for voltages exceeding 10 mV. We counted the number of output APs that were present in a 10 s simulation where either the single input AP occurred at, or the train of 20 Hz input APs began at 100 ms.
Statistics and reproducibility
The methods to analyse ELPVs, cathepsin D levels or the pH in individual axon spheroids, as well as spheroid size after treatment, the specific numbers of plaques or spheroids measured from an individual human or mouse sample for each experiment are provided in the figure legend of the particular experiment, and the average results were used as the representative outcome for that individual. The number of post-mortem human tissues or mice was used as the sample size in these cases. To analyse differences in the calcium rise time between ROIs along axon segments, the number of axons was used as the sample size. This is because individual in vivo experiments had very few axons measured due to the necessary sparse labelling method used in these experiments. To analyse the interhemispheric calcium rise time delay, both the number of axons and the number of mice were used as sample sizes. For analysis of interhemispheric conduction using a voltage sensor, the number of cell bodies were used as the sample size. For analysis of neural circuit function, the number of mice was used as the sample size. In all graphs, individual data points are shown. In all statistical comparisons, non-parametric tests were used unless otherwise justified. Specific tests used for each graph can be found in the corresponding figure legend. When more than two groups were considered and compared, corrections for multiple comparisons were performed as part of the post hoc analysis. All statistical analysis was performed using GraphPad Prism. Representative confocal images shown in the figures were repeated independently by at least two experimenters in multiple mice or human samples.
Inclusion and ethics statement
We balanced both sexes in all of our experiments to the best of our ability. No sex-specific effects of axonal spheroids on conduction, or modulation of PLD3 on the degree of axonal spheroids were observed in our study. The brain tissues were obtained from the Sun Health Research Institute Brain and Body Donation Program, the Mayo Clinic, the University of Washington Alzheimer’s Disease Research Center Neuropathology Core and the Alzheimer’s Disease Research Center at Washington University in St Louis, in complete compliance with the human tissue research use regulation in each organization. Reporting summary Further information on research design is available in the Nature Portfolio Reporting Summary linked to this article.
Online content Any methods, additional references, Nature Portfolio reporting summaries, source data, extended data, supplementary information, acknowledgements, peer review information; details of author contributions and competing interests; and statements of data and code availability are available at 10.1038/s41586-022-05491-6.
Supplementary information Supplementary Information Supplementary Discussion 1–4 and additional references. Supplementary Discussion 1: estimating the number of axons forming spheroids around individual amyloid plaques. Supplementary Discussion 2: additional analysis of axonal conduction computational modelling results. Supplementary Discussion 3: additional discussion on the impact of PAASs on neural networks involved in memory formation. Supplementary Discussion 4: additional discussion on the impact of PAASs on neural networks involved in memory formation. Reporting Summary Peer Review File Supplementary Video 1 Spatial plots of simulated action potentials propagating through axon segments with and without spheroids. Examples of action potential propagation in axons with no spheroids, small spheroids and large spheroids. The plot shows simulated membrane potentials at each location of the axon at given time points. Each simulation lasted for 10 ms from start to end. These three PAAS sizes produce three different types of events—normal conduction, delayed conduction and conduction blockage. Supplementary Video 2 Imaging calcium transient events in axons with spheroids. Example two-photon time-lapse images in a 9-month-old 5xFAD mouse. Axons were labelled with AAV-GCaMP6s and colour coded (16-colour intensity lookup table in Fiji). Images were taken at 2 Hz. The outline of the amyloid plaque is labelled with a yellow line. Supplementary Video 3 Imaging calcium transients from the somatosensory cortex in an awake mouse. Example two-photon time-lapse images of neurons labelled with GCaMP6f in a 9-month-old 5xFAD mouse. Images were taken at 20 Hz. The video was generated at 60 fps.
📊 Figures
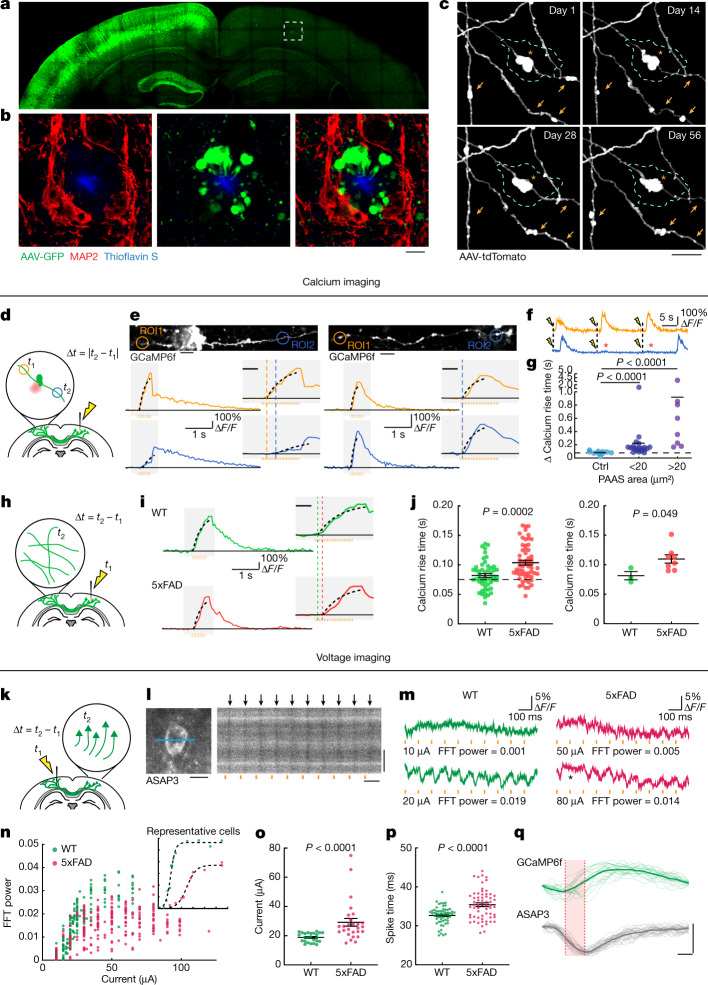
Fig. 1
Plaque-associated axonal spheroids block AP propagation and disrupt interhemispheric connectivity.
a , Confocal images of a mouse brain after unilateral injection of AAV2-GFP. b , Images from the region in a indicated by a dashed box showing axonal spheroids that can only come from transcallosal pr...
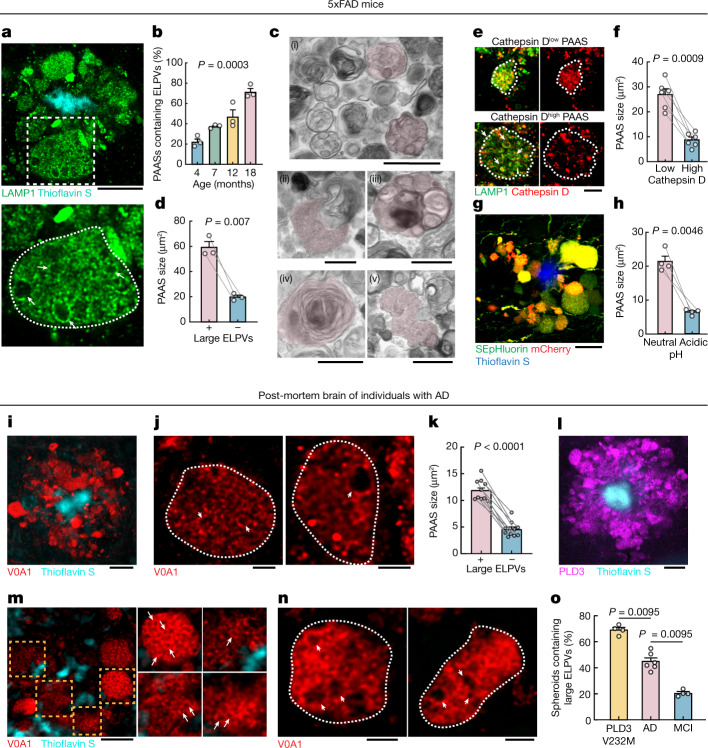
Fig. 2
Accumulation of abnormally ELPVs is associated with spheroid expansion and cognitive decline.
a u2013 h , Analyses in 5xFAD mice. a , Confocal image of spheroids labelled by LAMP1 (green) around an amyloid plaque (cyan). Bottom, magnified image (dashed box in the top image) of a large spheroid...
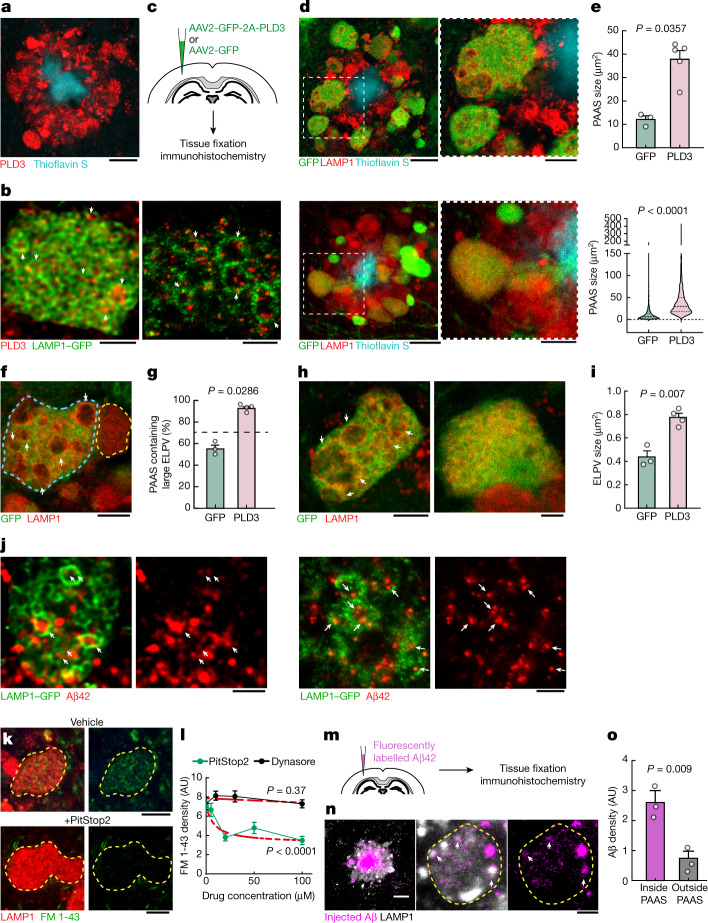
Fig. 3
PLD3 mediates endolysosomal vesicle enlargement and spheroid expansion.
a , Confocal image showing the enrichment of PLD3 in spheroids in 5xFAD mice. Scale bar, 10u2009u03bcm. b , Confocal (left) and expansion microscopy (right) images of PLD3 immunofluorescence (red) and...
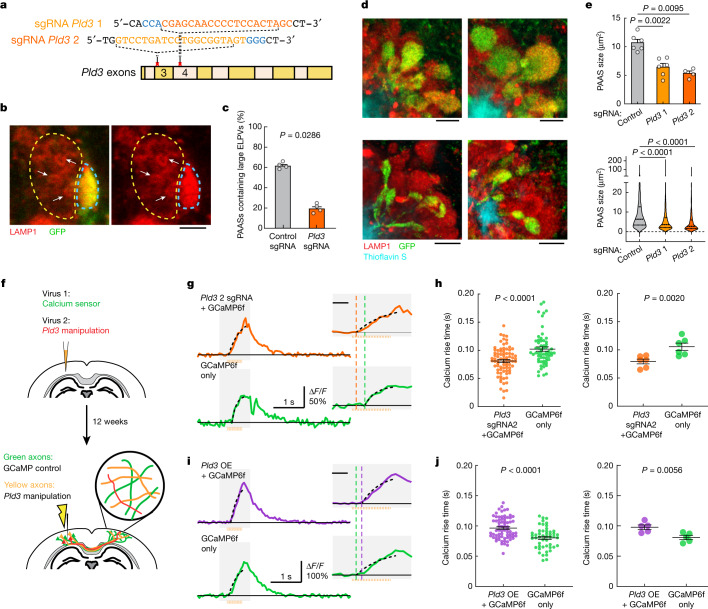
Fig. 4
CRISPRu2013Cas9-mediated Pld3 deletion reduces spheroid size and improves axonal conduction.
a , The design of two guide RNAs targeting the Pld3 gene. b , Confocal images of adjacent spheroids with (blue dashed line) and without (yellow dashed line) Pld3 deletion. The arrows indicate ELPVs. S...
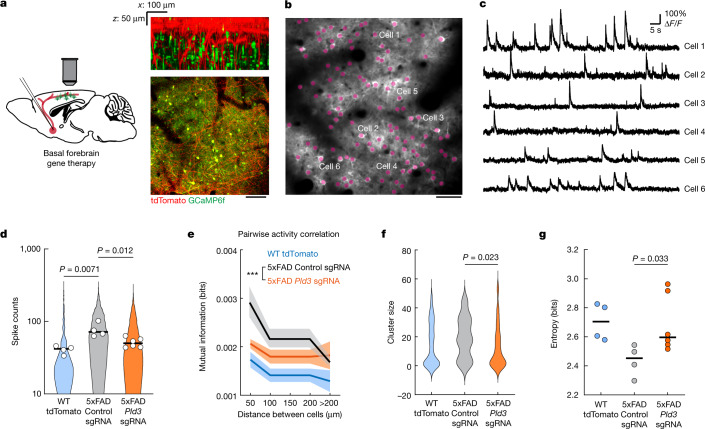
Fig. 5
Reduction in axonal spheroids by Pld3 deletion improves neural circuit function.
a , Schematics of cholinergic neurons in the basal forebrain projecting to the cortex, infected with AAV viruses encoding either Pld3 or control sgRNAs (left). Right, two-photon images showing intermi...
Extended Data Fig. 1
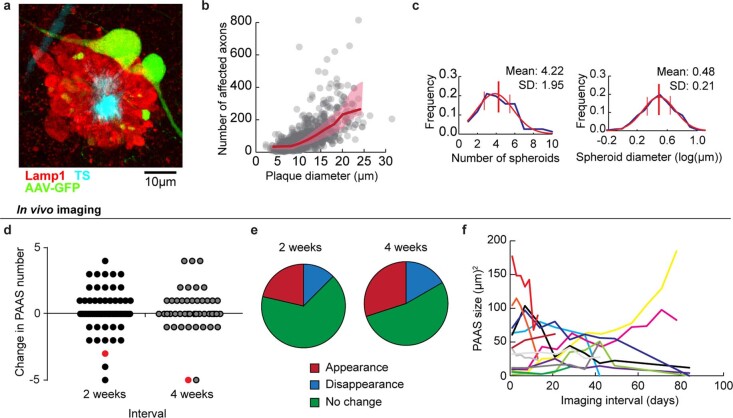
Amyloid plaque-associated axonal spheroids predominantly show structural stability and some dynamism over extended intervals.
a , Confocal image of spheroids labelled with anti-LAMP-1 in a 5xFAD mouse. An axon labelled by GFP-expressing AAV co-localizes with LAMP-1. b , Estimation of the total number of spheroid-affected axo...
Extended Data Fig. 2
Computational modelling of axonal conduction abnormalities caused by PAAS.
a , Computer simulations of membrane potentials recorded at two points on each side of PAAS (green and magenta arrows in upper panels) during a single action potential. Three different scenarios are p...
Extended Data Fig. 3
Axonal spheroids markedly disrupt spontaneous action potential conduction.
a , Two-photon in vivo calcium imaging of spontaneous activity in axons near amyloid plaques (blue) with and without PAAS. Given the relatively low frequency of spontaneously active neurons that can b...
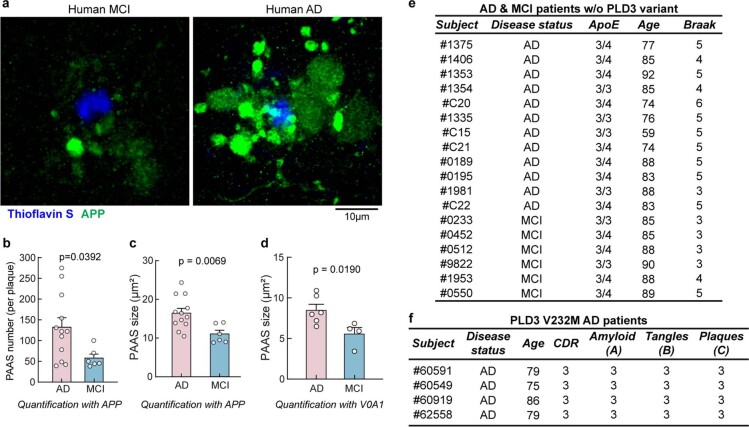
Extended Data Fig. 4
PAAS numbers in humans correlate with severity of cognitive impairment.
a , Axon spheroids labelled by Amyloid Precursor Protein (APP) immunofluorescence in post-mortem human brain (middle frontal gyrus), from subjects with mild cognitive impairment (MCI) and AD. b , Tota...
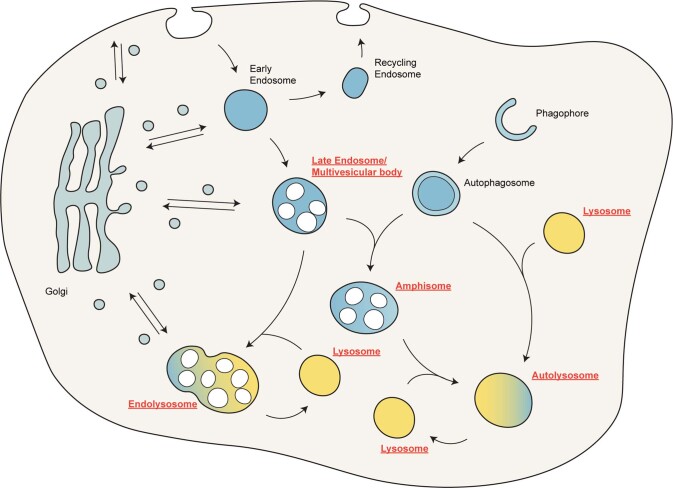
Extended Data Fig. 5
Schematic diagram of the potential source of enlarged LAMP1-positive vesicles through disruption of the endosomal-lysosomal-autophagic system.
The endosomal-lysosomal-autophagic system is a dynamic and interconnected network of membranous organelles and vesicles that involves multiple biological processes, including endocytosis, autophagy, o...
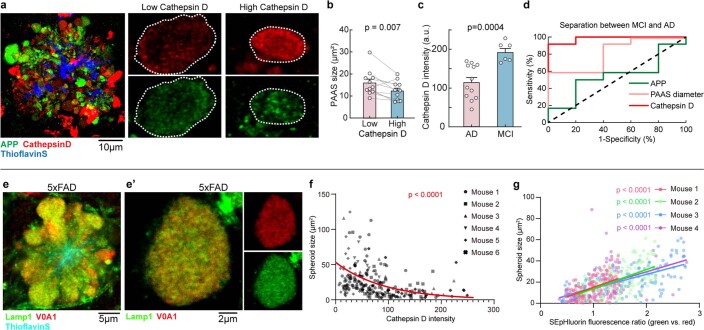
Extended Data Fig. 6
Additional data on the accumulation of enlarged vesicles within PAAS.
a , Confocal images of spheroids labelled by APP and Cathepsin D immunofluorescence in post-mortem human AD brain. Right panels show zoomed-in examples of spheroids (white dotted lines) with low or hi...
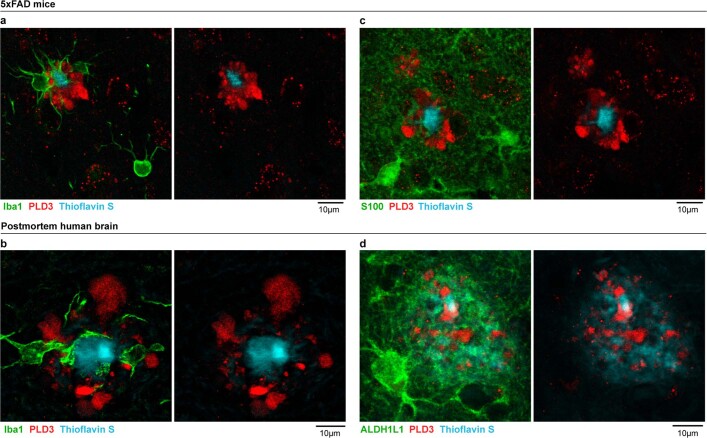
Extended Data Fig. 7
Absence of PLD3 protein expression in microglia and astrocytes in 5xFAD mice or human AD brains.
a and b , Confocal images showing absence of PLD3 signal (red) within Iba1-labelled microglia (green) in 5xFAD mouse brain ( a ) and post-mortem brain tissue of AD human patients ( b ). c , Confocal i...
Extended Data Fig. 8
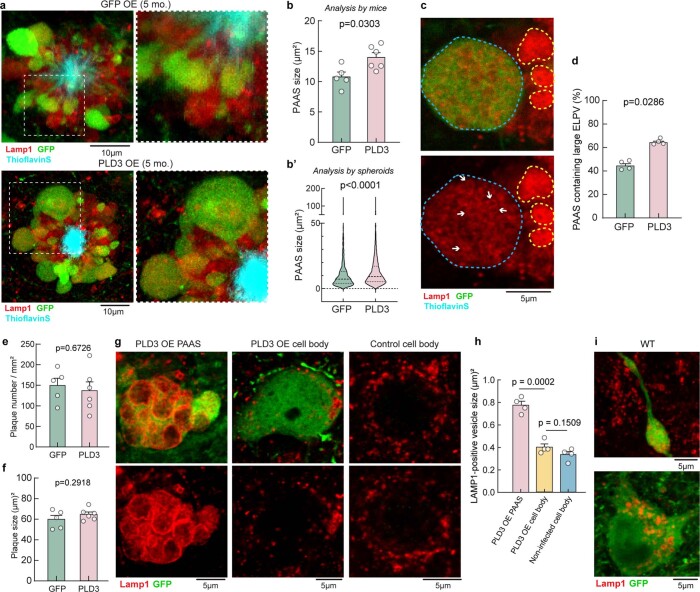
Analyses of ELPVs, spheroids and amyloid plaques in 5-month-old 5xFAD mice with PLD3 overexpression.
a , Confocal images of spheroids with GFP or PLD3 overexpression. Right panels show zoomed images from dashed boxes. b , Spheroid sizes in 5-month-old 5xFAD mice with PLD3 or GFP overexpression, prese...
Extended Data Fig. 9
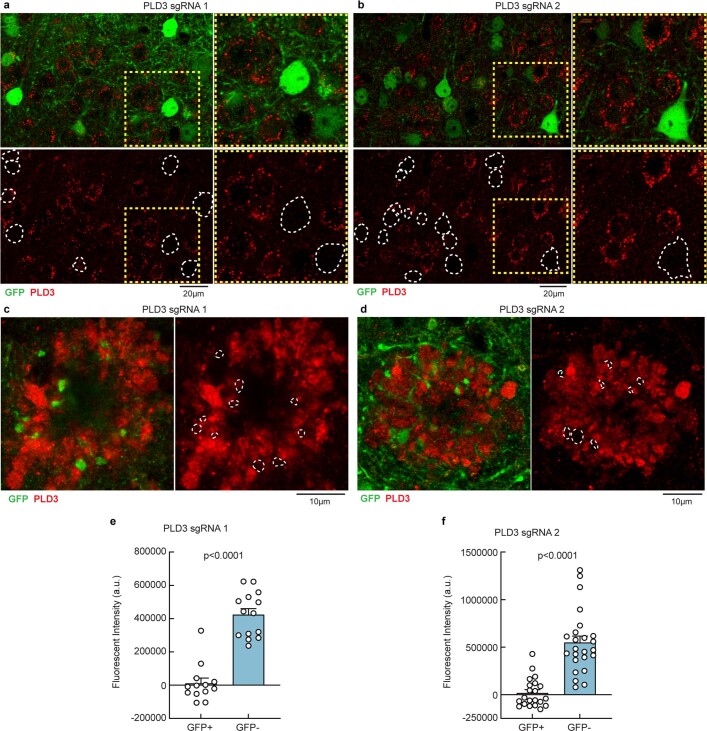
Validation of CRISPR-Cas9-mediated PLD3 deletion.
a - d , Confocal images of PLD3 immunohistochemistry in tissue infected (green) and uninfected with PLD3-targeted sgRNA1 ( a and c ) or sgRNA2 ( b and d ). White dashed lines indicate outlines of infe...
Extended Data Fig. 10
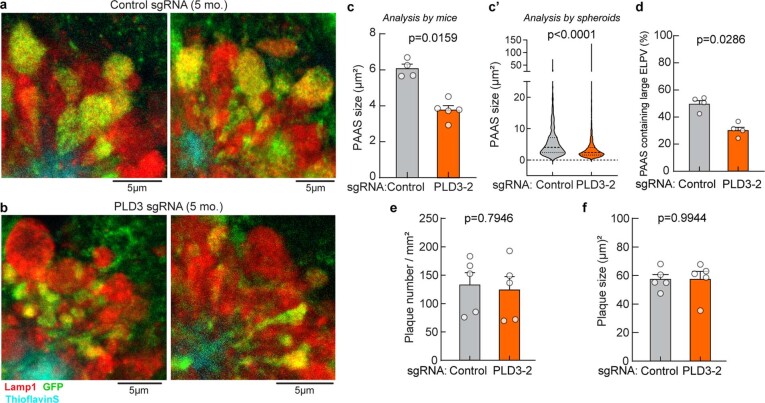
Additional analyses of ELPVs, spheroids and amyloid plaques in mice with PLD3 deletion.
a and b , Confocal images of infected and uninfected PAAS in 5xFAD mice with control sgRNA ( a ) or PLD3-targeting sgRNA ( b ). c , Spheroid size in 5-month-old mice with control sgRNA or PLD3 sgRNA 2...
Extended Data Fig. 11
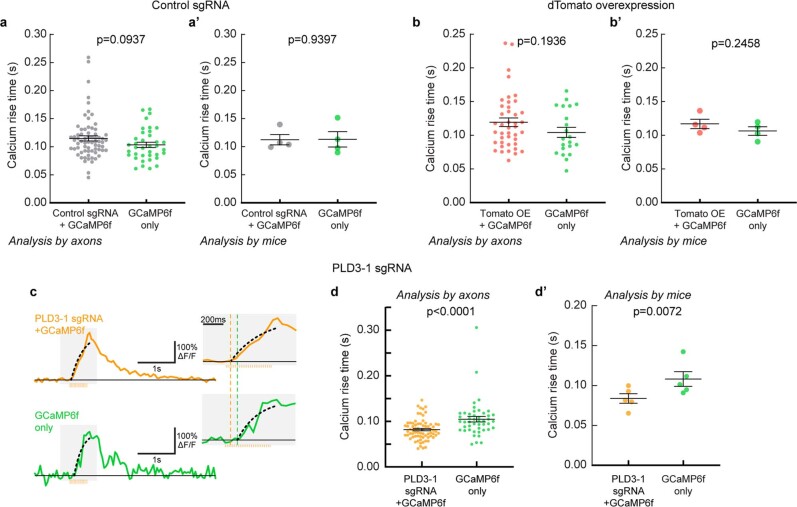
Additional analyses of axonal conduction upon PLD3 modulation.
a , Spike times in axons expressing control sgRNA, presented by individual axons or by mice. nu2009=u200969 manipulated and 37 control axons, and Nu2009=u20094 mice. b , Spike times in axons with dTom...
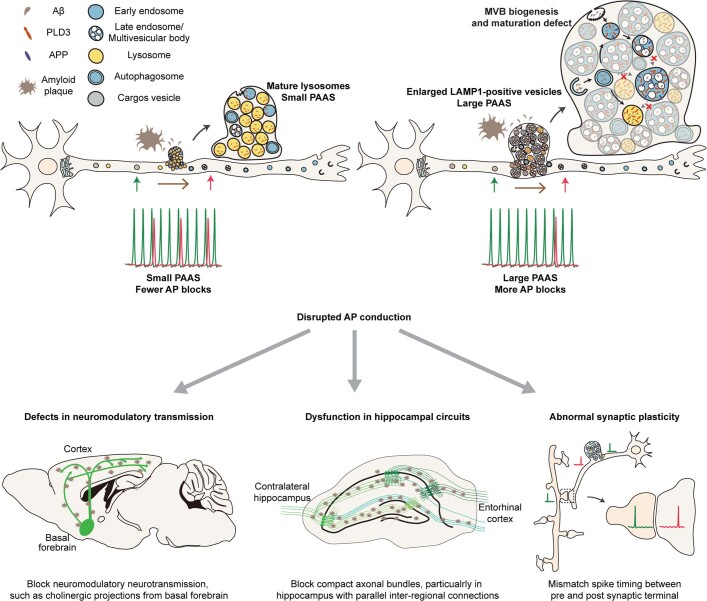
Extended Data Fig. 12
Proposed model of PAAS enlargement and functional consequences in Alzheimeru2019s disease.
1) Our study demonstrated that the accumulation of abnormally enlarged ELPVs is a major driver of PAAS enlargement. Small PAAS predominately contain mature lysosomes, while larger PAAS contain abundan...
Figure images are served from the NIH/NLM PubMed Central Open Access Subset or Europe PMC; copyright remains with the publishers and authors.
💬 Discussion
0 commentsNo comments yet. Be the first to start a discussion!
Leave a Comment