Abstract
AbstractCoronavirus replication is associated with the remodeling of cellular membranes, resulting in the formation of double-membrane vesicles (DMVs). A DMV-spanning pore was identified as a putative portal for viral RNA. However, the exact components and the structure of the SARS-CoV-2 DMV pore remain to be determined. Here, we investigate the structure of the DMV pore by in situ cryo-electron tomography combined with subtomogram averaging. We identify non-structural protein (nsp) 3 and 4 as minimal components required for the formation of a DMV-spanning pore, which is dependent on nsp3-4 proteolytic cleavage. In addition, we show that Mac2-Mac3-DPUP-Ubl2 domains are critical for nsp3 oligomerization and crown integrity which influences membrane curvature required for biogenesis of DMVs. Altogether, SARS-CoV-2 nsp3-4 have a dual role by driving the biogenesis of replication organelles and assembly of DMV-spanning pores which we propose here to term replicopores.
🔬 Techniques
🔭 Microscopes
💻 Software
✨ Fluorophores
🧪 Sample Preparation
🔬 Cell Lines
🏭 Microscope Brands
🧪 Reagent Suppliers
📷 Detectors
💻 Software Details
💻 Code & Software
Toolbox for post-correlation cryo-CLEM workflow developed at Chlanda Lab, Heidelberg University.
autolamella is a python package for automated cryo-lamella preparation with focused ion beam milling.
💾 Data Repositories
🏛️ Research Organizations (ROR)
Affiliated research institutions:
📋 Methods
Cell culture HEK293T (293T ECACC, 1202201) cells were purchased from Sigma-Aldrich. VeroE6 cells were purchased from American Type Culture Collection (ATCC; Catalog #CRL-1586). Cells were maintained in Dulbecco’s modified Eagle medium (DMEM, Thermo Fisher Science) with high concentration of glucose, GlutaMAX supplement, 100 U/ml penicillin, 100 μg/ml streptomycin, and 10% fetal bovine serum at 37 °C and 5% CO 2 . For DNA transfection TransIT-LT1 Transfection Reagent was used according to the manufacturer’s protocol (Mirus Bio LLC).
Plasmids and antibodies Codon-optimized synthetic
DNA of 7416 bp expressing HA-nsp3-nsp4-V5 cDNA was ordered in 3 fragments from Biocat GmbH (Heidelberg) and assembled using overlap-extension PCR followed by insertion in pcDNA3.1 vector backbone using EcoRI-XbaI restriction sites. The expression of nsp3 and nsp4 from this plasmid and the induction of DMVs were confirmed previously 13 . Truncations were generated using In-Fusion HD Cloning Plus kit (TAKARA Bio). The amino acid sequences of the nsp3-4 constructs used in this study are listed in Supplementary Data 1 . pN1-mApple plasmid (#54567) was purchased from Addgene. To detect the HA-tag and V5-tag by immunofluorescence microscopy and Western blot analysis, a rabbit anti-HA (Invitrogen, 71–5500), mouse anti-V5 antibodies (Santa Cruz Biotechnology, sc-271944) and mouse anti-GAPDH (Santa Cruz Biotechnology, sc-47724) were used as primary antibodies, respectively. The secondary antibodies Alexa Fluor 546 goat anti-rabbit (Invitrogen, A11010), Alexa Fluor 488 goat anti-mouse (Invitrogen, A11029) and Alexa Fluor 488 goat anti-rabbit (Invitrogen, A11034) were used for immunofluorescence microscopy. The secondary antibodies mouse anti-rabbit IgG-HRP (Santa Cruz Biotechnology, sc-2357) and anti-mouse IgG BP-HRP (Santa Cruz Biotechnology, sc-516102) were used for Western blot analysis.
Show full methods section
Cell culture HEK293T (293T ECACC, 1202201) cells were purchased from Sigma-Aldrich. VeroE6 cells were purchased from American Type Culture Collection (ATCC; Catalog #CRL-1586). Cells were maintained in Dulbecco’s modified Eagle medium (DMEM, Thermo Fisher Science) with high concentration of glucose, GlutaMAX supplement, 100 U/ml penicillin, 100 μg/ml streptomycin, and 10% fetal bovine serum at 37 °C and 5% CO 2 . For DNA transfection TransIT-LT1 Transfection Reagent was used according to the manufacturer’s protocol (Mirus Bio LLC).
Plasmids and antibodies Codon-optimized synthetic
DNA of 7416 bp expressing HA-nsp3-nsp4-V5 cDNA was ordered in 3 fragments from Biocat GmbH (Heidelberg) and assembled using overlap-extension PCR followed by insertion in pcDNA3.1 vector backbone using EcoRI-XbaI restriction sites. The expression of nsp3 and nsp4 from this plasmid and the induction of DMVs were confirmed previously 13 . Truncations were generated using In-Fusion HD Cloning Plus kit (TAKARA Bio). The amino acid sequences of the nsp3-4 constructs used in this study are listed in Supplementary Data 1 . pN1-mApple plasmid (#54567) was purchased from Addgene. To detect the HA-tag and V5-tag by immunofluorescence microscopy and Western blot analysis, a rabbit anti-HA (Invitrogen, 71–5500), mouse anti-V5 antibodies (Santa Cruz Biotechnology, sc-271944) and mouse anti-GAPDH (Santa Cruz Biotechnology, sc-47724) were used as primary antibodies, respectively. The secondary antibodies Alexa Fluor 546 goat anti-rabbit (Invitrogen, A11010), Alexa Fluor 488 goat anti-mouse (Invitrogen, A11029) and Alexa Fluor 488 goat anti-rabbit (Invitrogen, A11034) were used for immunofluorescence microscopy. The secondary antibodies mouse anti-rabbit IgG-HRP (Santa Cruz Biotechnology, sc-2357) and anti-mouse IgG BP-HRP (Santa Cruz Biotechnology, sc-516102) were used for Western blot analysis.
Western blot analysis
VeroE6 cells were seeded into 6-well plates at a seeding density of 0.4 × 10 6 cells/well. Cells were transfected with 2 µg DNA/well. At 24 h post transfection (hpt), cells were washed with cold PBS and lysed using 1 ml prechilled lysis buffer (2% SDS, 50 mM Tris-HCl, pH 7.4) supplemented with protease inhibitor cocktail in PBS (Roche) for 15 min. The cell lysate was centrifuged at 16,000 × g, 15 min, 4 °C. The supernatant was collected and mixed with Laemmli buffer (BioRad) and DTT (final concentration 50 mM). All samples were boiled at 95 °C for 10 min and separated by electrophoresis on SDS-polyacrylamide gradient gels (4–15%). Proteins were transferred to polyvinylidene fluoride (PVDF) membranes (Bio-Rad) using a Trans-Blot Turbo transfer system (Bio-Rad). Membranes were blocked with 5% milk in TBS-T (1 × TBS with 0.1% Tween-20) for 1 h at room temperature (RT). The PVDF membrane was washed for 3-times10 min with TBS-T and incubated in primary antibody solutions prepared by diluting 1:200 (anti-HA) or 1:1000 (anti-V5, anti-GAPDH) in TBS-T with 5% milk over night at 4 °C. Subsequently, membranes were washed 3 times with TBS-T and incubated in secondary antibody solutions prepared by diluting 1:1000 in TBS-T with 5% milk for 1 h at RT. Blots were washed 3 × 10 min with TBS-T and incubated in enhanced chemiluminescence substrate (Clarity Western ECL substrate, Bio-Rad) solution for 5 min at RT in dark. Images were acquired with Azure 400 Imaging System (Azure Biosystems).
Fluorescence microscopy
VeroE6 cells were seeded into 12-well plates on coverslips at a seeding density of 0.12 × 10 6 cells/well. Cells were transfected with 750 ng DNA/well. Cells were washed with PBS at 24 hpt and fixed by 4% formaldehyde (PFA) diluted in PBS (16% PFA ( E15710 ), Science Services) for 15–30 min at RT. Cells were washed twice with PBS and permeabilized with permeabilization buffer (0.5% Triton X-100 in PBS) for 5 min at RT. Cells were washed 3 × 5 min with PBS and blocked with blocking buffer (3% lipid-free BSA in PBS-T) for 1 h at RT. Cells were washed 3 times with PBS and incubated with primary antibody solutions prepared by diluting 1:200 in dilution buffer (1% lipid-free BSA in PBS-T) for 1 h at RT. Cells were washed 3 × 5 min with PBS and incubated in secondary antibody solutions prepared by diluting 1:500 in dilution buffer for 1 h at RT in dark. Cells were washed 3 × 5 min with PBS and incubated in DAPI mix (1:1000 dilution in PBS) for 1 min at RT. Cells were washed 2 × 5 min with PBS and once with deionized water and mounted on clean glass slides using a 7 µl mounting medium (Prolong Glass, Life Technologies). After drying, samples were analyzed with Leica TCS SP8 confocal laser scanning microscope, equipped with a 63× objective (numerical aperture 1.40; 1 Airy unit) and a Leica HyD hybrid detector. One slice was chosen to show in the images, and the brightness and contrast were adjusted to the same scale in ImageJ/FIJI 41 . Cells for transfection/co-transfection efficiency experiments were seeded as described above. Each well was transfected with 750 ng DNA/well (500 ng of HA-nsp3-4-V5 construct and 250 ng of mApple construct). The staining protocol was performed as mentioned above with the rabbit anti-HA primary antibody and Alexa Fluor 488 goat anti-rabbit secondary antibody. Samples were analyzed with Celldiscoverer 7 (Zeiss) (5x objective with double magnification). High pressure freezing and freeze substitution Sapphire discs with 3.0 mm diameter and 50 μm thickness (Wohlwend GmbH) were cleaned with 100% ethanol and coated with a 15 nm carbon layer using a sputter coater (EM ACE600, Leica). An “F” letter was scratched on the carbon side to distinguish between the two sides of the disc, followed by overnight incubation of the discs at 120 °C. Prior to use, the carbon-coated discs were plasma-cleaned for 10 s (s) in a Solarus 950 (Gatan), sterilized in 70% ethanol, washed once with DMEM, and placed in 1 ml DMEM in a 35 mm dish with the “F” side facing up. The DMEM was removed and HEK293T cells were seeded on the sapphire discs (0.18 × 10 6 cells in 2 ml DMEM per dish). Cells were transfected with 1 µg DNA/dish (co-tranfection of pN1-mApple plasmid). At 24 hpt, sapphire discs with transfected cells were assembled with 1-hexadecene coated specimen carrier Type A and B (Wohlwend GmbH) with cells facing the 100 µm deep cavity of carrier Type A. Cells were vitrified by high-pressure freezing at approximately 2,200 bar maintained for 370 ms with a cooling rate of 20,000 K/s using a Leica EM ICE. Sapphire discs with vitrified cells were transferred from liquid nitrogen to a freeze-substitution (FS) solution (0.1% uranyl acetate in anhydrous acetone) cooled to −90 °C and processed in automated FS system (EM AFS2, Leica). After washing with acetone, samples were infiltrated with Lowicryl HM20 and polymerized using UV light. The FS protocol was performed according to Supplementary Table 1 . Ultramicrotomy and electron microscopy of resin sections Lowicryl-embedded samples were sectioned using diamond knives (DiATOME) and a UC7 ultramicrotome (Leica). Sections with 200 nm nominal thickness were placed on 2 × 1 mm copper slot grids (Gilder) coated with support film (1% formvar or pioloform). Grids were imaged with a Talos L120C TEM operated at 120 keV and equipped with a Ceta-M camera with a 4k × 4k CMOS (Thermo Fisher Scientific). The whole grid was mapped at a magnification of 155 × and images were acquired at magnifications of 5,300×; 11,000× and 45,000× (corresponding pixel sizes at the specimen level: 26.44 Å, 13.35 Å and 3.28 Å respectively) using SerialEM 42 . Plunge-freezing To prepare samples for plunge-freezing, 35 mm cell culture dishes coated with a thin layer of polydimethylsiloxane (PDMS) were used to culture cells. Holey gold grids (200 mesh Quantifoil™ Au R2/2 grids) were placed into a PDMS coated dish and plasma-cleaned for 10 s in a Gatan Solarus 950 (Gatan). The PDMS-coated dish with grids was sterilized with 70% ethanol and washed twice with DMEM. The DMEM was removed and VeroE6 cells were seeded on the grids at a seeding density of 0.12 × 10 6 cells/dish. Cells were transfected with 1 µg DNA/dish (925 ng of nsp3-4 constructs, 75 ng of mApple construct). At 18–24 hpt, cells were stained with 1 µg/ml Hoechst (B2261) for 5 min and washed once with DMEM. Cells were plunge-frozen into liquid ethane using a Leica EM GP2 automatic plunge-freezer. The ethane temperature was set to −183 °C and the chamber to 25 °C and 80% humidity. An additional 2 µl medium was added to the grid just before plunge-freezing. Grids were blotted from the back with Whatman® Type 1 paper for 3 s. Grids were clipped into FIB-AutoGrids™ (Thermo Fisher Scientific) designed for FIB milling.
Cryo-light microscopy and cryo-focused ion beam milling
Cryo-light microscopy was performed at −190 °C using cryo-CLEM wide-field microscope (Leica Microsystems) equipped with a 50x objective with a numerical aperture of 0.9. A map was acquired as a Z-stack (30 µm, 300 nm spacing) in a bright field channel, blue fluorescence channel (excitation wavelength: 325–375 nm, emission wavelength: 435–490 nm) and red fluorescence channel (excitation wavelength: 540–580 nm, emission wavelength: 592–668 nm) covering 1.2 × 1.2 mm area using LAS X Navigator software (Leica). The final map was stitched using the Cryo-CLEM/Stitch TileScan plugin available at https://github.com/Chlanda-Lab/cryoCLEM 43 in ImageJ/FIJI. Cryo-focused ion beam milling was performed using Aquilos dual-beam cryo-focused ion beam-scanning electron microscope (cryo-FIB-SEM) (Thermo Fisher Scientific) with a cryo-stage cooled to −180 °C. Grids were mapped by cryo-scanning electron microscopy (cryo-SEM) and the cryo-LM map of the grid was correlated to the cryo-SEM map using the MAPS Software (Thermo Fisher Scientific). Transfected cells were recognized by the mApple fluorescence signal and selected for milling. After the application of the protective organo-metallic platinum layer cells were milled gradually in 5 steps with a stage angle between 15° and 18° using a gallium ion beam. The first four steps were carried out automatically using a modified Autolamella script 44 available at https://github.com/DeMarcoLab/autolamella . The last two milling steps were performed manually with a nominal thickness of 150 nm. Micro-expansion joints were used to minimize lamella bending 45 .
Cryo-electron tomography and tomogram reconstruction
Cryo-electron tomography was done using a Krios cryo-TEM (Thermo Fisher Scientific) operated at 300 keV and equipped with a post-column BioQuantum Gatan Imaging energy filter (Gatan) and K3 direct electron detector (Gatan) with an energy slit set to 15 eV. As a first step, lamellae were mapped at 8,700× (pixel spacing of 10.64 Å) using a defocus of −65 µm in SerialEM 42 to localize double membrane vesicles. Tilt series were acquired using a dose-symmetric tilting scheme 46 with the zero-angle set to 8° and a nominal tilt range of 68° to −52° with 3° increments with SerialEM. Records were acquired as movies at target focus ranging from −4 to −2.5 μm, electron dose per record of 3 e − /Å 2 and a magnification of 42,000× (pixel spacing of 2.156 Å). Beam-induced sample motion and drift were corrected using MotionCor2 47 . Tilt series was aligned using patch tracking or fiducials (2–5 nm large metal clusters of Pt and Au that are deposited on lamella during milling) and tomograms were reconstructed using R-weighted back projection algorithm using 3DCTF, dose-weighting filter and SIRT-like filter 10 in the IMOD software package 48 . Tomograms were denoised using Content Aware Image restoration (Cryo-CARE) 49 . Figures were prepared by averaging 3 or 5 slices of a tomogram.
Subtomogram averaging and tomogram rendering
Pore densities were identified and extracted using a dipole model in Dynamo version 1.1.514 50 using a box size of 256 pixels and an initial template model was created by averaging approximately 30 pores using the orientations inferred by the dipole model. To create the first average of the nsp3-4 sample, pores were picked using a general box model in Dynamo and aligned against the initial template using a spherical mask without imposing any symmetry. To create the average of the ΔUbl1-Mac1 and ΔUbl1-Ubl2 sample, a cylindrical mask was used. For averaging of the ΔUbl1-Ubl2 sample, pores were picked manually with the dipole-oriented model to determine the orientation of the pores. The conical, azimuthal, translational search and angular increments were gradually decreased within 6 iterations using parameters for refinement of the average No.1 (Supplemetary Table S2 ). A symmetry scan was performed on the final average No.1 in Dynamo. Subsequently subtomogram averaging was performed using C6 symmetry where average No.1 was used as a new template to obtain an average No.2 using the same search parameters that were used for creating average No.1. The attained resolution was estimated using Fourier shell correlation with 0.5 and 0.143 criterion using a derived subtomogram averaging project with 2 references and from odd and even half-sets of particles. The C6-symmetrized map of average No.2 was visualized as isosurface in ChimeraX 51 . The isosurface in Fig. 1 was low-pass filtered to 20 Å whereas the isosurfaces in Fig. 4 and Supplementary Fig. 8 were low-pass filtered to 40 Å. The number of particles used for each nsp3-4 construct as well as the estimated resolution of all subtomogram averages is shown in Supplementary Table 3 . Volume rendering was performed manually in Amira (Thermo Fisher Scientific) after tomogram denoising using Cryo-CARE. Subtomogram average of the nsp3-4 pore was placed into the rendering based on coordinates determined from Dynamo cropping table using ArtiaX toolbox 52 in ChimeraX.
Measurements and statistical analysis
Measurements of radius and curvature analysis In IMOD, the osculating circle (as contour model) was fitted at the outer DMV membrane and the radius (r) of the osculating circle was used as a measurement for the radius of the DMV. The curvature of the outer DMV membrane was calculated as 1/r ( κ ) in the tomograms. The same measurement was done for the inner and outer DMV membrane in the subtomogram average. DMV diameter for Supplementary Fig. 3 and 8g was measured manually in IMOD using the longest inner diameter. Pore diameter was measured in ImageJ/FIJI using line density profile. Curve fitting and calculation of diameter was done in MATLAB. Radius values were used to calculate concave pore membrane curvature. Subtomogram averages were segmented in IMOD and convex pore membrane curvature was calculated using the imodcurvature (kappa) command. Curvature values were stored as inverse of the radius in the model. Napari was used to adjust the colormap.
Measurement of luminal spacing
The luminal space of DMVs was measured as the distance between the outer leaflet of the outer membrane and the inner leaflet of the inner membrane. Line density profiles (~ 30 pixels in width, 0.41 Å/pixel) of ~30 nm in length were determined across the respective membrane using the plot profile tool in ImageJ/FIJI. The distances between the first and the fourth global maxima corresponding to the luminal space were then measured for each plot profile. For each DMV, three measurements were performed and the mean of them was reported. Measurement of the nearest distance between pores and number of pores per DMV The number of pores per DMV was counted manually in IMOD by creating models. Each project represented one tomogram, each contour represented a DMV, and each point represented a pore. The coordinates of each point were exported as.NFF files. The distance between each point and its nearest neighbor on the same contour was calculated by the script 53 available at Zenodo. Statistical analysis was done by using unpaired two-tailed t-test. Structure prediction and molecular dynamics The nsp3 region predicted by DeepTMHMM 54 to contain transmembrane helices was extended by 20 residues (nsp3 1391–1589), combined with nsp4 residues 1–124, and subjected to structure prediction using ColabFold 19 . Both AlphaFold2 55 and AlphaFold-Multimer 56 were used for prediction, both without templates, with 12 recycles, and using model 5. The logarithm of the mutation tolerance normalized by nucleotide-level mutation bias 32 was averaged over the first two nucleotides for each codon and compared to the distribution across ORF1a. Molecular dynamics started from the 200-ns timepoint of a previously reported nsp3-nsp4 simulation 33 , building systems identically in a DOPE/POPC/SAPI bilayer, making point mutations with CHARMM-GUI Membrane Builder 57 , and using previously reported simulation conditions. Simulated systems consisted of nsp3 residues 1404–1490 and nsp4 residues 1–124 with ACE and CT3 capping of truncated termini. Systems with wild-type and H120N/F121L nsp4 included 64,130 and 64,120 atoms, respectively, and included three predicted disulfide bonds. All histidines were uncharged. Trajectories were aligned to nsp4 residues 36–124 for visualization. Atomic coordinates were stored at 100-ps intervals and trajectories were analyzed using VMD 58 . Mac1, Mac2, Ubl2 and NAB domains were predicted with ColabFold using AlphaFold2, no templates and 3 recycle steps. Predictions showed predicted local distance difference test (pLDDT) values of ≥80 (Mac1), ≥50 (Mac2), ≥80 (Ubl2) and ≥50 (NAB). Models with the highest average pLDDT out of those predicted by the 5 AlphaFold2 models were used. Different models were used to test whether structures of nsp4 oligomers could be inferred from nsp4 sequence alignments using ColabFold.We first performed a RosettaFold2 59 prediction of full-length nsp4 with C6 symmetry. This was followed by predictions of nsp4 residues 31–397 without symmetry constraints, excluding nsp4 regions lacking predicted interactions in preliminary tests in order to not exceed available GPU memory. Five structures were predicted for each oligomer using AlphaFold Multimer with different weights and three recycles. The top scoring prediction was analyzed for each oligomer. Reporting summary Further information on research design is available in the Nature Portfolio Reporting Summary linked to this article.
Supplementary information Supplementary information Peer Review File Description of Additional Supplementary Files Supplementary Movie 1 Supplementary Movie 2 Supplementary Movie 3 Supplementary Movie 4 Supplementary Data 1 Reporting Summary Source data Source Data
📊 Figures
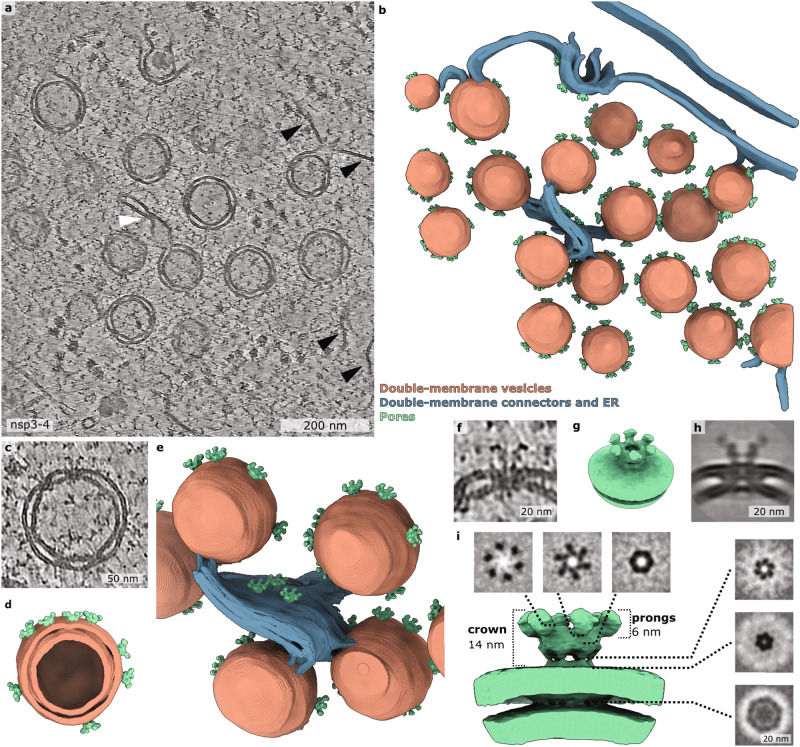
Fig. 1
The SARS-CoV-2 nsp3-4 proteins are sufficient to form DMV-spanning pores.
a Averaged slices of a tomogram acquired on cryo-lamella of VeroE6 cells transfected with HA-nsp3-4-V5 and plunge frozen at 16 hpt. The double-membrane vesicles (DMVs) are interconnected through doubl...
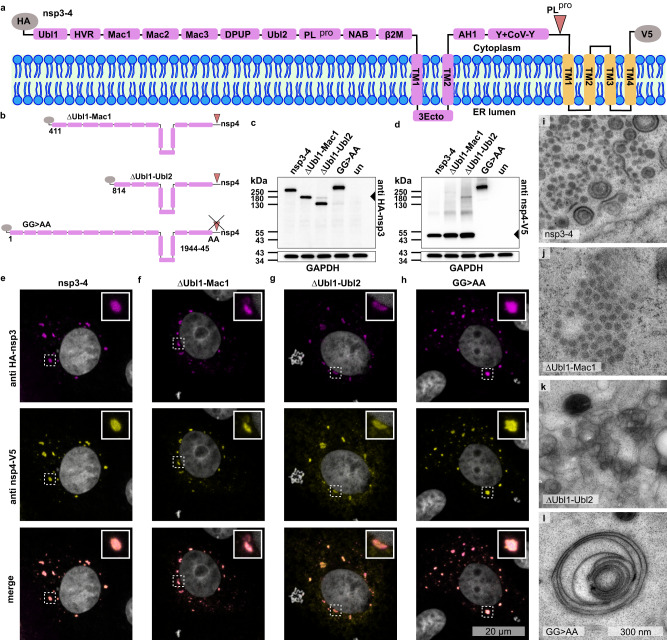
Fig. 2
The N-terminal domains of SARS-CoV-2 nsp3 are critical for the formation of distinct DMVs.
a Schematic representation of membrane bilayer with nsp3-4 polyprotein tagged with HA tag at the N-terminus and V5 tag at the C-terminus. Nsp3 domains and nsp4 are shown in magenta and in yellow, resp...
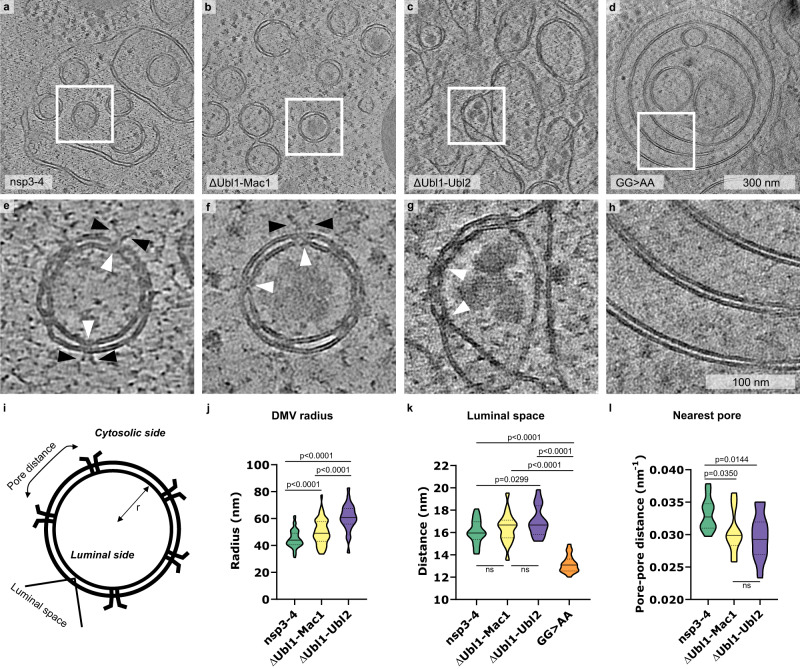
Fig. 3
SARS-CoV-2 nsp3 Ubl1-Ubl2 domains and nsp3-4 cleavage site are required for DMV biogenesis.
Slices of tomograms of VeroE6 cells transfected with nsp3-4 ( a ), u0394Ubl1-Mac1 ( b ), u0394Ubl1-Ubl2 ( c ) and GGu2009>u2009AA ( d ) plunge frozen at 18u201324 hpt. e u2013 h Slices of tomograms di...
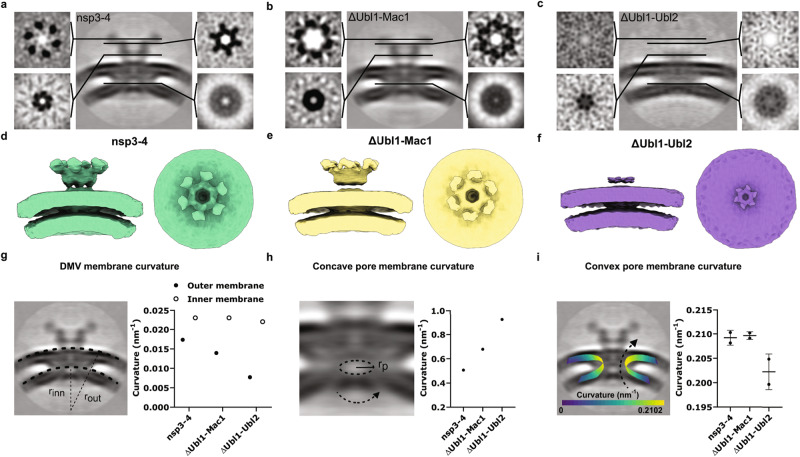
Fig. 4
The region spanning Ubl1-Ubl2 domains of SARS-CoV-2 nsp3 contributes to the structural integrity of the pore.
Orthogonal slices of filtered C6-symmetrized subtomogram averages obtained from tomograms of VeroE6 cells transfected with nsp3-4 ( a ), u0394Ubl1-Mac1 ( b ), u0394Ubl1-Ubl2 ( c ). The position of ort...
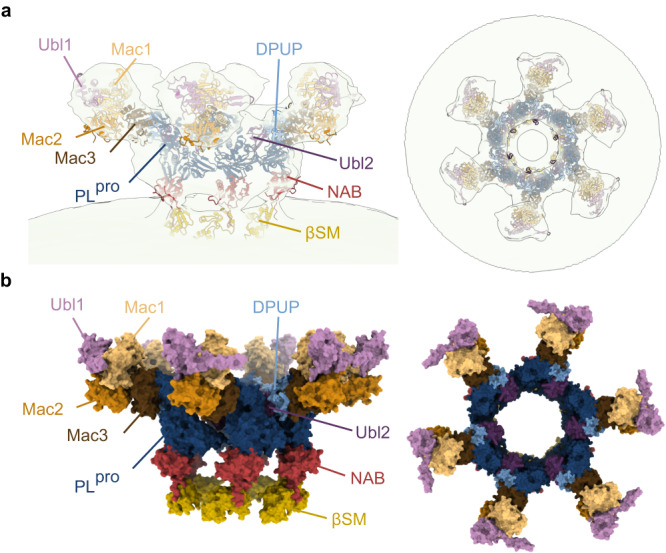
Fig. 5
Model of nsp3 domain localization in the crown region of the DMV pore.
a Side and top view of model showing X-ray-based crystal structures, nuclear magnetic resonance (NMR)-based structures and structures predicted with ColabFold fitted into the subtomogram average of th...
Figure images are served from the NIH/NLM PubMed Central Open Access Subset or Europe PMC; copyright remains with the publishers and authors.
💬 Discussion
0 commentsNo comments yet. Be the first to start a discussion!
Leave a Comment