Abstract
The dynamics and coordination between autophagy machinery and selective receptors during mitophagy are unknown. Also unknown is whether mitophagy depends on pre-existing membranes or is triggered on the surface of damaged mitochondria. Using a ubiquitin-dependent mitophagy inducer, the lactone ivermectin, we have combined genetic and imaging experiments to address these questions. Ubiquitination of mitochondrial fragments is required the earliest, followed by auto-phosphorylation of TBK1. Next, early essential autophagy proteins FIP200 and ATG13 act at different steps, whereas ULK1 and ULK2 are dispensable. Receptors act temporally and mechanistically upstream of ATG13 but downstream of FIP200. The VPS34 complex functions at the omegasome step. ATG13 and optineurin target mitochondria in a discontinuous oscillatory way, suggesting multiple initiation events. Targeted ubiquitinated mitochondria are cradled by endoplasmic reticulum (ER) strands even without functional autophagy machinery and mitophagy adaptors. We propose that damaged mitochondria are ubiquitinated and dynamically encased in ER strands, providing platforms for formation of the mitophagosomes.
🔬 Techniques
🔭 Microscopes
💻 Software
✨ Fluorophores
🧪 Sample Preparation
🔬 Cell Lines
🏭 Microscope Brands
🧪 Reagent Suppliers
📷 Detectors
🔎 Objectives
🎨 Filters
💻 Software Details
🏷️ Research Resource Identifiers (RRIDs)
Verified research resources used in this paper:
🏛️ Research Organizations (ROR)
Affiliated research institutions:
📋 Methods
Key Resources Table REAGENT or RESOURCE SOURCE IDENTIFIER Antibodies
Rabbit anti-OPTN Cayman Chemicals 100000; RRID: AB_10078198 Mouse anti-WIPI2 Bio-Rad MCA5780GA; RRID: AB_10845951 Rabbit anti-phospho (S172)TBK1 Cell Signalling 5483 Mouse anti-Ubiquitin FK2 Enzo BML-PW-8810; RRID: AB_311908 Rabbit anti-FIP200 Protein Tech 17250-1-AP; RRID: AB_10666428 Rabbit anti-ATG9 Cell Signalling 13509 Mouse anti-TOMM20 Abcam ab56783; RRID: AB_945896 Rabbit anti-ATG13 Sigma SAB4200100; RRID: AB_10602787 Rabbit anti-LC3 Sigma L7543; RRID: AB_796155 Rabbit anti-NDP52 GeneTex GTX115378; RRID: AB_10620266 Rabbit anti-Tax1BP1 Protein Tech 14424-1-AP; RRID: AB_2198921 Rabbit anti-VAPA Sigma HPA 009174; RRID: AB_1080549 Rabbit anti-VAPB Sigma HPA 013144; RRID: AB_1858717 Mouse anti-EEA1 BD Biosciences 610457; RRID: AB_397830 Mouse anti-LAMP2 Developmental Studies Hybridoma Data Bank H4B4; RRID: AB_2134755 Mouse anti-TUBULIN Sigma T6199; RRID: AB_477583 Mouse anti-cytochrome C Santa Cruz sc-7159; RRID: AB_2090474 Rabbit anti- phospho(S351)p62 Dr Masaaki Komatsu N/A Rabbit anti-TRAF2 Abcam ab126758; RRID: AB_11145260 Rabbit anti-CIAP1 Abcam ab108361; RRID: AB_10862855 Rabbit anti-CIAP2 Protein Tech 24304-1-AP Mouse anti-TBK1 Santa Cruz sc-398366 Rabbit anti-(S757)pULK1 Cell Signalling 6888 Mouse anti-OPTN Santa Cruz sc-166576; RRID: AB_2156554 Mouse anti-GAPDH Serotec 4699-9555; RRID: AB_2278713 Agrose beads cross linked to anti-ubiquitin antibody FK2 MBL D058-8; RRID: AB_843667 Chemicals, Peptides, and Recombinant Proteins PP242 hydrate Sigma-Aldrich P0037; PubChem SID: 329819988 Ivermectin Sigma-Aldrich I8898; CAS: 70288-86-7 PYR-41 Sigma-Aldrich N2915; CAS: 418805-02-4 Antimycin A from Streptomyces sp. Sigma-Aldrich A8674; CAS: 1397-94-0 BX- 795 Tocris 4318; CAS: 702675-74-9 Oligomycin Tocris 4110; CAS: 579-13-5 CCCP Tocris 0452; CAS: 555-60-2 Rotenone Abcam ab143145 Mdivi-1 Enzo BML-CM127 VPS34-IN1 Kind gift from Ian Ganley N/A Mitot Tracker Deep Red FM Thermo Fisher (Molecular Probes) M22426 Mitot Tracker Red CMXRos Thermo Fisher (Molecular Probes) M7512 Experimental Models: Cell Lines Mouse Embryonic Fibroblasts (MEFs) ATG5 KO Kind gift from Professor Noboru Mizushima, University of Tokyo, Japan N/A Mouse Embryonic Fibroblasts (MEFs) ATG13 KO Kind gift from Professor Noboru Mizushima, University of Tokyo N/A Mouse Embryonic Fibroblasts (MEFs) ATG3 KO Kind gift from Professor Masaaki Komatsu, Niigata University, Japan N/A Mouse Embryonic Fibroblasts (MEFs)ATG7 KO Kind gift from Professor Masaaki Komatsu, Niigata University, Japan N/A Mouse Embryonic Fibroblasts (MEFs) ULK1/ULK2 KO Kind gift from Dr Sharon Tooze, Crick Institute, London UK N/A Mouse Embryonic Fibroblasts (MEFs) ATG9 KO Kind gift from Dr Sharon Tooze, Crick Institute, London UK N/A Mouse Embryonic Fibroblasts (MEFs) OPTN KO Chew et al., 2015 Tumbarello et al., 2012 Mouse Embryonic Fibroblasts (MEFs) FIP200 Jun-Lin Guan, University of Cincinnati, USA N/A HEK 293 KO ATG13 Kind gift from Dr Elise Jacquin and Dr Oliver Florey, Babraham Institute N/A HEK 293 GFP DFCP1 Axe et al, 2008 N/A HEK 293 GFP ATG13 Karanasios et al., 2013 N/A Oligonucleotides Dharmacon siGENOME siRNA smart pools: TAX1BP1 Dharmacon # L-016892-00 Dharmacon siGENOME siRNA smart pools: CIAP1 Dharmacon # L-004390-00 Dharmacon siGENOME siRNA smart pools: CIAP2 Dharmacon # L-004099-00 Dharmacon siGENOME siRNA smart pools: TRAF2 Dharmacon # L-005198-00 Dharmacon siGENOME siRNA smart pools: DNML1 Dharmacon # L-012092-00 Recombinant DNA CFP LC3 Kind gift from Tamotsu Yoshimori, Osaka University, Japan N/A mCherry-Mito This work N/A pEGFP-C1-Atg13 Addgene N/A GFP-Ub Addgene N/A mCherry-Ub This work N/A CFP-Mito This work N/A Software and Algorithms Nikon Elements (v4.60) SIM plugin (v2.3) Nikon https://www.microscope.healthcare.nikon.com/en_EU/products/software/nis-elements/nis-elements-advanced-research Olympus cellSens (v1.17) Olympus https://www.olympus-lifescience.com/en/software/cellsens/ Seahorse XF24 1.8.1 Agilent https://www.agilent.com/cs/pubimages/misc/readme-xf24-181.pdf Prism (Graphpad Software) https://www.graphpad.com/scientific-software/prism/ Zen2 (blue edition) (Carl Zeiss,file version 2.0.14283.302, Germany) Carl Zeiss https://www.zeiss.com/microscopy/int/products/microscope-software/zen-lite.html ANOVA in XLSTAT XLSTAT https://www.xlstat.com/en/ Fiji X 64 (Imaje J) https://fiji.sc/ Lead Contact and Materials Availability Further information and requests for reagents may be directed to, and will be fulfilled by, the Lead Author, Dr. Nicholas T. Ktistakis ( nicholas.ktistakis@babraham.ac.uk ).
Show full methods section
Key Resources Table REAGENT or RESOURCE SOURCE IDENTIFIER Antibodies
Rabbit anti-OPTN Cayman Chemicals 100000; RRID: AB_10078198 Mouse anti-WIPI2 Bio-Rad MCA5780GA; RRID: AB_10845951 Rabbit anti-phospho (S172)TBK1 Cell Signalling 5483 Mouse anti-Ubiquitin FK2 Enzo BML-PW-8810; RRID: AB_311908 Rabbit anti-FIP200 Protein Tech 17250-1-AP; RRID: AB_10666428 Rabbit anti-ATG9 Cell Signalling 13509 Mouse anti-TOMM20 Abcam ab56783; RRID: AB_945896 Rabbit anti-ATG13 Sigma SAB4200100; RRID: AB_10602787 Rabbit anti-LC3 Sigma L7543; RRID: AB_796155 Rabbit anti-NDP52 GeneTex GTX115378; RRID: AB_10620266 Rabbit anti-Tax1BP1 Protein Tech 14424-1-AP; RRID: AB_2198921 Rabbit anti-VAPA Sigma HPA 009174; RRID: AB_1080549 Rabbit anti-VAPB Sigma HPA 013144; RRID: AB_1858717 Mouse anti-EEA1 BD Biosciences 610457; RRID: AB_397830 Mouse anti-LAMP2 Developmental Studies Hybridoma Data Bank H4B4; RRID: AB_2134755 Mouse anti-TUBULIN Sigma T6199; RRID: AB_477583 Mouse anti-cytochrome C Santa Cruz sc-7159; RRID: AB_2090474 Rabbit anti- phospho(S351)p62 Dr Masaaki Komatsu N/A Rabbit anti-TRAF2 Abcam ab126758; RRID: AB_11145260 Rabbit anti-CIAP1 Abcam ab108361; RRID: AB_10862855 Rabbit anti-CIAP2 Protein Tech 24304-1-AP Mouse anti-TBK1 Santa Cruz sc-398366 Rabbit anti-(S757)pULK1 Cell Signalling 6888 Mouse anti-OPTN Santa Cruz sc-166576; RRID: AB_2156554 Mouse anti-GAPDH Serotec 4699-9555; RRID: AB_2278713 Agrose beads cross linked to anti-ubiquitin antibody FK2 MBL D058-8; RRID: AB_843667 Chemicals, Peptides, and Recombinant Proteins PP242 hydrate Sigma-Aldrich P0037; PubChem SID: 329819988 Ivermectin Sigma-Aldrich I8898; CAS: 70288-86-7 PYR-41 Sigma-Aldrich N2915; CAS: 418805-02-4 Antimycin A from Streptomyces sp. Sigma-Aldrich A8674; CAS: 1397-94-0 BX- 795 Tocris 4318; CAS: 702675-74-9 Oligomycin Tocris 4110; CAS: 579-13-5 CCCP Tocris 0452; CAS: 555-60-2 Rotenone Abcam ab143145 Mdivi-1 Enzo BML-CM127 VPS34-IN1 Kind gift from Ian Ganley N/A Mitot Tracker Deep Red FM Thermo Fisher (Molecular Probes) M22426 Mitot Tracker Red CMXRos Thermo Fisher (Molecular Probes) M7512 Experimental Models: Cell Lines Mouse Embryonic Fibroblasts (MEFs) ATG5 KO Kind gift from Professor Noboru Mizushima, University of Tokyo, Japan N/A Mouse Embryonic Fibroblasts (MEFs) ATG13 KO Kind gift from Professor Noboru Mizushima, University of Tokyo N/A Mouse Embryonic Fibroblasts (MEFs) ATG3 KO Kind gift from Professor Masaaki Komatsu, Niigata University, Japan N/A Mouse Embryonic Fibroblasts (MEFs)ATG7 KO Kind gift from Professor Masaaki Komatsu, Niigata University, Japan N/A Mouse Embryonic Fibroblasts (MEFs) ULK1/ULK2 KO Kind gift from Dr Sharon Tooze, Crick Institute, London UK N/A Mouse Embryonic Fibroblasts (MEFs) ATG9 KO Kind gift from Dr Sharon Tooze, Crick Institute, London UK N/A Mouse Embryonic Fibroblasts (MEFs) OPTN KO Chew et al., 2015 Tumbarello et al., 2012 Mouse Embryonic Fibroblasts (MEFs) FIP200 Jun-Lin Guan, University of Cincinnati, USA N/A HEK 293 KO ATG13 Kind gift from Dr Elise Jacquin and Dr Oliver Florey, Babraham Institute N/A HEK 293 GFP DFCP1 Axe et al, 2008 N/A HEK 293 GFP ATG13 Karanasios et al., 2013 N/A Oligonucleotides Dharmacon siGENOME siRNA smart pools: TAX1BP1 Dharmacon # L-016892-00 Dharmacon siGENOME siRNA smart pools: CIAP1 Dharmacon # L-004390-00 Dharmacon siGENOME siRNA smart pools: CIAP2 Dharmacon # L-004099-00 Dharmacon siGENOME siRNA smart pools: TRAF2 Dharmacon # L-005198-00 Dharmacon siGENOME siRNA smart pools: DNML1 Dharmacon # L-012092-00 Recombinant DNA CFP LC3 Kind gift from Tamotsu Yoshimori, Osaka University, Japan N/A mCherry-Mito This work N/A pEGFP-C1-Atg13 Addgene N/A GFP-Ub Addgene N/A mCherry-Ub This work N/A CFP-Mito This work N/A Software and Algorithms Nikon Elements (v4.60) SIM plugin (v2.3) Nikon https://www.microscope.healthcare.nikon.com/en_EU/products/software/nis-elements/nis-elements-advanced-research Olympus cellSens (v1.17) Olympus https://www.olympus-lifescience.com/en/software/cellsens/ Seahorse XF24 1.8.1 Agilent https://www.agilent.com/cs/pubimages/misc/readme-xf24-181.pdf Prism (Graphpad Software) https://www.graphpad.com/scientific-software/prism/ Zen2 (blue edition) (Carl Zeiss,file version 2.0.14283.302, Germany) Carl Zeiss https://www.zeiss.com/microscopy/int/products/microscope-software/zen-lite.html ANOVA in XLSTAT XLSTAT https://www.xlstat.com/en/ Fiji X 64 (Imaje J) https://fiji.sc/ Lead Contact and Materials Availability Further information and requests for reagents may be directed to, and will be fulfilled by, the Lead Author, Dr. Nicholas T. Ktistakis ( nicholas.ktistakis@babraham.ac.uk ).
Experimental Model and Subject Details Mouse Embryonic Fibroblasts
(MEFs, sex unknown) were generously donated by the following colleagues: ATG5 KO and ATG13 KO, Professor Noboru Mizushima; ATG3 and ATG7 KO, Professor Masaaki Komatsu; ULK1/ULK2 KO and ATG9 KO, Dr Sharon Tooze. The OPTN knockout MEFs were developed from OPTN deficient mice ( Chew et al., 2015 ) as previously described (Tumbarello et al) and immortalized with the SV40 large T-antigen ( Kuma et al., 2004 ). HEK-293 cells (sex, Female) deficient for ATG13 (kindly donated by Dr Elise Jacquin and Dr Oliver Florey) were derived as recently described ( Jacquin et al., 2017 ). HEK-293 cells stably expressing GFP-ATG13 and GFP-DFCP1 have been described before and were isolated after selection in geneticin ( Karanasios et al., 2013 ). Method Details Compounds PP242, IVM, PYR-41, and antimycin A were purchased from Sigma-Aldrich (now Merck). BX-795, oligomycin, and CCCP were purchased from Tocris Biosciences. VPS34 INH1 was a kind gift of Dr. Ian Ganley. All compounds were dissolved in DMSO as 1000X stocks and were used at these final concentrations: PP242 1μM; IVM 20 μM (in the original screen it was used at 10 μM); PYR-41 30 μM; BX-795 5 μM, CCCP 4 μM, oligomycin 10 μM, antimycin A 10 μM.
Immunofluorescence Microscopy
Protocols have been extensively described recently ( Lucocq et al., 2001 , Karanasios and Ktistakis, 2015 ). In brief, cells on coverslips were fixed in 3.7% Formaldehyde, permeabilized in 0.1% NP40 and stained in a blocking solution containing fish gelation and 0.05% NP40. Antibodies used and their final dilution are as follows: rabbit anti-OPTN (Cayman Chemicals), 1:100; mouse anti-WIPI2 (Bio-Rad), 1:200; rabbit anti-phospho(S172)TBK1 (Cell Signalling), 1:50; mouse anti-Ubiquitin FK2 (Enzo), 1:100; rabbit anti-FIP200 (ProteinTech), 1:100; rabbit anti-ATG9 (Cell Signalling), 1:100; mouse anti-TOMM20 (Abcam), 1:100; rabbit anti-ATG13 (Sigma), 1:100; rabbit anti-LC3 (Sigma), 1:150; rabbit anti-NDP52 (GeneTex), 1:100; rabbit anti-Tax1BP1 (ProteinTech), 1:100; rabbit anti-VAPA (Sigma), 1:200; rabbit anti-VAPB (Sigma), 1:200; mouse anti-EEA1 (BD Biosciences), 1:70; mouse anti-LAMP2 (Developmental Studies Hybridoma Data Bank), 1:200; mouse anti-TUBULIN (Sigma), 1:300; mouse anti-cytochrome C (Abcam), 1:200; rabbit anti-phospho(S351)p62 (kind gift from Dr Masaaki Komatsu), 1:100; rabbit anti-TRAF2 (Abcam) 1:100.
Super Resolution Microscopy A Nikon
N-SIM system was used, comprising Nikon Ti-E microscope, Nikon 1.49 N.A. objective, Andor iXon 897 EM-CCD camera, Nikon SIM illuminator, Nikon LU5A laser bed and controlled using Nikon Elements software. Raw 3D-SIM images were acquired (15 images representing 5 phases and 3 rotations at each focal plane) typically using 100 ms exposure, 5.1 conversion gain and 150 EM gain. Image stacks were acquired with a 120 nm step interval and reconstructed into super resolved images using the volumetric reconstruction algorithm in the Nikon software. Excitation/emission for the different fluorescent labels was as follows: mTurquoise 405 nm ex, 447/60 em; GFP 488 nm ex, 525/50 em; mCherry 561 nm exn 607/36 em; Alexa Fluor 647 643 nm ex, 692/40 em.
Live Imaging
Two wide-field imaging systems were used to capture images of live cells: a Nikon Ti-E-based system and an Olympus cellSens. Details of our live imaging protocols were described in Karanasios et al., 2013 , Karanasios et al., 2016 . Briefly, cells were plated onto 60 mm dishes and transiently transfected with the relevant plasmids. After 24 hr, cells were replated onto 22-mm-diameter glass coverslips and used for imaging on the following morning. Throughout live imaging, cells were maintained at 37°C in a full enclosure incubation system. The Nikon Ti-E-based system comprised a Nikon Ti-E microscope, 100x 1.4 N.A. objective (Nikon), SpecraX LED illuminator (Lumencor), 410/504/582/669-Di01 and Di01-R442/514/561 dichroic mirrors (Semrock), Hamamatsu Flash 4.0 sCMOS camera, emission filter wheel (Sutter Instruments) and was controlled using Nikon Elements software. The Olympus cellSens system comprised of Olympus IX83 microscope, 100x 1.49 N.A. objective (Olympus), pE-4000 LED illuminator (CoolLED), Hamamatsu Flash 4.0 sCMOS camera, ZT440-445/488-491-594 dichroic mirror (Chroma), Olympus filter wheels on excitation and emission paths and was controlled using Olympus cellSens software. Correlative Light and Electron Microscopy (CLEM) HEK-293 cells stably expressing GFP-ATG13 were transfected with dsRED MITO for 24 hr and were then replated onto poly lysine-coated, 35 mm gridded MatTek glass bottom dishes to reach 50% confluency on the next day. The cells were treated with 20 μM IVM for 35 min before imaging. After setting the samples on the stage of the Nikon Ti-E microscope at 37°C 5% CO2, they were imaged for an additional 20 min using a 100x 1.4 NA objective and frames were acquired every 10 sec. Before the last imaging frame, 4% paraformaldehyde in 0.2 M Hepes, pH 7.4, was added to make the final concentrations of 2% paraformaldehyde and 0.1 M M Hepes. After 10 min incubation, the fixative was replaced with 0.2M Hepes buffer to allow capturing a confocal z stack (100x 1.4 NA objective) and the grid co-ordinates were imaged by 10x10 montage bright field imaging (100x 1.4 NA objective). A second round of fixation followed in 2% glutaraldehyde (Sigma EM grade) in 0.2M Hepes (pH 7.4) for 2h. Cells were then osmicated for 1 hr at room temperature with a solution containing 1% OsO4, 0.1M CH32AsO2Na (cacodylate), pH 7.4, 15mg/ml K4[Fe(CN)6. Cells were then sequentially washed with 0.1M cacodylate buffer and water before incubating with 1% uranyl acetate at 4°C for 1 h. After extensive washes in water, samples were dehydrated stepwise in ethanol (50%, 70%, 96%, and 100%). Finally the cells were flat embedded, infiltrated in EPON resin (TAAB 812 ref. T030) for 2 h and baked at +60°C overnight (>14h). The samples were then processed for either electron tomography or conventional thin sectioning. Samples were sectioned at either 60 or 100 nm thickness and picked up on single slot grids. Samples were then stained with 0.5% uranyl acetate for 30 min and 3% lead citrate for 1 min before imaging at 80 kv on a Jeol JEM-1400 (Jeol) equipped with Gatan Orius SC 1000B bottom mounted CCD-camera (Gatan). For tomography, semi thick 230 nm sections were prepared and picked up on single slot grids. 10 nm colloidal gold particles were added to the sections to serve as fiducial markers in the tomogram alignment. Dual axis tilt series were acquired using SerialEM software ( Mastronarde, 2005 ) on a Technai FEG20 microscope (FEI, the Netherlands) at 200 kV with 11500X magnification, over a tilt range of ±62 degrees. Image correlation for correlative light-electron microscopy was done using the TrakEM2 ( Cardona et al., 2012 ) module of Fiji by transforming the fluorescent image and superimposing it on top of a low-magnification EM image of the cell of interest, using mitochondria as the main fiducial markers. Images from the 60 and 100 nm serial sections were aligned using the TrakEM2 module of Fiji, segmented using the Microscope image browser ( Belevich et al., 2016 ) and the three-dimensional models were visualized using 3D Slicer ( Fedorov et al., 2012 ). Tilt series were reconstructed into tomograms and then aligned using IMOD ( Kremer et al., 1996 ), segmented using Microscope image browser and the models visualized using 3D Slicer. Lysates and Immunoblots Cells were lysed on ice in 100-140 μL of lysis buffer [50 mM Tris pH 8.0, 50 mM KCl, 1mM EDTA pH 8.0, 1% IGEPAL, 0.6 mM PMSF, Complete Mini, EDTA-free tablet (Roche)] supplemented with 10 % 50mM NaF, 0.1% 10mg/ml leupeptin and 0.5% 0.2M Sodium orthovanadate. Lysates were collected and centrifuged for 10 min at 14,000 rpm at 4°C. The supernatant was collected in fresh tubes on ice. Protein concentration of the lysates was determined using the BCA protein assay kit (Thermo Scientific Pearce). For electrophoresis, samples were combined with 2 x Laemmli sample buffer [20mM Tris-Cl pH 6.8, 2% sodium dodecyl sulphate (SDS), 10% glycerol, 0.1M dithiolthreitol (DTT)] in a 1:1 ratio. Samples were then heated for 90 seconds at 95°C before loading. Gels were wet-transferred overnight to 0.45μm Immobilon-P transfer membranes (Millipore). Incubations with primary and secondary antibodies, and signal development using ECL (ECL Western Blotting Detection Reagent, GE Healthcare/Amersham Biosciences) followed standard protocols. For immunoblots, the following antibodies at the indicated dilutions were used: rabbit anti-ATG9 (Cell Signalling), 1:1500; rabbit anti-ATG13 (Sigma), 1:1000; rabbit anti-FIP200 (ProteinTech), 1:1000; mouse anti-GAPDH (Biogenesis), 1:100,000; mouse anti-OPTN (Santa Cruz), 1:500; rabbit anti-phospho(S172)TBK1 (Cell Signalling), 1:1000; rabbit anti-phospho(S757)ULK1 (Cell Signalling), 1:1000 rabbit anti-TAX1BP1 (homemade), 1:3000; mouse anti-TBK1 (SantaCruz), 1:500, rabbit anti-TRAF2 (Abcam) 1:1000; rabbit anti-CIAP1 (Proteintech); rabbit anti-CIAP2 (Proteintech).
Isolation of Ubiquitin-Containing Proteins After IVM Treatment
HEK-293 cells were treated with 15 μM IVM for 45 min and lysed in 0.3% CHAPS buffer containing 40 mM HEPES-Cl pH 7.4, 120 mM NaCl, 2 mM EDTA, 10 mM pyrophosphate, 10 mM glycerophosphate, 50 mM sodium fluoride, 1.5 mM sodium vanadate and one tablet EDTA-free protease inhibitors per 50 ml. At the same time, agarose beads crosslinked to anti-ubiquitin antibody FK2 (Caltag D058-8) were washed in the same lysis buffer and were added to the cleared lysates for binding at 4°C for 60 min. At the end of incubation, beads were washed 4 times with lysis buffer and once with PBS before mass spectrometry or SDS-PAGE and immunoblotting. siRNA Experiments WT and OPTN KO MEFs were seeded in 6-well plates to reach 70%–80% confluency 24 h later. Transfections were performed using TransMessenger transfection reagent kit (Qiagen) with SmartPool siRNA oligos against non-targetting and TAX1BP1 (Dharmacon) for 72 hr. Downregulation of CIAP1, CIAP2 and TRAF2 simultaneously was done as follows: Cells were plated in the morning and transfected for the first time in the afternoon with 80 pmol of each siRNA SmartPool. The cells were re-transfected two days later with the same amount of siRNA, and examined for the various assays two days later.
Oxygen Consumption Rate Measurement
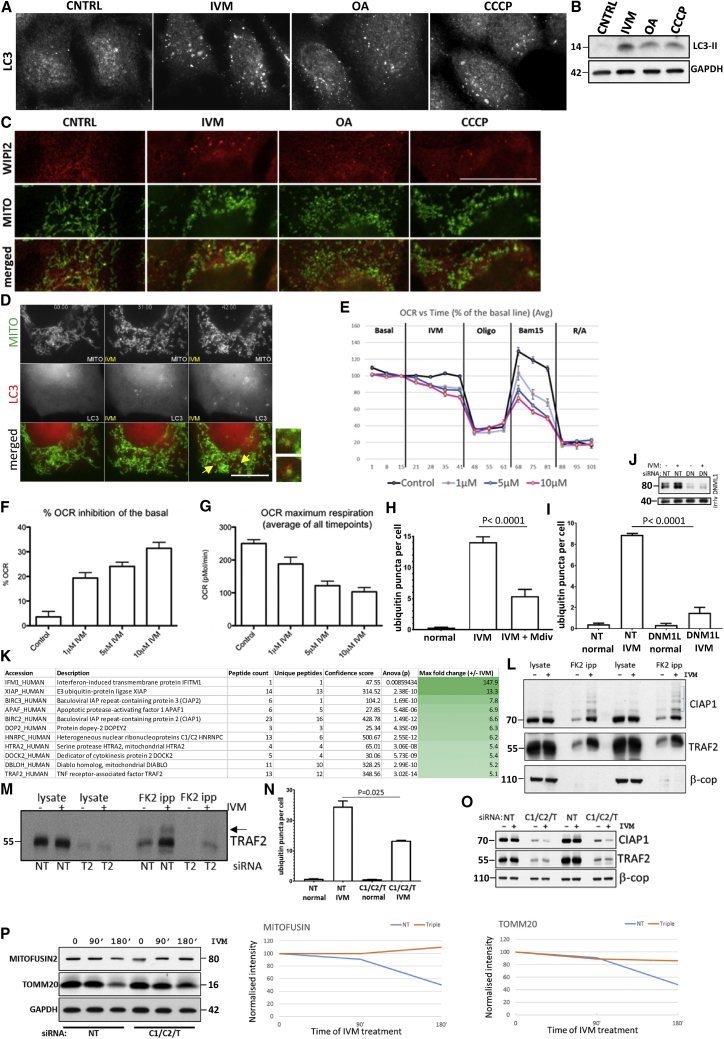
For oxygen consumption rate (OCR) determination, experiments were carried out using a Seahorse XF24 analyzer (Agilent). HEK-293 cells were plated in a 24 well Seahorse cell culture microplate in 3.5 x 10 4 cells/well density 24hrs prior to the experiment. On the day of the experiment the cells were pre-incubated in DMEM supplemented with 5-mM Glucose, 2mM Glutamine and 5mM HEPES-HCl pH 7.4, for 60 min. IVM was titrated to 1, 5 or 10μM and equivalent volume of DMSO was added in the control samples. All the conditions were in quadruplicates. OCR was measured every 6 min to determine basal respiration, ATP synthase activity and proton leak (using 1 μM Oligomycin), and non-mitochondrial respiration (using 1 μM Rotenone and 2 μM Antimycin). For determination of percentage OCR inhibition rate compared to the basal, the following equation was used: [1 – [(Last rate measurement before Oligomycin injection – non mitochondrial respiration rate)/(last measurement before IVM/DMSO injection – non mitochondrial respiration rate)]] × 100.
Quantification and Statistical Analysis General
In a single experiment, 10 images (technical repeats) were selected for each treatment condition and quantified using the ImageJ cell counter plugin. Values were then represented as puncta per cell using GraphPad Prism. Data from biological repeats were combined, log-transformed, and a two-way ANOVA was performed to obtain statistical significance and finally plotted as Mean±SD. All statistical analysis was checked by Dr Anne Segonds-Pichon, the statistician of the Babraham Institute. Note on Live Imaging The live imaging data in this manuscript are derived from over 400 videos, and what is shown has been reproducibly observed multiple times by more than one scientist.
Data and Code Availability
The published article includes all datasets generated and analyzed during this study.
Lead Contact and Materials Availability
Further information and requests for reagents may be directed to, and will be fulfilled by, the Lead Author, Dr. Nicholas T. Ktistakis ( nicholas.ktistakis@babraham.ac.uk ).
Experimental Model and Subject Details Mouse Embryonic Fibroblasts
(MEFs, sex unknown) were generously donated by the following colleagues: ATG5 KO and ATG13 KO, Professor Noboru Mizushima; ATG3 and ATG7 KO, Professor Masaaki Komatsu; ULK1/ULK2 KO and ATG9 KO, Dr Sharon Tooze. The OPTN knockout MEFs were developed from OPTN deficient mice ( Chew et al., 2015 ) as previously described (Tumbarello et al) and immortalized with the SV40 large T-antigen ( Kuma et al., 2004 ). HEK-293 cells (sex, Female) deficient for ATG13 (kindly donated by Dr Elise Jacquin and Dr Oliver Florey) were derived as recently described ( Jacquin et al., 2017 ). HEK-293 cells stably expressing GFP-ATG13 and GFP-DFCP1 have been described before and were isolated after selection in geneticin ( Karanasios et al., 2013 ).
Method Details Compounds PP242, IVM, PYR-41, and antimycin A were purchased from Sigma-Aldrich (now Merck). BX-795, oligomycin, and CCCP were purchased from Tocris Biosciences. VPS34 INH1 was a kind gift of Dr. Ian Ganley. All compounds were dissolved in DMSO as 1000X stocks and were used at these final concentrations: PP242 1μM; IVM 20 μM (in the original screen it was used at 10 μM); PYR-41 30 μM; BX-795 5 μM, CCCP 4 μM, oligomycin 10 μM, antimycin A 10 μM.
Immunofluorescence Microscopy
Protocols have been extensively described recently ( Lucocq et al., 2001 , Karanasios and Ktistakis, 2015 ). In brief, cells on coverslips were fixed in 3.7% Formaldehyde, permeabilized in 0.1% NP40 and stained in a blocking solution containing fish gelation and 0.05% NP40. Antibodies used and their final dilution are as follows: rabbit anti-OPTN (Cayman Chemicals), 1:100; mouse anti-WIPI2 (Bio-Rad), 1:200; rabbit anti-phospho(S172)TBK1 (Cell Signalling), 1:50; mouse anti-Ubiquitin FK2 (Enzo), 1:100; rabbit anti-FIP200 (ProteinTech), 1:100; rabbit anti-ATG9 (Cell Signalling), 1:100; mouse anti-TOMM20 (Abcam), 1:100; rabbit anti-ATG13 (Sigma), 1:100; rabbit anti-LC3 (Sigma), 1:150; rabbit anti-NDP52 (GeneTex), 1:100; rabbit anti-Tax1BP1 (ProteinTech), 1:100; rabbit anti-VAPA (Sigma), 1:200; rabbit anti-VAPB (Sigma), 1:200; mouse anti-EEA1 (BD Biosciences), 1:70; mouse anti-LAMP2 (Developmental Studies Hybridoma Data Bank), 1:200; mouse anti-TUBULIN (Sigma), 1:300; mouse anti-cytochrome C (Abcam), 1:200; rabbit anti-phospho(S351)p62 (kind gift from Dr Masaaki Komatsu), 1:100; rabbit anti-TRAF2 (Abcam) 1:100.
Super Resolution Microscopy A Nikon
N-SIM system was used, comprising Nikon Ti-E microscope, Nikon 1.49 N.A. objective, Andor iXon 897 EM-CCD camera, Nikon SIM illuminator, Nikon LU5A laser bed and controlled using Nikon Elements software. Raw 3D-SIM images were acquired (15 images representing 5 phases and 3 rotations at each focal plane) typically using 100 ms exposure, 5.1 conversion gain and 150 EM gain. Image stacks were acquired with a 120 nm step interval and reconstructed into super resolved images using the volumetric reconstruction algorithm in the Nikon software. Excitation/emission for the different fluorescent labels was as follows: mTurquoise 405 nm ex, 447/60 em; GFP 488 nm ex, 525/50 em; mCherry 561 nm exn 607/36 em; Alexa Fluor 647 643 nm ex, 692/40 em.
Live Imaging
Two wide-field imaging systems were used to capture images of live cells: a Nikon Ti-E-based system and an Olympus cellSens. Details of our live imaging protocols were described in Karanasios et al., 2013 , Karanasios et al., 2016 . Briefly, cells were plated onto 60 mm dishes and transiently transfected with the relevant plasmids. After 24 hr, cells were replated onto 22-mm-diameter glass coverslips and used for imaging on the following morning. Throughout live imaging, cells were maintained at 37°C in a full enclosure incubation system. The Nikon Ti-E-based system comprised a Nikon Ti-E microscope, 100x 1.4 N.A. objective (Nikon), SpecraX LED illuminator (Lumencor), 410/504/582/669-Di01 and Di01-R442/514/561 dichroic mirrors (Semrock), Hamamatsu Flash 4.0 sCMOS camera, emission filter wheel (Sutter Instruments) and was controlled using Nikon Elements software. The Olympus cellSens system comprised of Olympus IX83 microscope, 100x 1.49 N.A. objective (Olympus), pE-4000 LED illuminator (CoolLED), Hamamatsu Flash 4.0 sCMOS camera, ZT440-445/488-491-594 dichroic mirror (Chroma), Olympus filter wheels on excitation and emission paths and was controlled using Olympus cellSens software. Correlative Light and Electron Microscopy (CLEM) HEK-293 cells stably expressing GFP-ATG13 were transfected with dsRED MITO for 24 hr and were then replated onto poly lysine-coated, 35 mm gridded MatTek glass bottom dishes to reach 50% confluency on the next day. The cells were treated with 20 μM IVM for 35 min before imaging. After setting the samples on the stage of the Nikon Ti-E microscope at 37°C 5% CO2, they were imaged for an additional 20 min using a 100x 1.4 NA objective and frames were acquired every 10 sec. Before the last imaging frame, 4% paraformaldehyde in 0.2 M Hepes, pH 7.4, was added to make the final concentrations of 2% paraformaldehyde and 0.1 M M Hepes. After 10 min incubation, the fixative was replaced with 0.2M Hepes buffer to allow capturing a confocal z stack (100x 1.4 NA objective) and the grid co-ordinates were imaged by 10x10 montage bright field imaging (100x 1.4 NA objective). A second round of fixation followed in 2% glutaraldehyde (Sigma EM grade) in 0.2M Hepes (pH 7.4) for 2h. Cells were then osmicated for 1 hr at room temperature with a solution containing 1% OsO4, 0.1M CH32AsO2Na (cacodylate), pH 7.4, 15mg/ml K4[Fe(CN)6. Cells were then sequentially washed with 0.1M cacodylate buffer and water before incubating with 1% uranyl acetate at 4°C for 1 h. After extensive washes in water, samples were dehydrated stepwise in ethanol (50%, 70%, 96%, and 100%). Finally the cells were flat embedded, infiltrated in EPON resin (TAAB 812 ref. T030) for 2 h and baked at +60°C overnight (>14h). The samples were then processed for either electron tomography or conventional thin sectioning. Samples were sectioned at either 60 or 100 nm thickness and picked up on single slot grids. Samples were then stained with 0.5% uranyl acetate for 30 min and 3% lead citrate for 1 min before imaging at 80 kv on a Jeol JEM-1400 (Jeol) equipped with Gatan Orius SC 1000B bottom mounted CCD-camera (Gatan). For tomography, semi thick 230 nm sections were prepared and picked up on single slot grids. 10 nm colloidal gold particles were added to the sections to serve as fiducial markers in the tomogram alignment. Dual axis tilt series were acquired using SerialEM software ( Mastronarde, 2005 ) on a Technai FEG20 microscope (FEI, the Netherlands) at 200 kV with 11500X magnification, over a tilt range of ±62 degrees. Image correlation for correlative light-electron microscopy was done using the TrakEM2 ( Cardona et al., 2012 ) module of Fiji by transforming the fluorescent image and superimposing it on top of a low-magnification EM image of the cell of interest, using mitochondria as the main fiducial markers. Images from the 60 and 100 nm serial sections were aligned using the TrakEM2 module of Fiji, segmented using the Microscope image browser ( Belevich et al., 2016 ) and the three-dimensional models were visualized using 3D Slicer ( Fedorov et al., 2012 ). Tilt series were reconstructed into tomograms and then aligned using IMOD ( Kremer et al., 1996 ), segmented using Microscope image browser and the models visualized using 3D Slicer. Lysates and Immunoblots Cells were lysed on ice in 100-140 μL of lysis buffer [50 mM Tris pH 8.0, 50 mM KCl, 1mM EDTA pH 8.0, 1% IGEPAL, 0.6 mM PMSF, Complete Mini, EDTA-free tablet (Roche)] supplemented with 10 % 50mM NaF, 0.1% 10mg/ml leupeptin and 0.5% 0.2M Sodium orthovanadate. Lysates were collected and centrifuged for 10 min at 14,000 rpm at 4°C. The supernatant was collected in fresh tubes on ice. Protein concentration of the lysates was determined using the BCA protein assay kit (Thermo Scientific Pearce). For electrophoresis, samples were combined with 2 x Laemmli sample buffer [20mM Tris-Cl pH 6.8, 2% sodium dodecyl sulphate (SDS), 10% glycerol, 0.1M dithiolthreitol (DTT)] in a 1:1 ratio. Samples were then heated for 90 seconds at 95°C before loading. Gels were wet-transferred overnight to 0.45μm Immobilon-P transfer membranes (Millipore). Incubations with primary and secondary antibodies, and signal development using ECL (ECL Western Blotting Detection Reagent, GE Healthcare/Amersham Biosciences) followed standard protocols. For immunoblots, the following antibodies at the indicated dilutions were used: rabbit anti-ATG9 (Cell Signalling), 1:1500; rabbit anti-ATG13 (Sigma), 1:1000; rabbit anti-FIP200 (ProteinTech), 1:1000; mouse anti-GAPDH (Biogenesis), 1:100,000; mouse anti-OPTN (Santa Cruz), 1:500; rabbit anti-phospho(S172)TBK1 (Cell Signalling), 1:1000; rabbit anti-phospho(S757)ULK1 (Cell Signalling), 1:1000 rabbit anti-TAX1BP1 (homemade), 1:3000; mouse anti-TBK1 (SantaCruz), 1:500, rabbit anti-TRAF2 (Abcam) 1:1000; rabbit anti-CIAP1 (Proteintech); rabbit anti-CIAP2 (Proteintech).
Isolation of Ubiquitin-Containing Proteins After IVM Treatment
HEK-293 cells were treated with 15 μM IVM for 45 min and lysed in 0.3% CHAPS buffer containing 40 mM HEPES-Cl pH 7.4, 120 mM NaCl, 2 mM EDTA, 10 mM pyrophosphate, 10 mM glycerophosphate, 50 mM sodium fluoride, 1.5 mM sodium vanadate and one tablet EDTA-free protease inhibitors per 50 ml. At the same time, agarose beads crosslinked to anti-ubiquitin antibody FK2 (Caltag D058-8) were washed in the same lysis buffer and were added to the cleared lysates for binding at 4°C for 60 min. At the end of incubation, beads were washed 4 times with lysis buffer and once with PBS before mass spectrometry or SDS-PAGE and immunoblotting. siRNA Experiments WT and OPTN KO MEFs were seeded in 6-well plates to reach 70%–80% confluency 24 h later. Transfections were performed using TransMessenger transfection reagent kit (Qiagen) with SmartPool siRNA oligos against non-targetting and TAX1BP1 (Dharmacon) for 72 hr. Downregulation of CIAP1, CIAP2 and TRAF2 simultaneously was done as follows: Cells were plated in the morning and transfected for the first time in the afternoon with 80 pmol of each siRNA SmartPool. The cells were re-transfected two days later with the same amount of siRNA, and examined for the various assays two days later.
Oxygen Consumption Rate Measurement
For oxygen consumption rate (OCR) determination, experiments were carried out using a Seahorse XF24 analyzer (Agilent). HEK-293 cells were plated in a 24 well Seahorse cell culture microplate in 3.5 x 10 4 cells/well density 24hrs prior to the experiment. On the day of the experiment the cells were pre-incubated in DMEM supplemented with 5-mM Glucose, 2mM Glutamine and 5mM HEPES-HCl pH 7.4, for 60 min. IVM was titrated to 1, 5 or 10μM and equivalent volume of DMSO was added in the control samples. All the conditions were in quadruplicates. OCR was measured every 6 min to determine basal respiration, ATP synthase activity and proton leak (using 1 μM Oligomycin), and non-mitochondrial respiration (using 1 μM Rotenone and 2 μM Antimycin). For determination of percentage OCR inhibition rate compared to the basal, the following equation was used: [1 – [(Last rate measurement before Oligomycin injection – non mitochondrial respiration rate)/(last measurement before IVM/DMSO injection – non mitochondrial respiration rate)]] × 100.
Supplemental Information Document S1. Figures S1–S7 Document S2. Article plus Supplemental Information
📊 Figures
Figureu00a01
Inducers of Mitophagy in Mammalian Cells and IVM Action (Au2013C) HEK293 cells treated for 2u00a0h with 15u00a0u03bcM IVM, for 8u00a0h with 10u00a0u03bcM oligomycin and 10u00a0u03bcM antimycin A (OA),...
Figureu00a02
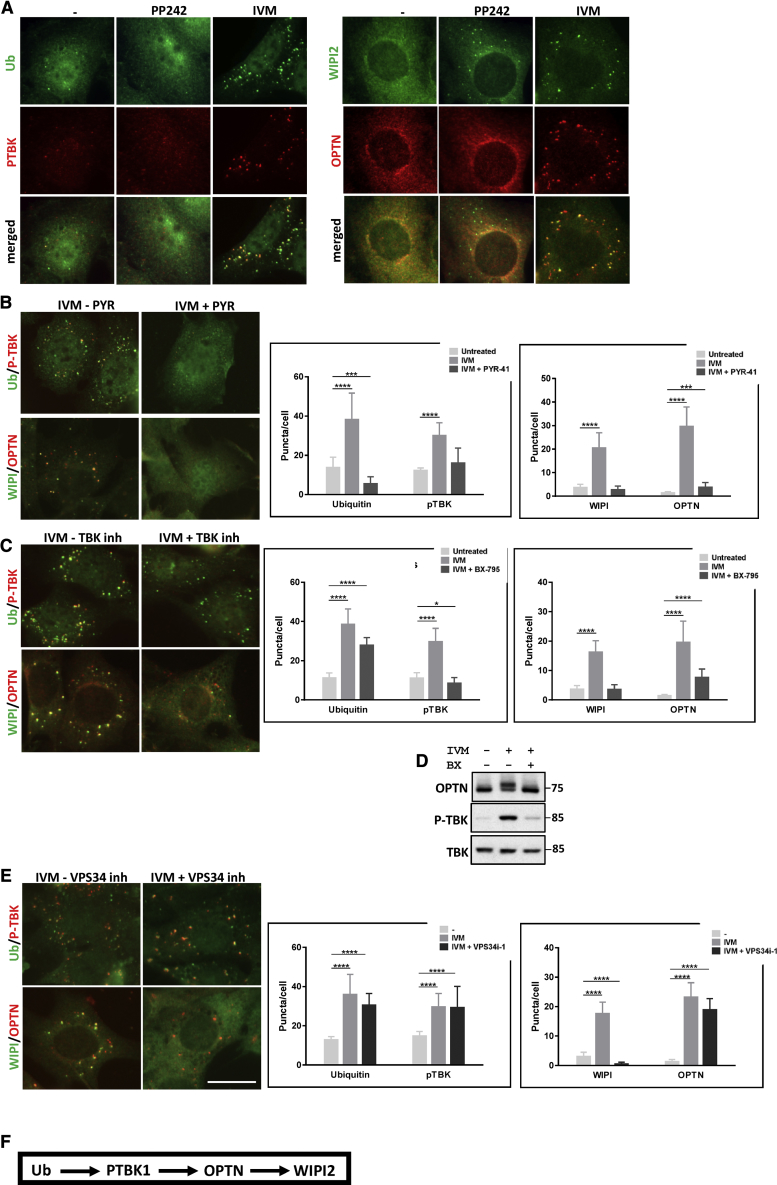
Response of Mitophagy Components to IVM in MEFs and Hierarchy of Steps (A) MEFs treated for 90u00a0min with 15u00a0u03bcM IVM or with 1u00a0u03bcM PP242 and immunolabeled for ubiquitin and P-TBK1 (lef...
Figureu00a03
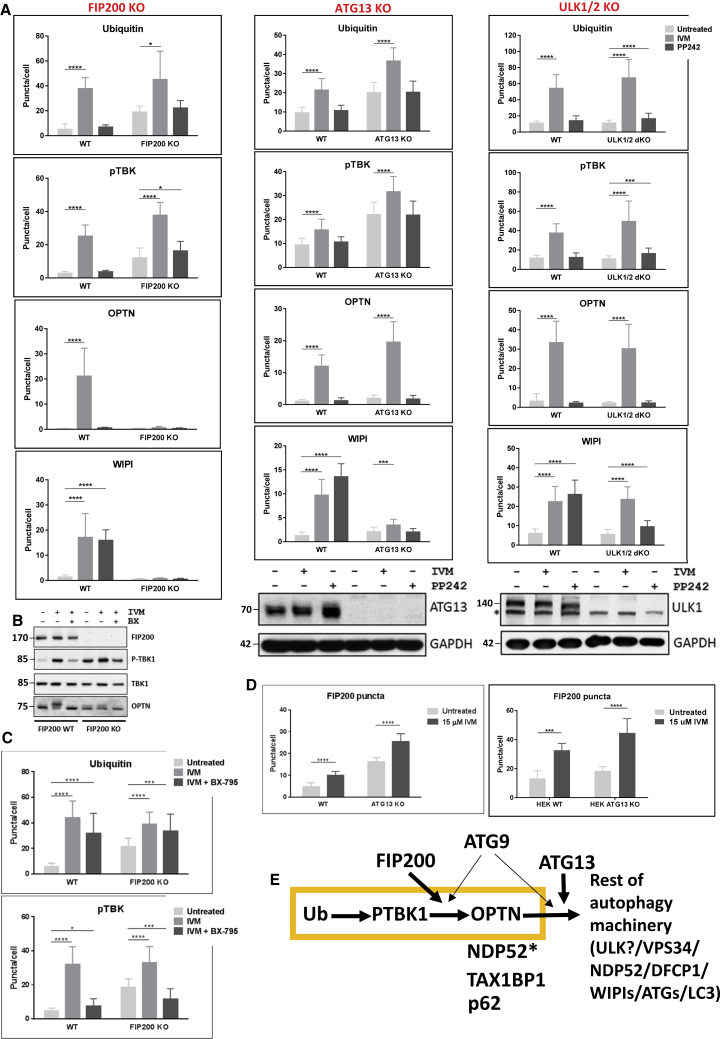
Requirement of Autophagy Proteins FIP200, ATG13, and ULK1/2 in IVM-Induced Mitophagy (A) Wild-type MEFs or matched FIP200 KO (left column graphs), ATG13 KO (middle column graphs), or ULK1/2 KO (right ...
Figureu00a04
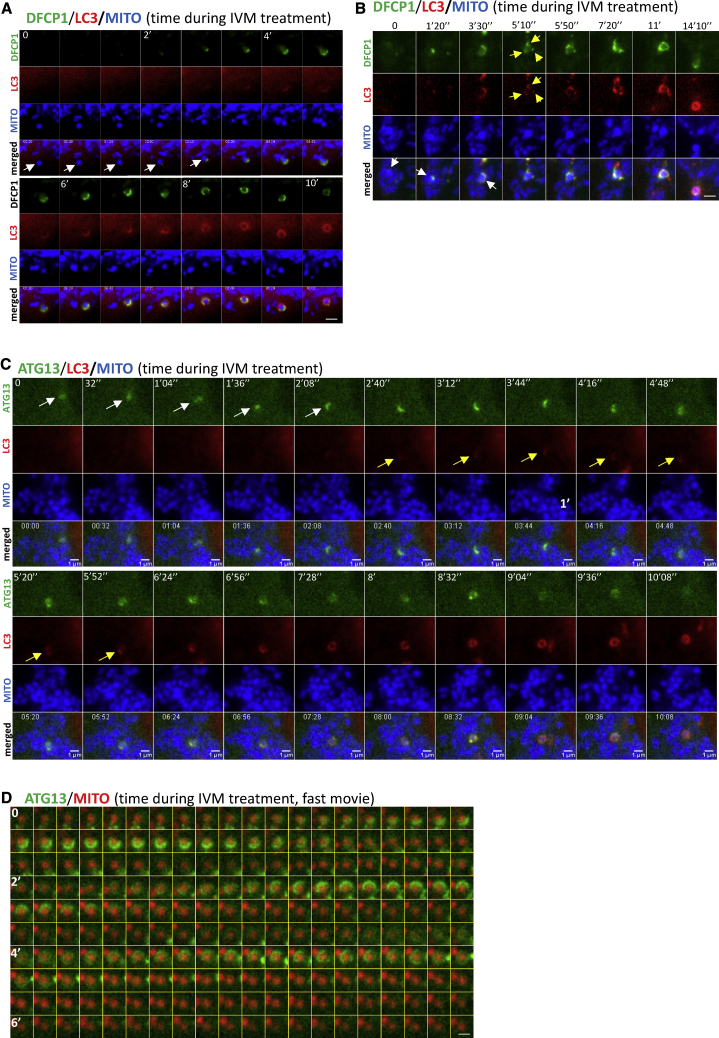
Dynamics of Omegasomes and ATG13 during Mitophagy (A) Live-cell imaging of HEK293 cells expressing GFP-DFCP1, CFP-LC3, and mCherry-MITO, treated with IVM. A mitochondrial fragment is engulfed by DFCP1...
Figureu00a05
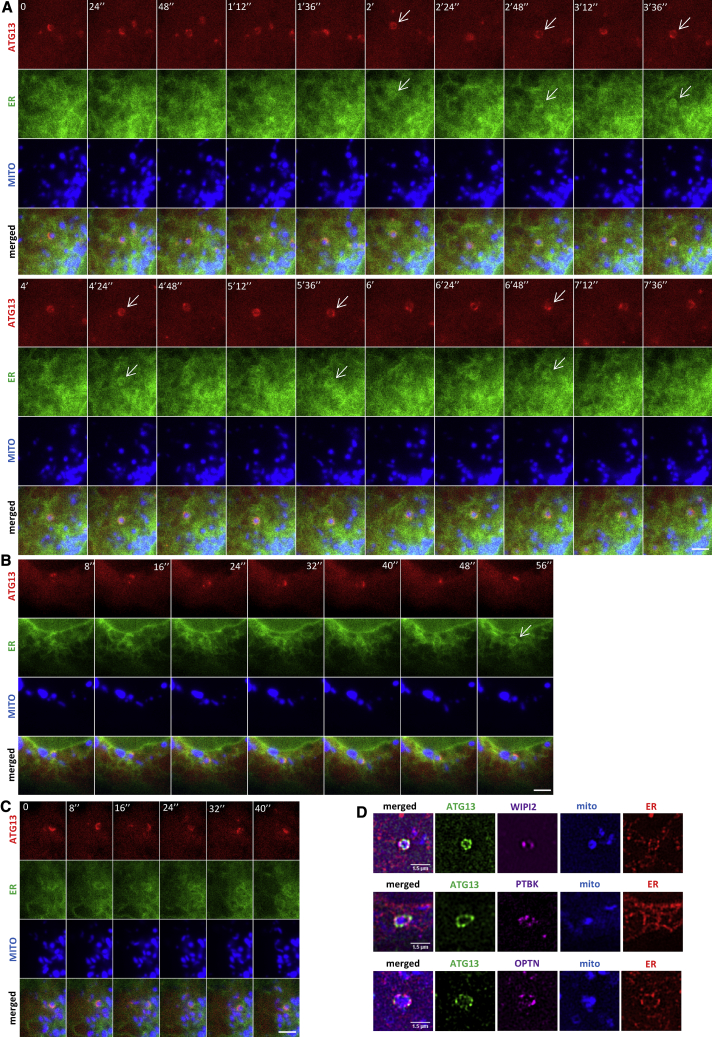
The ER during Mitophagy (A) Imaging of HEK293 cells expressing GFP-ATG13, CFP-ER, and mCherry-MITO, treated with IVM. Arrows point to instances where ATG13 and ER coincide. Whole sequence in Video S6 ...
Figureu00a06
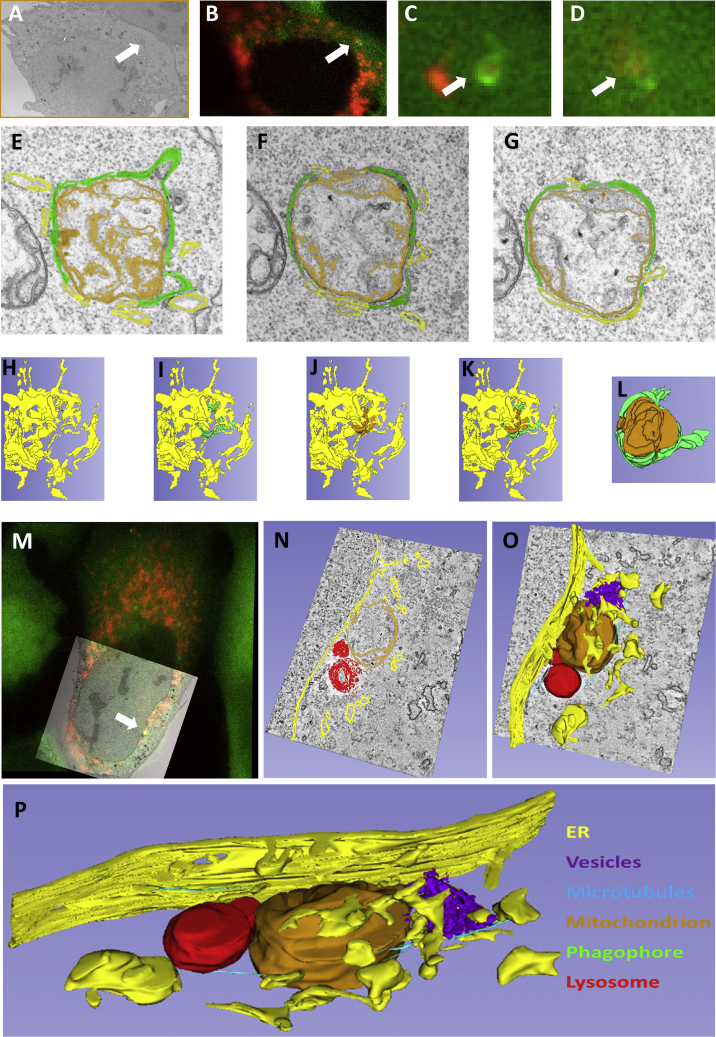
Ultrastructure of the Forming Phagophore during Mitophagy by Correlative Light-Electron Microscopy Two examples are shown (Au2013L and Mu2013P) with the color code for all images indicated in (P). (A)...
Figureu00a07
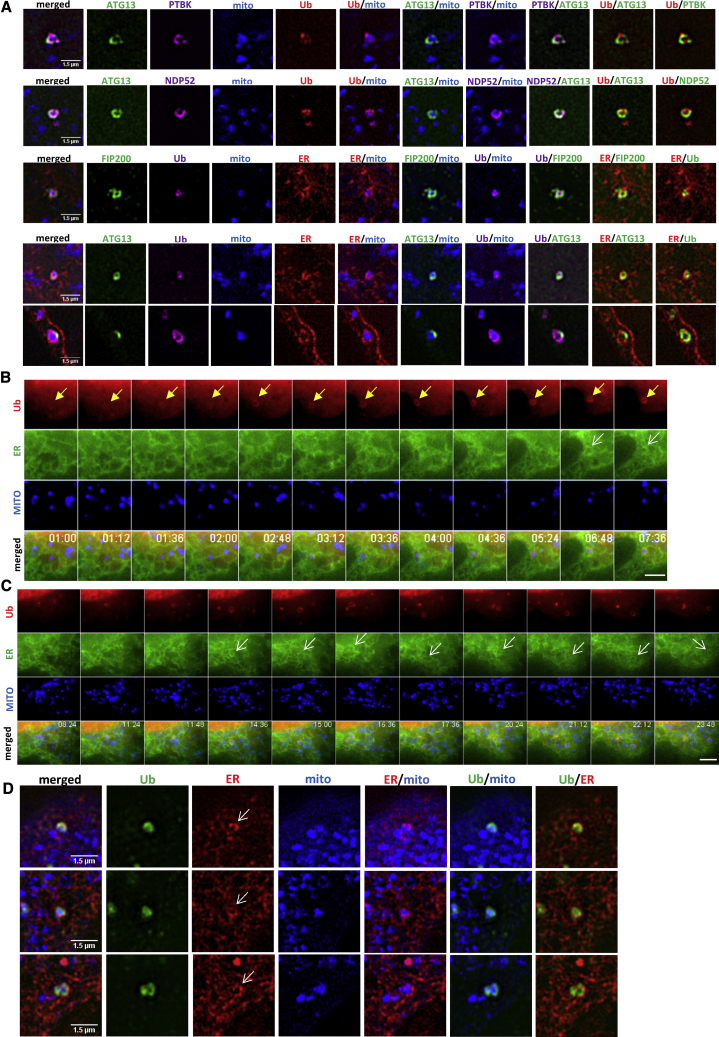
Ubiquitinated Mitochondria Associate with the ER during Mitophagy (A) Four-color SIM images of mitochondrial fragments (blue) during IVM-induced mitophagy with ATG13 or FIP200 (green), mitophagy adapt...
Figure images are served from the NIH/NLM PubMed Central Open Access Subset or Europe PMC; copyright remains with the publishers and authors.
💬 Discussion
0 commentsNo comments yet. Be the first to start a discussion!
Leave a Comment