Abstract
Abstract Although StayGold is a bright and highly photostable fluorescent protein, its propensity for obligate dimer formation may hinder applications in molecular fusion and membrane targeting. To attain monovalent as well as bright and photostable labeling, we engineered tandem dimers of StayGold to promote dispersibility. On the basis of the crystal structure of this fluorescent protein, we disrupted the dimerization to generate a monomeric variant that offers improved photostability and brightness compared to StayGold. We applied the new monovalent StayGold tools to live-cell imaging experiments using spinning-disk laser-scanning confocal microscopy or structured illumination microscopy. We achieved cell-wide, high-spatiotemporal resolution and sustained imaging of dynamic subcellular events, including the targeting of endogenous condensin I to mitotic chromosomes, the movement of the Golgi apparatus and its membranous derivatives along microtubule networks, the distribution of cortical filamentous actin and the remolding of cristae membranes within mobile mitochondria.
🔬 Techniques
🔭 Microscopes
🧬 Organisms
💻 Software
✨ Fluorophores
🧪 Sample Preparation
🔬 Cell Lines
🏭 Microscope Brands
🧪 Reagent Suppliers
📷 Detectors
🎨 Filters
💻 Software Details
💾 Data Repositories
🏛️ Research Organizations (ROR)
Affiliated research institutions:
📋 Methods
Protein purification
Recombinant proteins with a polyhistidine tag at the N terminus were expressed in Escherichia coli (JM109 (DE3)). Transformed E. coli were incubated in a Luria–Bertani (LB) medium containing 0.1 mg ml −1 ampicillin at room temperature (RT) with gentle shaking for several days. Protein purification by Ni 2+ affinity chromatography was performed as described previously 47 . In vitro spectroscopy Absorption spectra were acquired using a spectrophotometer (U-2910, Hitachi). Fluorescence excitation and emission spectra were acquired using a fluorescence spectrophotometer (F-2500, Hitachi). Absolute fluorescence quantum yields were measured using an absolute photoluminescence quantum yield spectrometer (C9920-02, Hamamatsu Photonics). The solution for spectroscopy contained 50 mM HEPES (KOH), pH 7.4, and 150 mM KCl. Protein concentrations were measured using a Protein Assay Dye Reagent Concentrate kit (5000006, Bio-Rad) with bovine serum albumin (BSA) as the standard. pH titrations Measurement was performed at RT (25 °C) immediately after pH adjustment. Fluorescence was measured at the protein concentration of 200 nM using an F-2500 fluorescence spectrophotometer (Hitachi). The following buffers were used to adjust pH: pH 3, 50 mM glycine-HCl buffer pH 4–5, 100 mM CH 3 COONa-CH 3 COOH buffer pH 6, 100 mM MES (NaOH) buffer pH 7–8, 100 mM HEPES (NaOH) buffer pH 9–10, 100 mM glycine-NaOH buffer pH 11, 100 mM Na 2 HPO 4 -NaOH buffer See Supplementary Fig. 11 .
Pseudonative SDS–PAGE analysis
Non-heated protein samples were separated on 10% polyacrylamide gels as described previously 48 . The gel on a UV–VIS transilluminator was photographed by iPad through a filter for GFP observation. Photoshop CS5 v.12.1 was used to crop the original photo. Gene construction for bicistronic expression in mammalian cells The T2A 49 gene was synthesized with 5′- Hin dIII and 3′- Eco RI sites and the restricted product was cloned into the Hin dIII/ Eco RI sites of pBlueScript (pBS) to generate pBS/T2A. The mCherry gene was amplified using primers containing 5′- Xho I and 3′- Hin dIII sites and the restricted product was cloned in frame into the Xho I/ Hin dIII sites of pBS/T2A to generate pBS/mCherry-T2A. The green-emitting FP (EGFP, mGreenLantern, StayGold, td5StayGold, td5oxStayGold, td8oxStayGold, td8ox2StayGold, QC2-6 FIQ or QC2-6(PT)) gene was amplified using primers containing 5′- Bam HI and 3′- Xba I sites and the restricted product was cloned in frame into the Bam HI/ Xba I sites of pBS/mCherry-T2A to generate pBS/mCherry-T2A-green-emitting FP. Last, Xho I/ Xba I fragments encoding mCherry-T2A-green-emitting FP were subcloned into pCSII-EF to generate pCSII-EF/mCherry-T2A-green-emitting FP plasmids.
Show full methods section
Protein purification
Recombinant proteins with a polyhistidine tag at the N terminus were expressed in Escherichia coli (JM109 (DE3)). Transformed E. coli were incubated in a Luria–Bertani (LB) medium containing 0.1 mg ml −1 ampicillin at room temperature (RT) with gentle shaking for several days. Protein purification by Ni 2+ affinity chromatography was performed as described previously 47 . In vitro spectroscopy Absorption spectra were acquired using a spectrophotometer (U-2910, Hitachi). Fluorescence excitation and emission spectra were acquired using a fluorescence spectrophotometer (F-2500, Hitachi). Absolute fluorescence quantum yields were measured using an absolute photoluminescence quantum yield spectrometer (C9920-02, Hamamatsu Photonics). The solution for spectroscopy contained 50 mM HEPES (KOH), pH 7.4, and 150 mM KCl. Protein concentrations were measured using a Protein Assay Dye Reagent Concentrate kit (5000006, Bio-Rad) with bovine serum albumin (BSA) as the standard. pH titrations Measurement was performed at RT (25 °C) immediately after pH adjustment. Fluorescence was measured at the protein concentration of 200 nM using an F-2500 fluorescence spectrophotometer (Hitachi). The following buffers were used to adjust pH: pH 3, 50 mM glycine-HCl buffer pH 4–5, 100 mM CH 3 COONa-CH 3 COOH buffer pH 6, 100 mM MES (NaOH) buffer pH 7–8, 100 mM HEPES (NaOH) buffer pH 9–10, 100 mM glycine-NaOH buffer pH 11, 100 mM Na 2 HPO 4 -NaOH buffer See Supplementary Fig. 11 .
Pseudonative SDS–PAGE analysis
Non-heated protein samples were separated on 10% polyacrylamide gels as described previously 48 . The gel on a UV–VIS transilluminator was photographed by iPad through a filter for GFP observation. Photoshop CS5 v.12.1 was used to crop the original photo. Gene construction for bicistronic expression in mammalian cells The T2A 49 gene was synthesized with 5′- Hin dIII and 3′- Eco RI sites and the restricted product was cloned into the Hin dIII/ Eco RI sites of pBlueScript (pBS) to generate pBS/T2A. The mCherry gene was amplified using primers containing 5′- Xho I and 3′- Hin dIII sites and the restricted product was cloned in frame into the Xho I/ Hin dIII sites of pBS/T2A to generate pBS/mCherry-T2A. The green-emitting FP (EGFP, mGreenLantern, StayGold, td5StayGold, td5oxStayGold, td8oxStayGold, td8ox2StayGold, QC2-6 FIQ or QC2-6(PT)) gene was amplified using primers containing 5′- Bam HI and 3′- Xba I sites and the restricted product was cloned in frame into the Bam HI/ Xba I sites of pBS/mCherry-T2A to generate pBS/mCherry-T2A-green-emitting FP. Last, Xho I/ Xba I fragments encoding mCherry-T2A-green-emitting FP were subcloned into pCSII-EF to generate pCSII-EF/mCherry-T2A-green-emitting FP plasmids.
Cellular brightness assay
HeLa cells were seeded into 24-well glass-bottom plates (5826-024, IWAKI) and maintained in growth medium (Dulbecco’s modified Eagle medium (DMEM) low glucose, supplemented with 10% fetal bovine serum (FBS)). On the following day, cells were transfected with 0.5 μg pCSII-EF/mCherry-T2A green-emitting FP per well using 1 µl Lipofectamine 2000 (52887, Thermo Fisher). Forty-eight hours after transfection, cells were imaged on an inverted microscope (IX-83, Evident) equipped with an LED light bulb (X-Cite XYLIS, Excelitas Technologies), an objective lens (UPlanXApo ×4/0.16 NA, Evident) and a scientific CMOS camera (ORCA-Fusion, Hamamatsu Photonics). Green-emitting FPs were observed using a filter cube (U-FBNA, Evident), which is composed of an excitation filter (470–495 nm), a dichroic mirror (505LP) and an emission filter (510–550 nm). Thus, the central wavelength of the excitation passband was approximately 483 nm. mCherry was observed using a filter cube (U-FMCHE, Evident), which is composed of an excitation filter (565–585 nm), a dichroic mirror (595LP) and an emission filter (600–690 nm). The green-emitting FP fluorescence was corrected for the mCherry fluorescence and spectral throughput (Supplementary Fig. 7 ). The value was normalized to that of StayGold (Supplementary Table 2 and Fig. 3b ).
FP maturation in mammalian cells
HeLa cells were seeded into six-well plates (353046, CORNING) and maintained in growth medium (DMEM low glucose, supplemented with 10% FBS). On the following day, cells were transfected with 1 µg pCSII-EF/mCherry-T2A-green-emitting FP per well using 2 µl Lipofectamine 2000 (52887, Thermo Fisher). After a 1-h incubation with the transfection complexes, the medium was replaced with fresh phenol-red-free DMEM (044-33555, Fuji Film) supplemented with 10% FBS and GlutaMax (35050061, Thermo Fisher). One hour after the removal of the transfection complexes, cells were subjected to long-term, time-lapse imaging using a fully automated imaging system (SARTORIUS, Incucyte SX5) that was maintained at 37 °C in a 5% CO 2 environment in an incubator (Thermo Fisher, Forma Steri-Cycle i250). Fluorescence and phase-contrast images (four images per well per channel) were acquired every 30 min using a ×10 objective lens and the G/O/NIR Filter Set. Green-emitting FPs were observed using the G channel (excitation, 453–485 nm; emission, 494–533 nm). mCherry was observed using the O channel (excitation, 546–568 nm; emission, 576–639 nm). FP signals were defined as pixels having signal values exceeding five times the s.d. above the mean fluorescence intensity of the first images. Because the fluorescence development of most of the green-emitting FPs preceded that of mCherry, the green:red ratios increased abruptly in the early phase. Therefore, each signal of a green-emitting FP was divided by the respective mCherry signal at 48 h. Last, the ratio value was corrected for the spectral throughputs of the green-emitting FPs (Supplementary Fig. 8 and Fig. 3c ).
FP maturation in bacterial cells
A homemade fluorescence analyzing system consisting of a Xenon light source MAX-302 (Asahi Spectra), an excitation filter (465–495 nm) (480AF30, Omega Optical), an emission filter (530–550 nm) (PB0540/020, Asahi Spectra) and a sCMOS camera ZYLA-5.5-USB3 (Andor) was used for time-lapse imaging of transformed E. coli colonies that expressed SG, mSG or mSG2. The whole system was controlled by MetaMorph software (Molecular Devices). Multiple colonies were made for each FP by spotting 1.5-μl drops of transformed competent JM109(DE3) cell suspension on an LB agar plate with 100 µg ml −1 ampicillin. After a 2-h incubation at 37 °C, the plate was placed in a stage-top incubation chamber (Tokai Hit) kept at 37 °C and time-lapse imaging was immediately started (Supplementary Fig. 9a ). To evaluate the oxygen-dependent chromophore maturation, bacterial colonies on LB agar plates with 100 µg ml −1 ampicillin were grown in an anaerobic 2.5-l rectangular jar (Mitsubishi Gas Chemical) with an O 2 -absorbing agent AnaeroPack (Mitsubishi Gas Chemical) overnight at 37 °C. Immediately after exposure to air, time-lapse imaging was started on a 37 °C preheated plate (Tokai Hit) (Supplementary Fig. 9b and Supplementary Video 1 ). Images were analyzed using ImageJ (National Institutes of Health). The green-emitting FP fluorescence was corrected for the spectral throughput (Supplementary Fig. 9c ). Spectral throughput calculation For the calculation of relative excitation efficiency (Ex.), the ratio of the excitation intensity relative to the maximum was averaged in the bandpass. Relative emission detection efficiency (Em.) was calculated as the ratio of the emission passing the bandpass relative to the entire integrated emission (Supplementary Figs. 7 – 9c ).
OSER assay
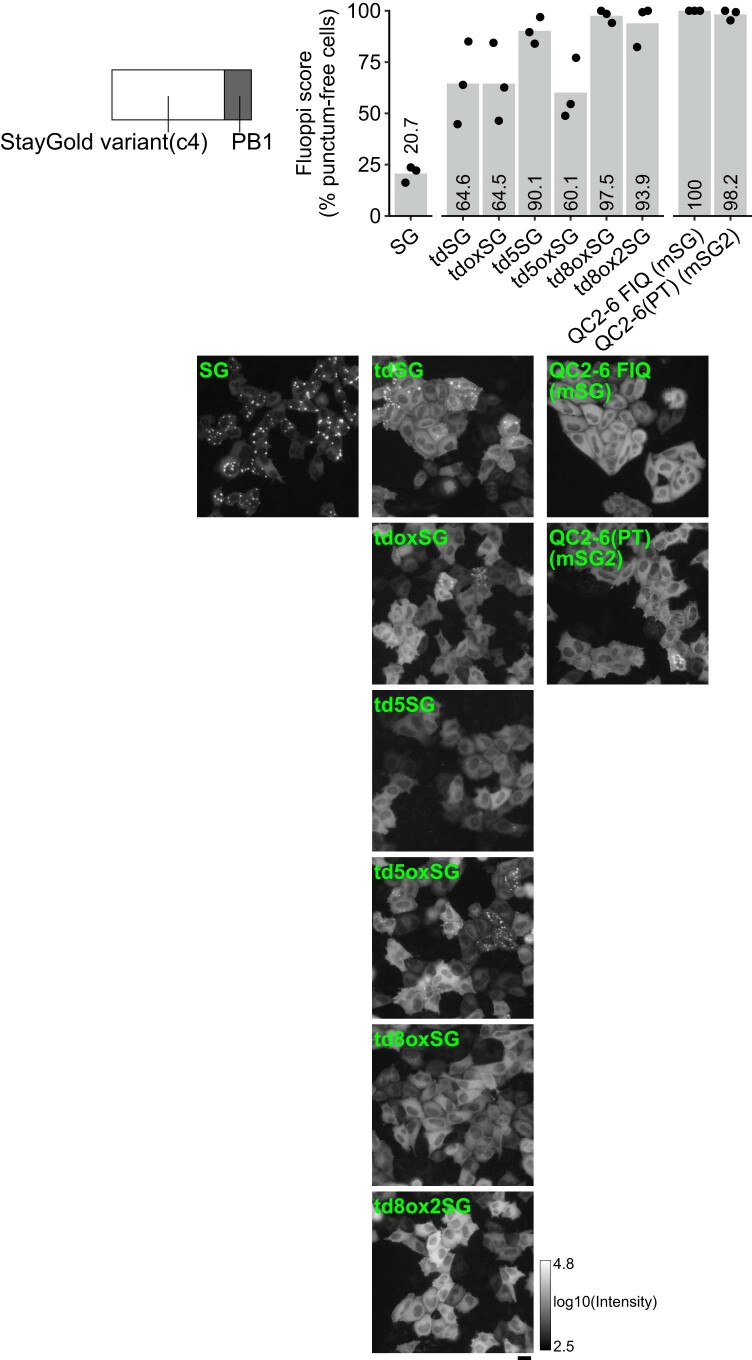
The cDNA fragment encoding CytERM 4 was synthesized according to the sequence information of Emerald-CytERM-N-17 (Addgene, #56290) with 5′- Hin dIII and 3′- Bam HI sites. As the CytERM gene has Bam HI, Eco RI and Hin dIII sites internally, all these sites were eliminated in the synthesis. The FP gene was amplified using primers containing 5′- Bam HI and 3′- Xho I sites. The restricted products were cloned into the Hin dIII/ Xho I sites of pcDNA3 to generate pcDNA3/CytERM-FP. Twenty hours after transfection, HeLa cells on a standard 35-mm glass-bottom dish were incubated in Hanks’ Balanced Salt Solution (HBSS; 14025, Thermo Fisher Scientific) containing 15 mM HEPES-NaOH (pH 7.4) and imaged on an inverted microscope (IX-83, Evident) equipped with a ×20 objective lens (UPlanXApo ×20/0.8 NA, Evident) and a camera (ORCA-Fusion, Hamamatsu Photonics). At an xy position, nine images were serially acquired with a z step size of 0.59 µm, from which an in-focus image was mathematically generated by the extended focus imaging function of the cellSens Dimension (Evident) software (v.3.2). A logarithmic transformation was applied to all image data that had a wide range of fluorescence intensity distributions. The number of transfected cells showing whorl structures was counted. In addition, the number of transfected cells avoiding whorl formation was counted. Three independent experiments were carried out for each construct (Extended Data Fig. 1 ). Fluoppi assay The FP gene was amplified using primers containing 5′- Bam HI and 3′- Eco RI sites and the restricted product was cloned into the Bam HI/ Eco RI sites of pAsh-MCL (Medical Biological Laboratory) to generate a plasmid DNA for expression of PB1-FP. Also, the FP gene was amplified using primers containing 5′- Bam HI and 3′- Xho I sites and the restricted product was cloned into the Bam HI/ Xho I sites of pAsh-MNL (Medical Biological Laboratory) to generate plasmid DNA for expression of FP-PB1. Twenty-four hours after transfection, HeLa cells on a standard 35-mm glass-bottom dish or a 24-well glass-bottom plate (5826-024, IWAKI) were incubated in HBSS (14025, Thermo Fisher Scientific) containing 10 mM HEPES-NaOH (pH 7.4) and imaged on an inverted microscope (IX-83, Evident) equipped with a ×20 objective lens (UPlanXApo ×20/0.8 NA, Evident) and a camera (ORCA-Fusion, Hamamatsu Photonics). The mirror units used for imaging green-, yellow- and red-emitting FPs were U-FBNA, U-FYFP and U-FGNA (Evident), respectively. A logarithmic transformation was applied to all image data that had a wide range of fluorescence intensity distributions (Extended Data Figs. 2 and 5 ).
Expression and purification for crystallography
StayGold, in a pET-47b(+) vector (Novagen) carrying ampicillin resistance and an HRV 3C-cleavable N-terminal polyhistidine tag, was expressed in E. coli (BL21(DE3)). Transformed E. coli was incubated at 25 °C in an LB medium containing 20 μg ml −1 kanamycin with gentle shaking (63 r.p.m.) for 5 d. Protein purification by Co 2+ affinity chromatography was performed using TALON resins (Clontech). Cleavage of the polyhistidine tag was performed during dialysis into 50 mM Tris-HCl (pH 7.5), 0.3 M NaCl and 1 mM dithiothreitol using HRV 3 C protease at 4 °C overnight. The sample was loaded onto TALON resins and the unbound fraction was applied to a HiPrep 16/60 Sephacryl S300 HR column (cytiva) equilibrated with 20 mM HEPES-NaOH (pH 7.5) and 0.15 M NaCl for preparative separation of StayGold. Finally, the untagged product was concentrated to 8.3 mg ml −1 using Amicon Ultra (3,000 MW cutoff) (Merck).
Crystallization and X-ray data collection
Crystals of StayGold were grown at 20 °C using the sitting-drop vapor diffusion method by mixing 0.1 μl protein solution (8.3 mg ml −1 in 20 mM HEPES-NaOH (pH 7.5) and 0.15 M NaCl) with 0.1 μl reservoir solution I (25% (w/v) PEG3350, 0.2 M MgCl 2 and 0.1 M Tris-HCl, pH 8.5) or reservoir solution II (20% (w/v) PEG4000, 20% (v/v) 2-propanol and 0.1 M sodium citrate, pH 5.6). The mixture was sealed over a well containing 50 μl reservoir I or reservoir II solution, respectively. Individual crystals were soaked in 1 ml reservoir I or reservoir II solution containing 250 mg trehalose, scooped using a nylon loop and flush-cooled in liquid nitrogen. The diffraction data were collected at 100 K using the BL26B2 beam line at the SPring-8 and were processed using the DIALS program 50 .
Structure determination and refinement
The structure of StayGold was determined by the molecular replacement technique with a model of GFP (PDB, 2Q57 ) as a search model using phenix.phaser 51 . The model was refined using phenix.refine 52 and repeatedly corrected using Coot 53 . Refinement statistics of structures are summarized in Supplementary Table 1 . Structural figures were prepared using PyMOL. Gene construction (nuclear targeting) The mouse H2B gene (Fantom3) was amplified using primers containing 5′- Xho I and 3′- Hin dIII sites and the restricted product was cloned into the Xho I/ Hin dIII sites of pBS Coupler 1 (ref. 54 ) to generate pBS Coupler 1/H2B. In addition, the green-emitting FP (EGFP, mEGFP, mClover3, mNeonGreen, mGreenLantern, StayGold, tdStayGold, td5StayGold, td5oxStayGold, td8oxStayGold, td8ox2StayGold, QC2-6 FIQ or QC2-6(PT)) gene was amplified using primers containing 5′- Bam HI and 3′- Xba I sites and the restricted product was cloned in frame into the Bam HI/ Xba I sites of pBS Coupler 1/H2B=FP. Last, Xho I/ Xba I fragments encoding H2B=FPs were subcloned into pCSII-EF for transfection. WF photobleaching Living cells on 35-mm glass-bottom dishes were incubated in HBSS containing 15 mM HEPES-NaOH (pH 7.4) and imaged on an inverted microscope (IX-83, Evident) equipped with an LED light bulb (X-Cite XYLIS, Excelitas Technologies), a ×60 objective lens (UPlanSApo ×60/1.35 NA) and a scientific CMOS camera (ORCA-Fusion, Hamamatsu Photonics). The data were analyzed using Excel (2019). The fluorescence intensity at t = 0 was normalized to 1,000 photons s −1 per molecule and the time axis was adjusted according to the standard method 15 . The power of excitation light (W) above the objective at the focal plane was measured using a microscope slide power meter sensor (S170C; Thorlabs) and an optical power and energy meter (PM100D; Thorlabs). The power was divided by the area of the illumination field (cm 2 ) to obtain the irradiance. In all cases of WF microscopy, the illuminator (collimator lens) was adjusted to achieve Köhler illumination. A color acrylic plate (Tokyu Hands) was placed at the focal plane to evaluate illumination uniformity on a CCD (CMOS) image (Fig. 2 and Supplementary Fig. 6 ). WF photobleaching with high irradiances Living cells on 35-mm glass-bottom dishes were incubated in HBSS containing 15 mM HEPES-NaOH (pH 7.4) and imaged on an inverted microscope (Eclipse Ti-E, Nikon) equipped with a 200-mW 491-nm laser (Calypso, Cobolt), ×100 objective lens (CFI Apo TIRF ×100/1.49 NA) and a high-speed CMOS camera (based on SA-1, Photron) coupled to an image intensifier (V8070U-74, Hamamatsu) by an optical-fiber bundle 42 . To perform image acquisitions within the full-well capacity of the CMOS sensor, the camera was operated at frame rates of 60, 250, 1,000, 3,000 and 10,000 frames s −1 at illumination intensities of 10, 30, 100, 300 and 1,000 W cm −2 , respectively. The excitation laser illuminated a circular (two-dimensional Gaussian) area with a 28.5-µm radius (standard deviation) on the sample plane. Since only the central part of the illumination area was used for imaging and the intensity was reduced by less than 11% from the center to the horizontal/vertical side end of the field of view (27.1 × 27.1 µm), the irradiance was obtained by the laser density at the center (= P /2πσ 2 ) based on the laser power measured after the objective lens ( P ) and the standard deviation of the Gaussian profile (σ) 55 . See Extended Data Fig. 10 . Single-beam LSCM photobleaching Living cells on 35-mm glass-bottom dishes were incubated in HBSS (14025076, Thermo Fisher Scientific) and imaged using an inverted LSCM system (FV3000; Evident) equipped with a ×40 objective lens (UPlanSApo ×40/0.95 NA). Green-emitting FPs were excited by a 488-nm diode laser and fluorescence was detected within the wavelength range of 500–600 nm. The power of excitation light (W) above the objective at the focal plane was measured using a microscope slide power meter sensor (S170C; Thorlabs) and an optical power and energy meter (PM100D; Thorlabs). The power was divided by the area of the scanned field (cm 2 ) to obtain the irradiance (Supplementary Fig. 19 and Supplementary Note 6 ).
Fluorescence lifetime measurements
HeLa cells were transfected with 0.5 µg of pcDNA3/mStayGold, pcDNA3/mStayGold2 or pCSII/StayGold using 1 µl Lipofectamine 2000 (52887, Thermo Fisher). Two days after transfection, the medium was exchanged with HBSS, 14025, Thermo Fisher Scientific) containing 15 mM HEPES-NaOH (pH 7.4). Cells were imaged on an inverted laser-scanning confocal microscope (TCS SP8 STED ONE, Leica Microsystems) equipped with a ×20 objective lens (HC PL APO CS2 ×20/0.75 DRY, Leica). The FPs were excited at 488 nm by a white light laser (frequency, 80 MHz) and the emitted fluorescence (510–600 nm) was detected with the HyD SMD4 detector. The lifetime was analyzed using LAS X FLIM/FCS software, v.3.5.5 (Leica Microsystems). Gene construction for genome editing pMT690-2 is a plasmid that contains a 1,231-bp genomic fragment around the termination codon of NCAPH 56 . A series of ‘cassette constructs’ encoding FP tags plus selection markers 57 were provided by M.T. Kanemaki at the National Institute of Genetics in Mishima, Japan. They can be used for generating FP knock-in cells at the C-terminal end of any protein of interest via homology-directed repair. Among the constructs, pMK281 (mCherry2-Hygro) and pMK278 (mClover3-Hygro) were selected in the present study. Also, the mCherry2 gene in pMK281 was replaced with the td5oxStayGold gene to generate a new cassette construct, pMT892 (td5oxStayGold-Hygro). The td5oxStayGold-Hygro and mClover3-Hygro cassette genes were amplified using pMK892 and pMT278 as templates and the PCR products were inserted in frame via Gibson assembly (NEB) at a site immediately upstream of the termination codon of NCAPH in pMT690-2 to generate pMT897 and pMT899, respectively. In both constructs, the C terminus of CAP-H was linked to FP via a linker amino acid tract GSGAAS. Genome-edited cell lines pMT691, a derivative of pX330 (Addgene plasmid #42230), can be used for cleaving the genome with Cas9 near the termination codon of NCAPH 56 . HCT116 cells were co-transfected with pMT691 and pMT897 using FuGene HD (Promega) and were then cultured in the presence of 100 μg ml −1 hygromycin B (Nacalai Tesque) for selection of cell clones in which CAP-H was endogenously tagged at the C terminus with td5oxStayGold. Single cell colonies growing normally and exhibiting green fluorescence in the cytoplasm in interphase cells and on chromosomes in mitotic phase cells were picked up. Among them was a cell clone designated as #897, which was further characterized for the tagging (CAP-H-td5oxStayGold). Likewise, cotransfection of HCT116 cells with pMT691 and pMT899 resulted in the generation of a cell line #899 carrying CAP-H-mClover3. Cells were cultured at 37 °C with 5% CO 2 in DMEM supplemented with 10% FBS.
Validation of FP integration in knock-in cell lines
First, junction PCR was performed using a forward primer 5′ outside of the left homology arm (P758, 5′-GTTAATCTCTTACTGTGCCT-3′) and a reverse primer 3′ outside of the right homology arm (P759, 5′-TCTCTTCCATTCTCCTCCGA-3′). Second, western blotting analysis was performed using a rabbit polyclonal anti-CAP-H antibody (Proteintech, 11515-1-AP, 1:1,000 dilution) and a mouse monoclonal anti-β-actin antibody (Sigma-Aldrich, A1978 clone AC-15, 1:5,000 dilution). Photoshop v.22.5.8 was used to crop original pictures and for contrast adjustment (Supplementary Fig. 15a,b ). Gene construction (Golgi targeting) The td5StayGold(c4) gene was amplified using primers containing 5′- Kpn I and 3′- Eco RI sites. The restricted product was substituted for the StayGold(c4) gene in pcDNA3/StayGold(c4)-20aa-Giantin 1 , which is identical to pcDNA3/StayGold(c4)=GianCreg. GianCreg is a C-terminal domain that contains amino acids 3,131–3,259 of human giantin. The resultant plasmid was pcDNA3/td5StayGold(c4)=GianCreg. Gene construction (N-terminal targeting of β-tubulin) The td8ox2StayGold(c4) gene was amplified using primers containing 5′- Bam HI and 3′- Eco RI sites. Also, the β-tubulin gene was amplified using primers containing 5′- Hin dIII and 3′- Xho I sites. The two restricted products were sequentially cloned into the Bam HI/ Eco RI and Hin dIII/ Xho I sites of pBS Coupler 4 (ref. 54 ). Finally, the Bam HI/ Xho I fragment was cloned into pcDNA3 to generate pcDNA3/td8ox2StayGold(c4)=β-tubulin. The mStayGold(c4) gene was amplified using primers containing 5′- Bam HI and 3′- Eco RI sites. The restricted product was cloned into the Bam HI/ Eco RI sites of pBS Coupler 4 (ref. 54 ). Also, the β-tubulin gene was cloned into the Hin dIII/ Xho I sites. Finally, the Bam HI/ Xho I fragment was cloned into pcDNA3 to generate pcDNA3/mStayGold(c4)=β-tubulin. Gene construction (C-terminal targeting of β-tubulin) The mStayGold gene was amplified using primers containing 5′- Hin dIII and 3′- Xho I sites and the β-tubulin gene was amplified using primers containing 5′- Not I and 3′- Spe I sites. The two restricted products were sequentially cloned into the Hin dIII/ Xho I and Not I/ Spe I sites of pBS Coupler 4 (ref. 54 ). The resultant plasmid provided a Not I/ Xho I fragment, which was cloned into pcDNA3 to generate pcDNA3/β-tubulin=mStayGold. Stable transformants Replication-defective, self-inactivating lentiviral vectors were used 1 . The pCSII-EF-MCS vector encoding td5StayGold(c4)=GianCreg or COX8a=mStayGold was co-transfected with the packaging plasmid (pCAG-HIVgp) and the VSV-G-/Rev-expressing plasmid (pCMV-VSV-G-RSV-Rev) into 293T cells. High-titer viral solutions were prepared and used for transduction into HeLa cells (multiplicity of infection of 1–10). Most (>95%) of the resultant cells uniformly exhibited green fluorescence and were used as stable transformants.
Immunocytochemistry of the Golgi apparatus
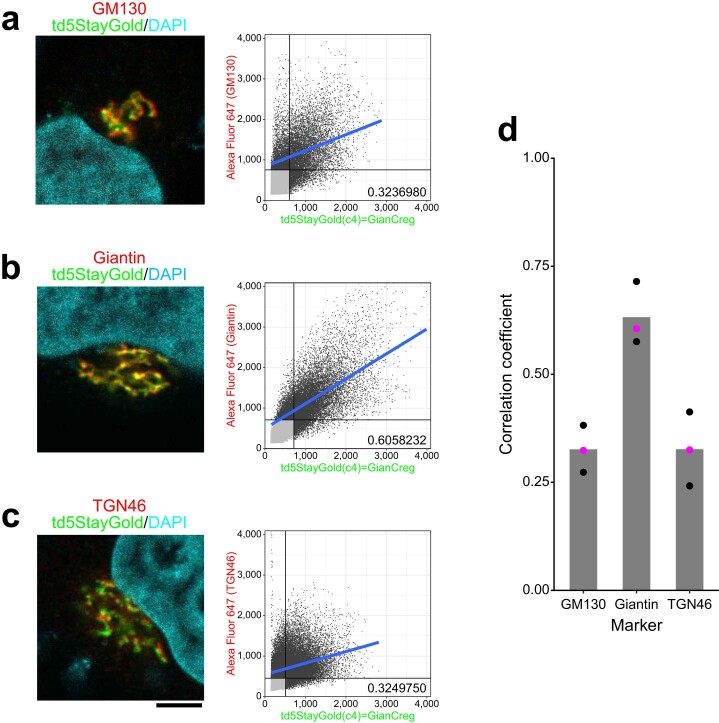
After being washed in phosphate-buffered saline (PBS) three times, cells stably expressing td5StayGold(c4)=GianCreg were chemically fixed (see below) and then incubated in blocking solution (PBS containing 3% BSA and 0.1% Triton X-100) for 60 min at RT. The cells were then reacted with primary antibodies (Abs) in blocking solution at RT for 60 min. After being washed in PBS-T (PBS containing 0.1% Triton X-100) three times, the cells were reacted with secondary Abs in blocking solution at RT for 60 min. After the cells were washed in PBS-T three times, nuclear staining was performed using DAPI (Fuji Film, 340-07971, 1:1,000 dilution) at RT in PBS for 5 min. The fixation conditions and used Abs are as follows. Fixation: 4% paraformaldehyde (PFA)/PBS at RT for 5 min. Primary Ab: anti-GM130 Ab (MBL, PM061), 1:250 dilution. Secondary Ab: donkey anti-rabbit IgG (H + L) highly cross-adsorbed secondary Ab, Alexa Fluor 647-conjugated (Thermo Fisher, A-31573), 1:500 dilution. Fixation: 4% PFA/PBS at RT for 5 min. Primary Ab: anti-giantin Ab (PROTEINTECH, 22270-1-AP), 1:250 dilution. Secondary Ab: donkey anti-rabbit IgG (H + L) highly cross-adsorbed secondary Ab, Alexa Fluor 647-conjugated (Thermo Fisher, A-31573), 1:500 dilution. Fixation: 4% PFA + 0.05% glutaraldehyde/PBS at RT for 5 min. Primary Ab: anti-TGN46 Ab (Sigma-Aldrich, SAB4200355), 1:100 dilution. Secondary Ab: donkey anti-mouse IgG (H + L) highly cross-adsorbed secondary Ab, Alexa Fluor 647-conjugated (Thermo Fisher, A-31571), 1:500 dilution. Cell samples were imaged using an inverted LSCM system (FV3000, Evident) equipped with a ×60 water objective lens (UPlanSApo ×60/1.2 NA). The size of the confocal aperture was 1 Airy disk. For a zoom factor of 4× and a pixel array size of 512 × 512, the size of each pixel was calculated to be 0.104 μm. Confocal images were acquired every 0.52 μm along the z axis to create z stacks (25–27 slices) that covered the entire Golgi apparatus. td5StayGold, Alexa 647 and DAPI were excited at 488 nm, 640 nm and 405 nm, respectively, using a dichroic mirror (DM405/488/561/640). Their fluorescence signals were acquired sequentially in each scanning line. A scatter-plot was generated between td5StayGold(c4)=GianCreg and GM130, giantin or TGN46 in each z slice and the plots across the z range were merged. On the basis of the Otsu method 58 , threshold values were automatically optimized for the fluorescence of td5StayGold and Alexa Fluor 647 using Fiji ( fiji.sc ). After exclusion of data points below the thresholds in both colors and data points showing signal saturation, colocalization was quantified by correlation analysis. The Pearson correlation coefficient ( r ) was determined using R ( www.r-project.org ). Three independent experiments (different immunostaining experiments) were carried out for each combination (Extended Data Fig. 7 ). Cytochemistry of the Golgi apparatus HeLa cells were fixed 2 d after transfection with cDNA of td5StayGold(c4)=GianCreg. Cell samples were imaged using an inverted LSCM system (FV3000, Evident) equipped with a ×60 water objective lens (UPlanSApo ×60/1.2 NA). The size of the confocal aperture was 1 Airy disk. For a zoom factor of 1× and a pixel array size of 2,048 × 2,048, the size of each pixel was calculated to be 0.104 μm. Confocal images were acquired every 1.0 μm along the z axis to create z stacks (20 slices) that covered the entire Golgi apparatus. td5StayGold and DAPI were excited at 488 and 405 nm, respectively, using a dichroic mirror (DM405/488/561/640) (Fig. 5a ). Colocalization of Lifeact-mStayGold and F-tractin-mScarlet-I Vero cells were co-transfected with the two plasmids. Cells were imaged live using an inverted LSCM system (TCS SP8, Leica) equipped with a ×93 objective lens (HC PL APO ×93/1.30 GLYC motCORR objective lens). The pinhole size was 132 nm (back-projected size) and the size of each pixel was calculated to be 30 nm (Supplementary Fig. 17 ). Gene construction (inner mitochondrial membrane targeting) The mouse COX8a cDNA was amplified using primers containing 5′- Bam HI and 3′- Eco RI sites and the restricted product was cloned into the Bam HI/ Eco RI sites of pBS Coupler 4 (ref. 54 ) to generate pBS Coupler 4/COX8a. The mStayGold gene was amplified using primers containing 5′- Hin dIII and 3v- Xho I sites and the restricted product was cloned in frame into the Hin dIII/ Xho I sites of pBS Coupler 4/COX8a to generate pBS Coupler 4/COX8a=mStayGold. Last, the BamH I/ Xho I fragment encoding COX8a=mStayGold was subcloned into pcDNA3 for transfection. Gene construction (F-actin targeting, F-tractin) The rat F-tractin cDNA that corresponds to an N-terminal domain consisting of 41 amino acids was amplified using primers containing 5′- Kpn I and 3′- Xho I sites and the restricted product was cloned into the Kpn I/ Xho I sites of pBS Coupler 1 (ref. 54 ) to generate pBS Coupler 1/F-tractin. The mStayGold gene was amplified using primers containing 5′- Bam HI and 3′- Not I sites and the restricted product was cloned in frame into the Bam HI/ Not I sites of pBS Coupler 1/F-tractin to generate pBS Coupler 1/F-tractin=mStayGold. Last, the Kpn I/ Not I fragment encoding F-tractin=mStayGold was subcloned into pcDNA3 for transfection. Gene construction (F-actin targeting, utrophin) The human utrophin cDNA that corresponds to an N-terminal domain consisting of 261 amino acids was amplified using primers containing 5′- Bam HI and 3′- Not I sites and the restricted product was cloned into the Bam HI/ Not I sites of pBS Coupler 1 (ref. 54 ) to generate pBS Coupler 1/UtrCH. The mStayGold(c4) gene was amplified using primers containing 5′- Kpn I and 3′- Xho I sites and the restricted product was cloned in frame into the Kpn I/ Xho I sites of pBS Coupler 1/UtrCH to generate pBS Coupler 1/mStayGold(c4)=UtrCH. Last, the Kpn I/ Not I fragment encoding mStayGold(c4)=UtrCH was subcloned into pcDNA3 for transfection. Gene construction (F-actin targeting, Lifeact) The mStayGold gene was amplified using primers containing 5′- Bam HI and 3′- Not I sites and the restricted product was substituted for the mCherry gene at the Bam HI/ Not I sites of mCherry-Lifeact-7 (#54491, Addgene).
Lattice SIM for live imaging Super-resolution 3D
SIM images were acquired continuously on a ZEISS Elyra 7 equipped with a PlanApo ×63/1.46 NA oil immersion objective at 37 °C. The Leap mode for lattice SIM was used to increase the temporal resolution of volumetric imaging. Image analysis was carried out with ZEN 2014 (v.9.1) (Fig. 5c , Supplementary Fig. 16 and Supplementary Video 9 ). SpinSR10 Living cells on 35-mm glass-bottom dishes in HBSS containing 15 mM HEPES-NaOH (pH 7.4) were imaged using a SpinSR10 imaging system (Evident) built on an Evident inverted microscope (IX83P2ZF) equipped with an ORCA-Flash 4.0 V3 camera (Hamamatsu Photonics), a motorized stage (IX3-SSU) and a ×100 oil objective lens (UPLAPO ×100 OHR, NA 1.50). With the SoRa spinning disk, the optical resolution in an xy plane at 488 nm excitation is approximately 160 nm. The total magnification of the system was considered to determine the best sampling interval of the camera (pixel binning). Spinning-disk super-resolution microscopy A ×3.2 magnification changer was used for observing the Golgi apparatus (Fig. 5b and Supplementary Videos 5 and 6 ), cytoskeletons (Extended Data Fig. 8 , Supplementary Fig. 18 and Supplementary Videos 7 and 8 ) and IMM (Extended Data Fig. 9 , Supplementary Fig. 20a and Supplementary Videos 10 – 12 ). Among these, the following figures and videos were processed with deconvolution using a commercial algorithm ‘Olympus Super Resolution’ to achieve super-resolution imaging (Extended Data Figs. 8 and 9 ; Supplementary Figs. 18 and 20b–d and Supplementary Videos 7 , 8 and 10 – 12 ). Spinning-disk laser-scanning confocal microscopy The ×3.2 magnification changer was not used for confocal imaging of condensin I (Fig. 4 , Extended Data Fig. 6 and Supplementary Videos 2 – 4 ). When single-plane images were acquired rapidly, the autofocus function of a z -drift compensator (IX3-ZDC2, Evident) was set continuously active. Image acquisition and analysis were carried out using the Evident cellSens software (v.3.1.1).
Analysis of rapid motion of IMM structures
Normalized cross-correlation was calculated between n and n + 1 images in individual pixels. The calculation was performed using a customized program (Extended Data Fig. 9 ). Reporting summary Further information on research design is available in the Nature Portfolio Reporting Summary linked to this article.
Online content Any methods, additional references, Nature Portfolio reporting summaries, source data, extended data, supplementary information, acknowledgements, peer review information; details of author contributions and competing interests; and statements of data and code availability are available at 10.1038/s41592-023-02085-6.
Supplementary information Supplementary Information Supplementary Notes 1–8, Figs. 1–20, Tables 1–3, Video Captions 1–12 and References. Reporting Summary Supplementary Video 1 Visualizing the oxygen-dependent development of fluorescence from colonies of JM109(DE3) cells expressing mSG, mSG2 or SG, which were fully grown under a strict anaerobic condition on the agar plate . See Supplementary Fig. 9b . Supplementary Video 2 Visualization of chromosome targeting of td5oxStayGold-tagged condensin I at low copy number expressed via a genome-editing technique . After release from cell cycle arrest, genome-edited HCT116 cells (#897) were imaged for CAP-H-td5oxStayGold (at 488 nm excitation) and SiR-DNA-labeled chromosomes (at 637 nm excitation) using spinning-disk LSCM (SpinSR10) at the indicated times (hour: min). Every 1 min, 3D scanning was executed with a z -step size of 1 µm over an axial range of 13 µm, and the green and far-red fluorescence images were merged. MIP images are shown. This video (6.20 MB) has been generated via considerable compression of the original large-volume video data (1.52 GB). Compression was made using TMPGEnc. See Fig. 4 . Shown is a representative of n = 3 independent experiments. Supplementary Video 3 High-speed visualization of chromosome targeting of td5oxStayGold-tagged condensin I in genome-edited HCT116 cells . After release from cell cycle arrest, genome-edited HCT116 cells (#897) were imaged at a single z position for observing CAP-H-td5oxStayGold (488 nm excitation) and for SiR-DNA-labeled chromosomes (637 nm excitation) by spinning-disk LSCM (SpinSR10) at one frame s −1 . Merged images at the indicated times (min: s). This video (9.05 MB) has been generated via considerable compression of the original large-volume video data (7.03 GB). Compression was made using FFmpeg. See Extended Data Fig. 6a . Supplementary Video 4 Photostability comparison between CAP-H-mClover3 and CAP-H-td5oxStayGold under the same optical conditions . Genome-edited HCT116 cells (#899, left versus #897, right) during prometaphase were volume ( z step, 0.25 µm; z range, 2.5 µm) imaged by spinning-disk LSCM (SpinSR10) with excitation at 488 nm continuously every 6.9 s over a total period of 278 s. MIP images are shown. This video (1.40 MB) has been generated via considerable compression of the original large-volume video data (12.4 MB). Compression was made using TMPGEnc. Elapsed times (min: s). See Extended Data Fig. 6b . Supplementary Video 5 Visualization of td5StayGold-harboring Golgi membranes . Volumetric and continuous imaging of HeLa cells expressing td5StayGold(c4)=GianCreg in two independent experiments (top and bottom). Cells were volume ( z step, 0.5 µm; z range, 2.5 µm) imaged by SDSRM (SpinSR10) continuously with an exposure time of 100 ms without using the z -drift compensator (IX3-ZDC2, Evident). MIP images are shown. This video (9.88 MB) has been generated via considerable compression of the original large-volume video data (122 MB). Compression was made using TMPGEnc. Elapsed times (min: s). See Fig. 5b . Supplementary Video 6 Visualization of the Golgi apparatus and microtubule network . A COS-7 cell expressing td5StayGold(c4)=GianCreg and td8ox2StayGold(c4)=β-tubulin was volume ( z step, 0.5 µm; z range, 1.5 µm) imaged by SDSRM (SpinSR10) continuously with an exposure time of 200 ms without using the z -drift compensator (IX3-ZDC2, Evident). MIP images are shown. This video (9.43 MB) has been generated via considerable compression of the original large-volume video data (100 MB). Compression was made using TMPGEnc. Elapsed times (min: s). Supplementary Video 7 Visualizing F-actin dynamics by continuous, sustainable, cell-wide imaging . COS-7 cells expressing F-tractin=mStayGold (left) or mStayGold(c4)=UtrCH by imaged by SDSRM (SpinSR10) at a single z position at 3.18 frames s −1 for 5.24 min. Elapsed times (min: s). This video (9.05 MB) has been generated via considerable compression of the original large-volume video data (7.03 GB). Compression was made using TMPGEnc. See Supplementary Fig. 18. Supplementary Video 8 Visualizing the effects of drugs on F-actin organization . COS-7 cells expressing F-tractin=mStayGold (top) or mStayGld(c4)=UtrCH (bottom) were imaged by SDSRM (SpinSR10) at a single z position at 2.41 frames s −1 for 13.82 min. Cells were treated with 1 µM cytochalasin D (left) or 2 µM latrunculin A (right). Elapsed times (min: s). This video (9.38 MB) has been generated via considerable compression of the original large-volume video data (4.29 GB). Compression was made using FFmpeg. See Extended Data Fig. 8. Supplementary Video 9 Visualizing the inner mitochondrial membrane dynamics by sustainable, cell-wide volumetric SIM imaging . HeLa cells expressing COX8a=mStayGold were 3D scanned continuously with a z -step size of 0.11 µm over an axial range of 2.08 µm by lattice SIM (Elyra 7) at 37 °C. The total number of acquired volumes was 47. SIM 2 was used for image reconstruction. This video (6.69 MB) has been generated via considerable compression of the original large-volume video data (47 MB). Compression was made using TMPGEnc. Elapsed times (min: s). See Fig. 5c . Supplementary Video 10 Visualizing the inner mitochondrial membrane dynamics by fast, sustainable imaging . HeLa cells expressing COX8a=mStayGold were imaged by SDSRM (SpinSR10). Single-plane images were acquired continuously at 8.70 frames s −1 (exposure time: 100 ms). This video highlights stable mitochondria. The autofocus function of a z -drift compensator (IX3-ZDC2, Evident) was continuously active. The total number of acquired frames was 1,000. This video (6.71 MB) has been generated via considerable compression of the original large-volume video data (70.7 MB). Compression was made using TMPGEnc. Elapsed times (min: s). The stable IMM dynamics shown is a representative of n = 17 cells over n = 10 independent transfections. Supplementary Video 11 Visualizing the inner mitochondrial membrane dynamics by fast, sustainable imaging . HeLa cells expressing COX8a=mStayGold were imaged by SDSRM (SpinSR10). Single-plane images were acquired continuously at 2.41 frames s −1 (exposure time: 400 ms). This video highlights a mobile mitochondrium. The autofocus function of a z -drift compensator (IX3-ZDC2, Evident) was continuously active. The total number of acquired frames was 500. This video (3.19 MB) has been generated via considerable compression of the original large-volume video data (31.4 MB). Compression was made using TMPGEnc. Elapsed times (min: s). The mobile IMM dynamics shown is a representative of n = 14 cells over n = 9 independent transfections. Supplementary Video 12 Agonist-, antagonist-, and Ca 2+ ionophore-induced longitudinal changes in IMM structures revealed by fast, sustained, wide imaging . HeLa cells expressing COX8a=mStayGold were imaged by SDSRM (SpinSR10) continuously at a temporal resolution of 2.5 frames s −1 . Two representative experimental data are shown. Histamine, cyproheptadine and ionomycin were applied at 1 min, 2.5 min and 4 min, respectively. The autofocus function of a z -drift compensator (IX3-ZDC2, Evident) was continuously active. This video (8.9 MB) has been generated via considerable compression of the original large-volume video data (412 MB). Compression was made using TMPGEnc. Elapsed times (min: s). See Extended Data Fig. 9. Representatives of n = 12 independent experiments (transfections). Source data Source Data Fig. 2 Numerical source data. Source Data Fig. 3 Numerical source data. Source Data Extended Data Fig. 1 Numerical source data. Source Data Extended Data Fig. 2 Numerical source data. Source Data Extended Data Fig. 5 Numerical source data. Source Data Extended Data Fig. 7 Numerical source data. Source Data Extended Data Fig. 9 Numerical source data. Source Data Extended Data Fig. 10 Numerical source data.
Supplementary information The online version contains supplementary material available at 10.1038/s41592-023-02085-6.
📊 Figures
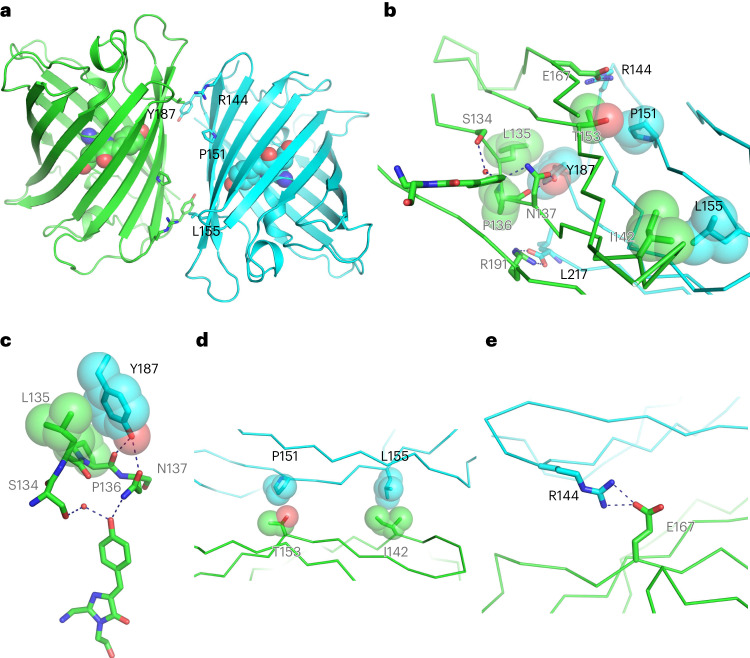
Fig. 1
Dimeric structure of StayGold.
a , Side view of the overall structure of the AC dimer with the chromophores (space-filling representation) and mutated residues (side chains) at the interface (stick representation). b u2013 e , The ...
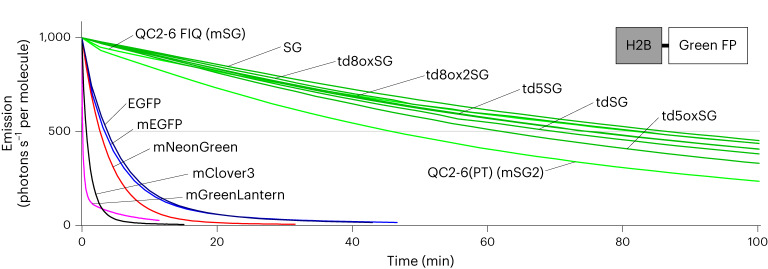
Fig. 2
Photostability of StayGold variants and reference green-emitting FPs in live cells.
Plot of intensity versus normalized total exposure time, with an initial emission rate of 1,000 photons s u22121 per molecule. FPs were expressed as fusions to H2B in HeLa cells. Illumination intensit...
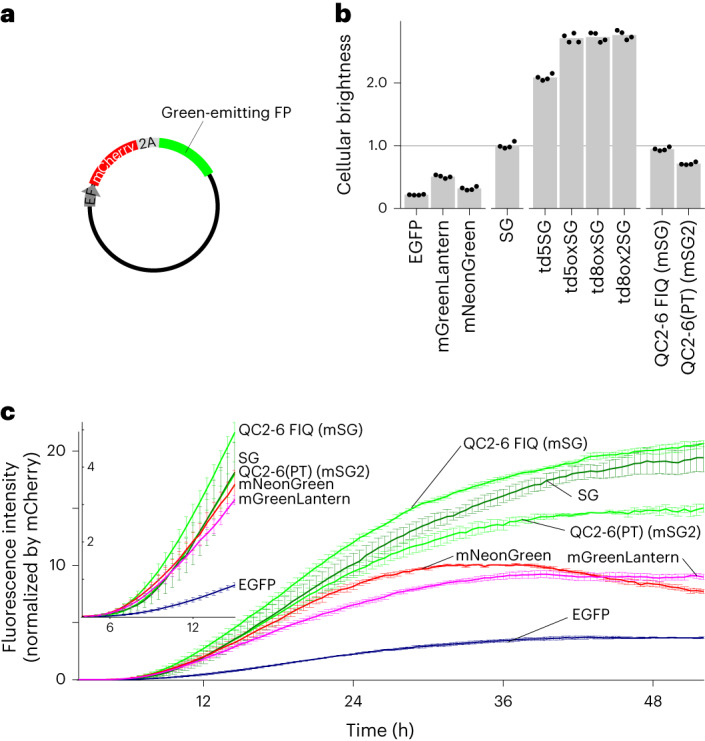
Fig. 3
Brightness of StayGold variants and reference green-emitting FPs in live cells.
a , Cotranslation of green-emitting FP with mCherry using the bicistronic coexpression system. Transfection was performed with pCSII-EF/mCherry-T2A-green-emitting FP. b , Cellular brightness 48u2009h ...
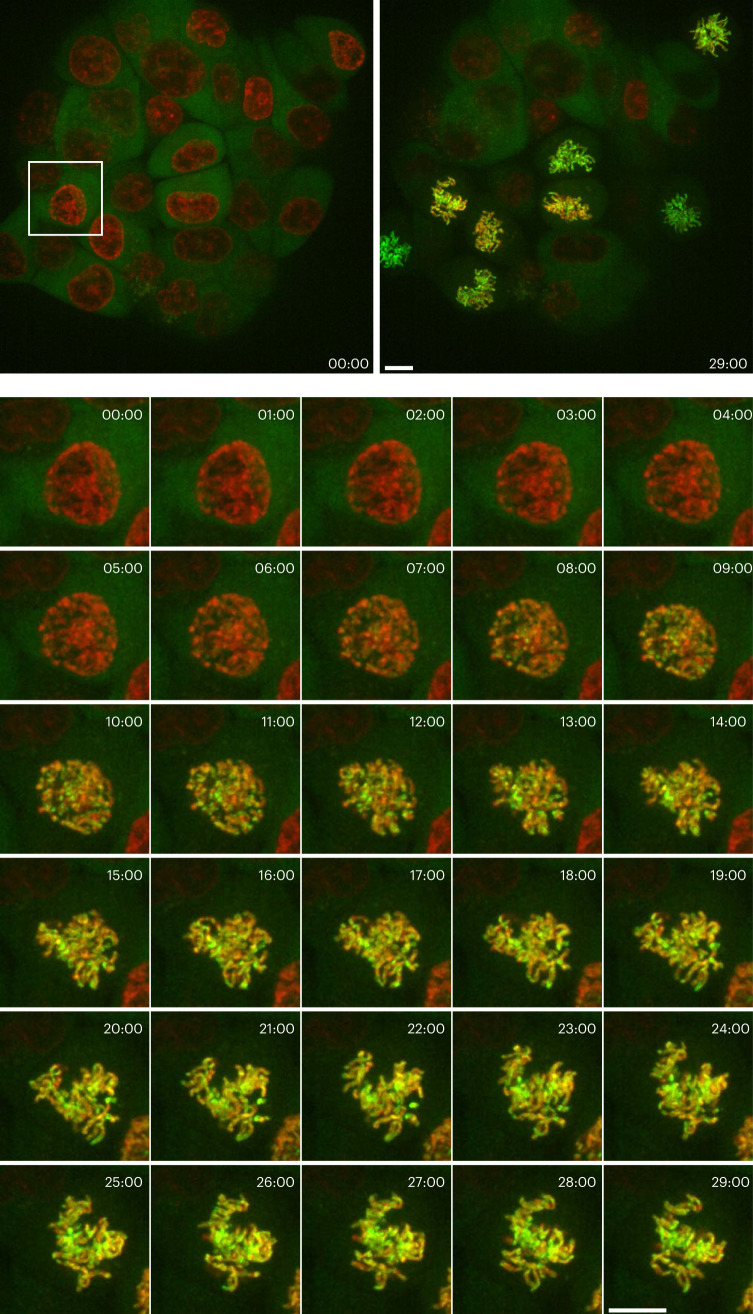
Fig. 4
Visualization of chromosome targeting of td5oxStayGold-tagged condensin I at low copy number expressed via a genome-editing technique.
After release from cell cycle arrest, genome-edited HCT116 cells (#897) were imaged for CAP-H-td5oxStayGold (at 488u2009nm excitation) and SiR-DNA-labeled chromosomes (at 637u2009nm excitation) using ...
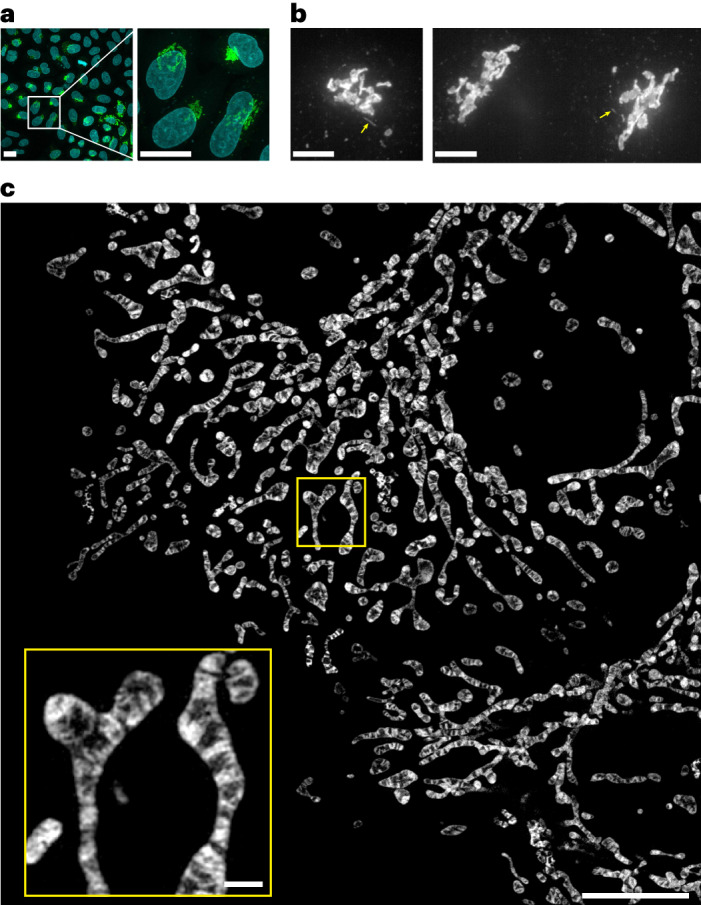
Fig. 5
Visualization of td5StayGold-harboring Golgi membranes and mStayGold-harboring inner mitochondrial membranes.
a , Confocal images of td5StayGold(c4)=GianCreg (green) and DAPI (cyan) in fixed HeLa cells. A MIP image (20 slices, 1.0-u03bcm z step). Low (left) and high (right) magnifications. Scale bars, 20u2009...
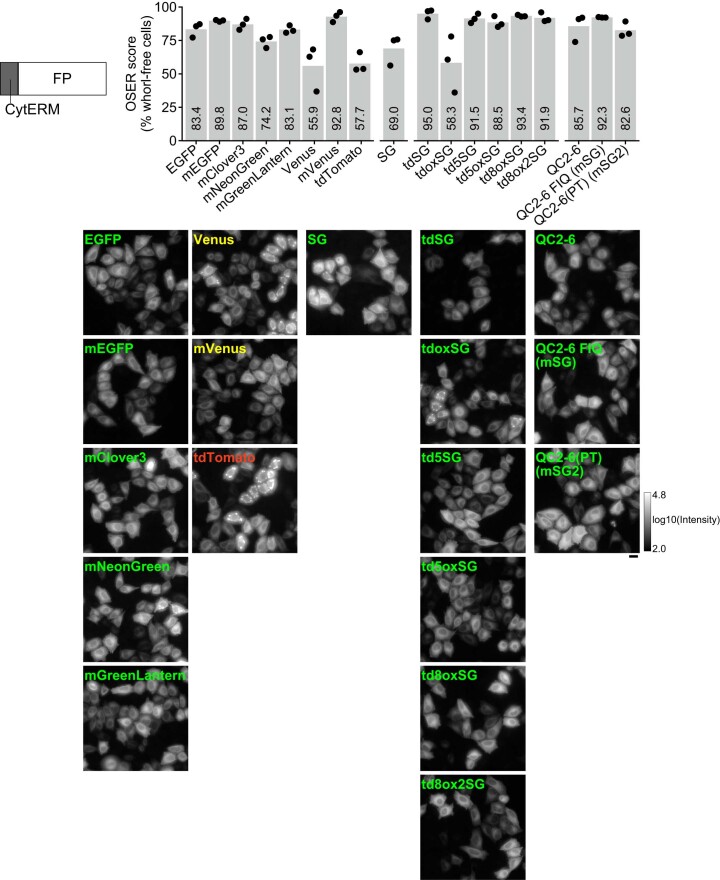
Extended Data Fig. 1
OSER assay for assessment of monomericity and dispersibility of StayGold variants and reference FPs.
HeLa cells transfected with constructs encoding CytERM-FP were imaged using wide-field (WF) microscopy. StayGold is abbreviated as SG. The constructs are grouped into four categories: eight reference ...
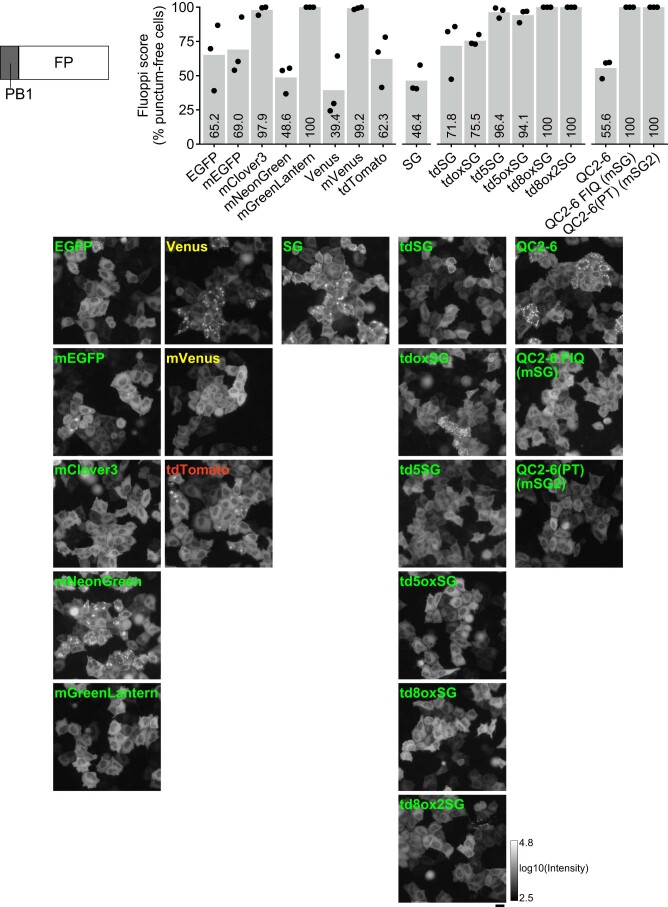
Extended Data Fig. 2
Fluoppi assay for assessment of monomericity and dispersibility of StayGold variants and reference FPs for C-terminal tagging.
HeLa cells transfected with constructs encoding PB1-FP were imaged using WF microscopy. StayGold is abbreviated as SG. The constructs are grouped into four categories: eight reference FPs, SG, tandem ...
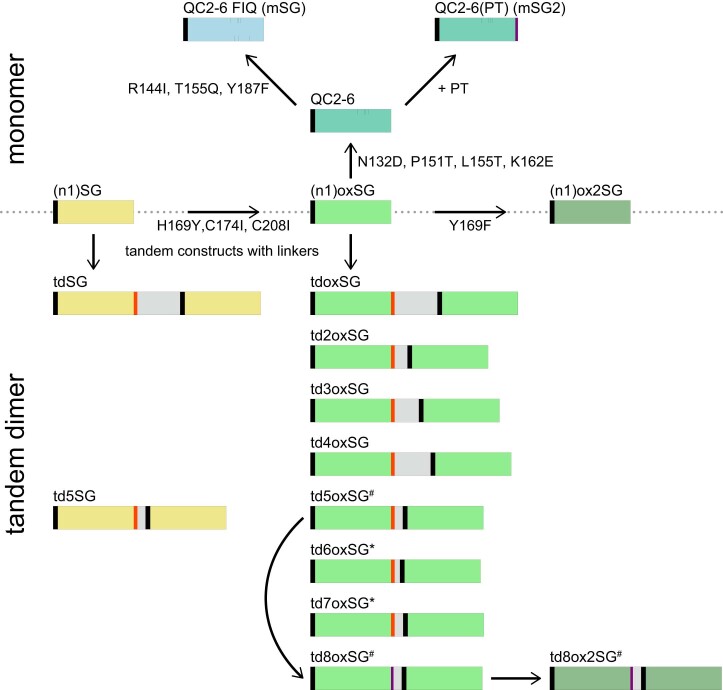
Extended Data Fig. 3
The evolution from (n1)StayGold to monomeric (top) and tandem dimer (bottom) variants.
StayGold (SG) and its variants are distinctly colored as follows. SG: khaki, oxSG: light green, ox2SG: dark sea-green, QC2-6: seafoam blue, QC2-6 FIQ (mSG): light blue. Adaptors and linkers are repres...
Extended Data Fig. 4
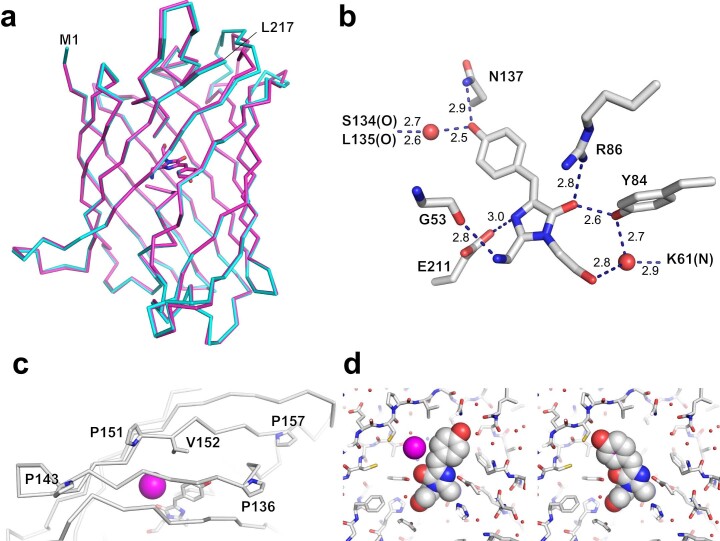
Crystal structure of StayGold.
StayGold crystallized at pH 8.5 in space group P 2 1 and diffracted to 1.56u2009u00c5. The final model has an R work of 18.63% and an R free of 21.53%. StayGold also crystallized at pH 5.6 in space gr...
Extended Data Fig. 5
Fluoppi assay for assessment of monomericity and dispersibility of StayGold variants for N-terminal tagging.
HeLa cells transfected with constructs encoding FP-PB1 were imaged using WF microscopy. StayGold is abbreviated as SG. The constructs are grouped into three categories: SG, tandem dimers, and monomers...
Extended Data Fig. 6
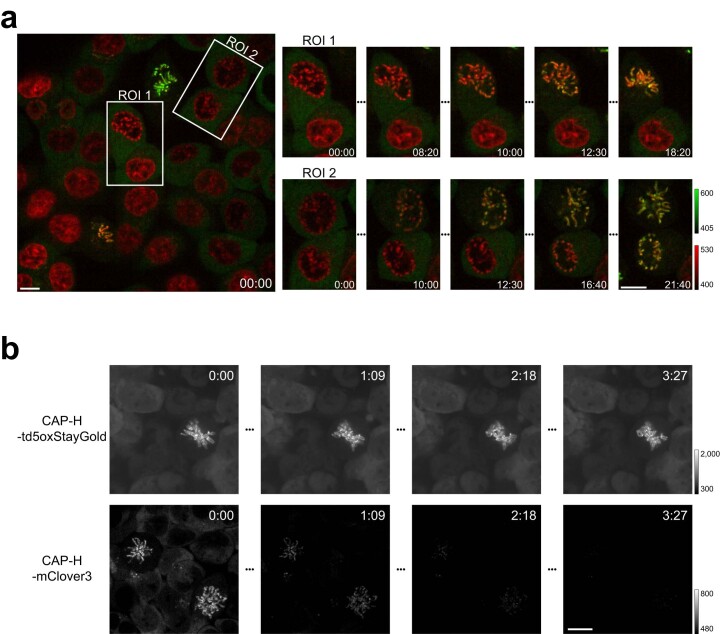
High-speed visualization of chromosome targeting of FP-tagged condensin I in genome-edited HCT116 cells.
a , After release from cell cycle arrest, genome-edited HCT116 cells (#897) were imaged under 488u2009nm excitation for observation of CAP-H-td5oxStayGold and under 637u2009nm excitation for observati...
Extended Data Fig. 7
Immunocytochemistry for localizing td5StayGold(c4)=GianCreg within the Golgi complex.
HeLa cells stably expressing td5StayGold(c4)=GianCreg were chemically fixed and immunostained for three Golgi markers: GM130 ( cis ), Giantin (medial), and TGN46 ( trans -Golgi network). Their immunos...
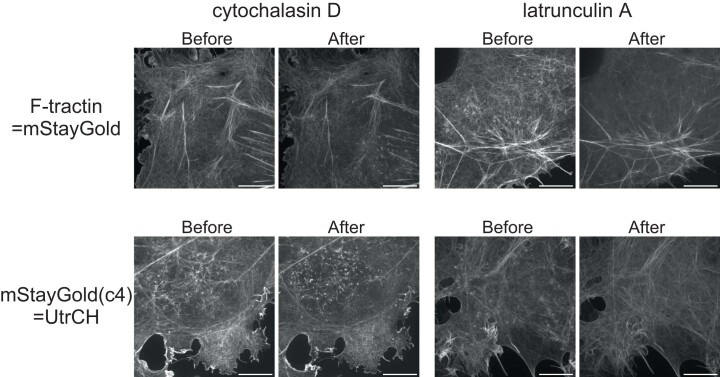
Extended Data Fig. 8
Effects of drugs on F-actin organization.
COS-7 cells expressing F-tractin=mStayGold (top) or mStayGld(c4)=UtrCH (bottom) were treated with cytochalasin D (left) or latrunculin A (right) during continuous imaging by SDSRM (SpinSR10) (Suppleme...
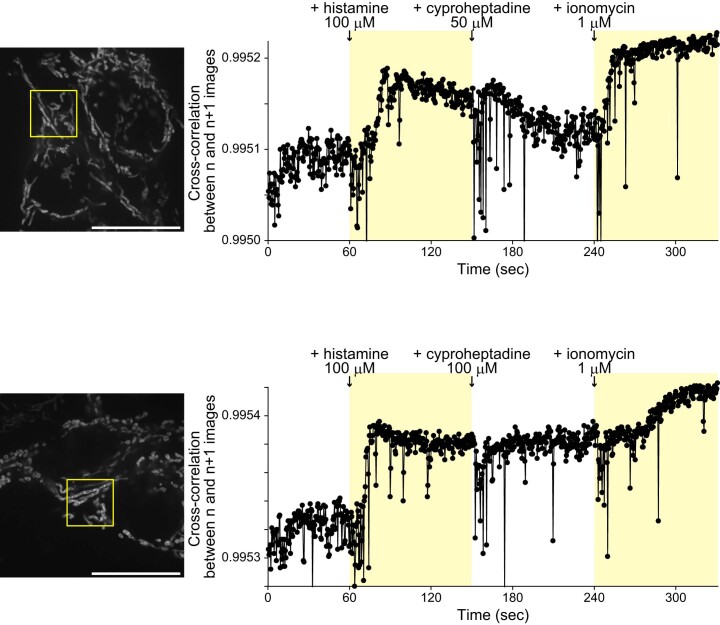
Extended Data Fig. 9
Agonist-, antagonist-, and Ca 2+ ionophore-induced longitudinal changes in IMM structures revealed by fast, sustained, wide imaging.
HeLa cells expressing COX8a=mStayGold were continuously imaged by SDSRM (SpinSR10) at a temporal resolution of 2.5 frames per second. Two representative experimental data are shown. Histamine, cyprohe...
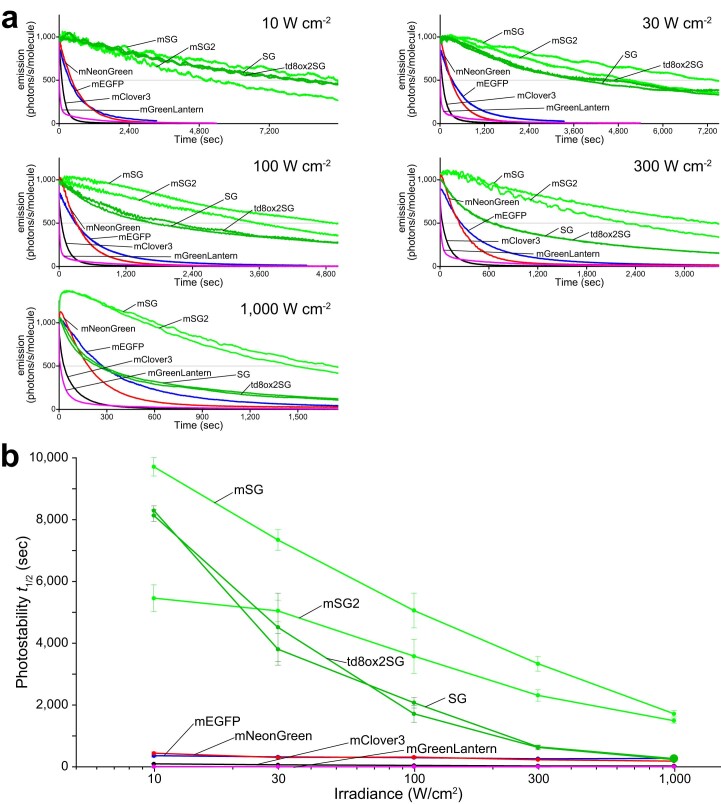
Extended Data Fig. 10
Photostability of StayGold, mStayGold, mStayGold2, and reference green-emitting FPs in live cells under continuous WF illumination with high irradiances.
FPs were expressed as fusions to histone 2B (H2B) in HeLa cells and photobleached. Illumination intensities: 10, 30, 100, 300, and 1,000u2009Wu2009cm u22122 . StayGold is abbreviated as SG. a , Plot o...
Figure images are served from the NIH/NLM PubMed Central Open Access Subset or Europe PMC; copyright remains with the publishers and authors.
💬 Discussion
0 commentsNo comments yet. Be the first to start a discussion!
Leave a Comment