Abstract
Abstract The glucagon-like peptide-1 receptor (GLP1R) is a class B G protein-coupled receptor (GPCR) involved in metabolism. Presently, its visualization is limited to genetic manipulation, antibody detection or the use of probes that stimulate receptor activation. Herein, we present LUXendin645 , a far-red fluorescent GLP1R antagonistic peptide label. LUXendin645 produces intense and specific membrane labeling throughout live and fixed tissue. GLP1R signaling can additionally be evoked when the receptor is allosterically modulated in the presence of LUXendin645 . Using LUXendin645 and LUXendin651 , we describe islet, brain and hESC-derived β-like cell GLP1R expression patterns, reveal higher-order GLP1R organization including membrane nanodomains, and track single receptor subpopulations. We furthermore show that the LUXendin backbone can be optimized for intravital two-photon imaging by installing a red fluorophore. Thus, our super-resolution compatible labeling probes allow visualization of endogenous GLP1R, and provide insight into class B GPCR distribution and dynamics both in vitro and in vivo.
🔬 Techniques
🔭 Microscopes
💻 Software
✨ Fluorophores
🧪 Sample Preparation
🔬 Cell Lines
🏭 Microscope Brands
🧪 Reagent Suppliers
🔴 Lasers
📷 Detectors
💻 Software Details
💾 Data Repositories
🏷️ Research Resource Identifiers (RRIDs)
Verified research resources used in this paper:
🏛️ Research Organizations (ROR)
Affiliated research institutions:
📋 Methods
Synthesis
A free cysteine bioconjugation handle was installed on Exendin4(9–39) using solid-phase synthesis to give the derivatized S39C-Exendin4(9–39) 21 . Maleimide-conjugated-6-TMR, -6-SiR and -Cy5 were obtained by TSTU activation of the corresponding acids and reaction with 1-(2-amino-ethyl)-pyrrole-2,5-dione (TFA salt, Aldrich). Fluorophore coupling via thiol-maleimide chemistry to peptides was performed in PBS. All compounds were characterized by HRMS and purity was assessed to be >95% by HPLC. Extinction coefficients were based upon known manufacturer bulk material measures for TMR-Mal, Cy5-Mal (both Lumiprobe), and SiR-Mal (Spirochrome). Details for synthesis including characterization of all LUXendins are detailed in the Supplementary Methods and Supplementary Figs. 1 – 11 . LUXendin555, LUXendin645 , and LUXendin651 are freely available for academic use upon request.
Cell culture AD293 cells
(Agilent) were maintained in Dulbecco’s Modified Eagles medium (DMEM; D6546, Sigma) supplemented with 10% fetal calf serum (FCS), 1% l -glutamine, and 1% penicillin/streptomycin. CHO-K1 cells stably expressing the human SNAP_GLP1R (Cisbio) (CHO-K1-SNAP_GLP1R) were maintained in DMEM supplemented with 10% FCS, 1% penicillin/streptomycin, 500 μg/mL G418, 25 mM HEPES and 1% nonessential amino acids and 2% l -glutamine. MIN6 β-cells (a kind gift from Prof. Jun-ichi Miyazaki, Osaka University) were maintained in DMEM (D6546, Sigma) supplemented with 15% FCS, 25 mM d -glucose, 71 μM BME, 2 mM l -glutamine, 100 U/mL penicillin, 100 μg/mL streptomycin, and 25 mM HEPES. INS1 832/3 CRISPR-deleted for the endogenous GLP1R locus (a kind gift from Dr. Jacqui Naylor, MedImmune) 54 were transfected with human SNAP_GLP1R, before FACS of the SNAP-Surface488-positive population and selection using G41820 . The resulting SNAP_GLP1R_INS1 GLP1R−/− cells were maintained in RPMI-1640 supplemented with 10% FBS, 10 mM HEPES, 2 mM l -glutamine, 1 mM pyruvate, 72 µM β-mercaptoethanol, 1% penicillin/streptomycin, and 500 μg/mL G418. Animals Glp1r (GE)-/- : CRISPR-Cas9 genome-editing was used to introduce a single base pair deletion into exon 1 of the Glp1r locus. Fertilized eggs of female Cas9-overexpressing mice (strain Gt(ROSA)26Sor tm1.1(CAG-cas9*,–EGFP)Fezh /J; JAX stock no. 024858) were harvested following super-ovulation. Modified single-guide RNA (Synthego) targeting exon 1 of Glp1r and a single-stranded repair-template were injected at 20 ng/µl into the pronucleus of embryos at the 1-cell stage. In culture, 80% of embryos reached the 2-cell stage and were transplanted into surrogate mice. Glp1r (GE)−/− mice did not integrate the repair-template (confirmed by genotyping PCR), but instead harbored a single nucleotide deletion leading to a frame-shift mutation and loss of GLP1R protein. Knock-in mice that integrated the repair template were not used in the present studies and will be described elsewhere. The targeted locus of Glp1r (GE)−/− offspring was analyzed by PCR and sequencing. Off-target sites were predicted using the CRISPR Guide Design Tool (crispr.mit.edu). Loci of the top 10 off-target hits were amplified by PCR and analyzed via Sanger sequencing (Supplementary Table 1 ). Founder animals carrying alleles with small deletions were backcrossed to wild type animals (strain C57BL/6J) for 1–3 generations to outbreed affected off-targets and then bred to homozygosity (Supplementary Figs. 15 and 16 ). Animals were born in Mendelian ratios, genotyping was performed using Sanger sequencing or PCR.
Show full methods section
Synthesis
A free cysteine bioconjugation handle was installed on Exendin4(9–39) using solid-phase synthesis to give the derivatized S39C-Exendin4(9–39) 21 . Maleimide-conjugated-6-TMR, -6-SiR and -Cy5 were obtained by TSTU activation of the corresponding acids and reaction with 1-(2-amino-ethyl)-pyrrole-2,5-dione (TFA salt, Aldrich). Fluorophore coupling via thiol-maleimide chemistry to peptides was performed in PBS. All compounds were characterized by HRMS and purity was assessed to be >95% by HPLC. Extinction coefficients were based upon known manufacturer bulk material measures for TMR-Mal, Cy5-Mal (both Lumiprobe), and SiR-Mal (Spirochrome). Details for synthesis including characterization of all LUXendins are detailed in the Supplementary Methods and Supplementary Figs. 1 – 11 . LUXendin555, LUXendin645 , and LUXendin651 are freely available for academic use upon request.
Cell culture AD293 cells
(Agilent) were maintained in Dulbecco’s Modified Eagles medium (DMEM; D6546, Sigma) supplemented with 10% fetal calf serum (FCS), 1% l -glutamine, and 1% penicillin/streptomycin. CHO-K1 cells stably expressing the human SNAP_GLP1R (Cisbio) (CHO-K1-SNAP_GLP1R) were maintained in DMEM supplemented with 10% FCS, 1% penicillin/streptomycin, 500 μg/mL G418, 25 mM HEPES and 1% nonessential amino acids and 2% l -glutamine. MIN6 β-cells (a kind gift from Prof. Jun-ichi Miyazaki, Osaka University) were maintained in DMEM (D6546, Sigma) supplemented with 15% FCS, 25 mM d -glucose, 71 μM BME, 2 mM l -glutamine, 100 U/mL penicillin, 100 μg/mL streptomycin, and 25 mM HEPES. INS1 832/3 CRISPR-deleted for the endogenous GLP1R locus (a kind gift from Dr. Jacqui Naylor, MedImmune) 54 were transfected with human SNAP_GLP1R, before FACS of the SNAP-Surface488-positive population and selection using G41820 . The resulting SNAP_GLP1R_INS1 GLP1R−/− cells were maintained in RPMI-1640 supplemented with 10% FBS, 10 mM HEPES, 2 mM l -glutamine, 1 mM pyruvate, 72 µM β-mercaptoethanol, 1% penicillin/streptomycin, and 500 μg/mL G418. Animals Glp1r (GE)-/- : CRISPR-Cas9 genome-editing was used to introduce a single base pair deletion into exon 1 of the Glp1r locus. Fertilized eggs of female Cas9-overexpressing mice (strain Gt(ROSA)26Sor tm1.1(CAG-cas9*,–EGFP)Fezh /J; JAX stock no. 024858) were harvested following super-ovulation. Modified single-guide RNA (Synthego) targeting exon 1 of Glp1r and a single-stranded repair-template were injected at 20 ng/µl into the pronucleus of embryos at the 1-cell stage. In culture, 80% of embryos reached the 2-cell stage and were transplanted into surrogate mice. Glp1r (GE)−/− mice did not integrate the repair-template (confirmed by genotyping PCR), but instead harbored a single nucleotide deletion leading to a frame-shift mutation and loss of GLP1R protein. Knock-in mice that integrated the repair template were not used in the present studies and will be described elsewhere. The targeted locus of Glp1r (GE)−/− offspring was analyzed by PCR and sequencing. Off-target sites were predicted using the CRISPR Guide Design Tool (crispr.mit.edu). Loci of the top 10 off-target hits were amplified by PCR and analyzed via Sanger sequencing (Supplementary Table 1 ). Founder animals carrying alleles with small deletions were backcrossed to wild type animals (strain C57BL/6J) for 1–3 generations to outbreed affected off-targets and then bred to homozygosity (Supplementary Figs. 15 and 16 ). Animals were born in Mendelian ratios, genotyping was performed using Sanger sequencing or PCR.
Genotyping
PCRs were performed with Glp1r forward primer 5′-CAGGCGCTCAGAGCTAGAAGC-3′ and with Glp1r wild-type reverse primer 5′-CCAGGGCTCACCTGAGGG-3′ or Glp1r knockout 5′-CCAGGGCTCACCTGAGGC-3′ to amplify and detect the WT or mutant allele, respectively. Animals were bred as heterozygous pairs to ensure Glp1r +/+ littermates. Glp1r (GE)−/− animals are freely available for academic use, subject to a Material Transfer Agreement. Ins1Cre Thor ;R26 mT/mG : To allow identification of β- and non-β-cells, Ins1Cre Thor animals with Cre knocked-in at the Ins1 locus (strain B6(Cg)- Ins1 tm1.1(cre)Thor /J; JAX stock no. 026801) were crossed with R26 mT/mG reporter mice (strain B6.129(Cg)- Gt(ROSA)26Sor tm4(ACTB-tdTomato,-EGFP)Luo /J; JAX stock no. 007676). Cre-dependent excision of the floxed allele results in deletion of tdTomato, expression of membrane-localized GFP and thus identification of recombined and non-recombined cells. GLU-YFP : Animals harboring YFP under the control of the glucagon promoter were generated and bred as previously described 55 . GLP1RCre;LSL-GCaMP3 : To identify GLP1R-expressing cells in the brain, mice with Glp1r promoter-drive Cre 7 were bred with stop-flox’d GCaMP3 animals (JAX stock no. 014538). CD1 wild-type animals were purchased from Charles River Laboratories UK. All studies were performed with 6–12-week-old male and female animals, Ethical approval All animal research complied with the Animals (Scientific Procedures) Act 1986 of the U.K. Approval was granted by the University of Birmingham’s Animal Welfare and Ethical Review Body. Procurement of human islets was approved by the Human Research Ethics Board (Pro00013094; Pro00001754) at the University of Alberta and all families of organ donors provided written informed consent. hESC (WA01/H1; hPSCreg name WAe001-A) (obtained from WiCell) were generated by the originating institute with informed consent and ethical approval from the Robert-Koch Institut, Berlin (Az.3.04.02/0101) and NIH (NIHhESC-10-0043). Studies with hESC (WA01/H1) were approved by the BC Children’s and Women’s Hospital Human Research Ethics Board (Approval #H09-00676). Studies with human tissue were approved by the BC Children’s and Women’s Hospital Human Research Ethics, University of Birmingham Ethics Committee and the National Research Ethics Committee (REC reference 16/NE/0107, Newcastle and North Tyneside, UK).
Islet isolation
Animals were humanely euthanized before injection of collagenase 1 mg/mL (Serva NB8) into the bile duct. Following removal of the inflated pancreas and digestion for 12 min at 37 °C, islets were separated using a Histopaque (Sigma-Aldrich) gradient. Islets were cultured in RPMI medium containing 10% FCS, 100 units/mL penicillin, and 100 μg/mL streptomycin.
Binding and potency assays
Binding assays were performed in transiently transfected YFP-AD293-SNAP_GLP1R cells (using PolyJet reagent; SignaGen). Increasing concentrations of compound were applied for 60 min, before imaging using a Zeiss LSM880 meta-confocal microscope configured with GaAsP detectors and ×10/0.45W, ×40/1.00W and ×63/1.20W objectives. YFP, TMR ( LUXendin555 ), and Cy5 ( LUXendin645 ) were excited using λ = 514 nm, λ = 561 nm, and λ = 633 nm lasers, respectively. Emitted signals were captured at λ = 519–574 nm, λ = 570–641 nm, and λ = 638–759 nm for YFP, TMR ( LUXendin555 ), and Cy5 ( LUXendin645 ), respectively. Control experiments were performed in YFP-AD293-SNAP cells, as above. Potency for cAMP generation and inhibition was tested in heterologous expression systems, comprising either stable CHO-K1-SNAP_GLP1R or HEK-SNAP_GLP1R cells, or transiently transfected YFP-AD293-SNAP_GLP1R cells 21 . Briefly, cells were incubated with increasing concentrations of compound with and without allosteric modulator for 30 min, before harvesting, lysis and measurement of cAMP using either cAMP-Glo TM (Promega) or HTRF (Cisbio) assays, according to the manufacturer’s instructions. All assays were performed in the presence of 100–500 µM IBMX to inhibit phosphodiesterase activity. EC 50 values were calculated using log concentration–response curves fitted with a three-parameter or four-parameter equation.
Live imaging
Islets were incubated for 1 h at 37 °C in culture medium supplemented with either 100–250 nM LUXendin555 , 50–100 nM LUXendin645 , or 100 nM LUXendin651 . Islets were imaged using either a Zeiss LSM780 or LSM880 microscope, as above ( LUXendin651 was imaged as for LUXendin645 ). Ins1Cre Thor ;R26 mT/mG islets were excited at λ = 488 nm (emission, λ = 493–555 nm) and λ = 561 nm (emission, λ = 570–624 nm) for mGFP and tdTomato, respectively. Two-photon imaging of LUXendin645 was performed using a Zeiss LSM 880 NLO equipped with a Spectra-Physics Insight X3 femtosecond-pulsed laser and ×20/1.00W objective. Excitation was performed at λ = 800 nm and emitted signals detected at λ = 638–759 nm. cAMP imaging Islets were transduced with adenovirus harboring the FRET sensor, Epac2-camps 56 (a kind gift from Prof. Dermot Cooper, University of Cambridge), before imaging using a Crest X-Light spinning disk system coupled to a Nikon Ti-E base and ×10/0.4 NA objective. Excitation was delivered at λ = 430–450 nm using a Lumencor Spectra X light engine. Emitted signals were detected at λ = 460–500 and λ = 520–550 nm for Cerulean and Citrine, respectively, using a Photometrics Delta Evolve EM-CCD. Imaging was performed in HEPES–bicarbonate buffer, containing (in mmol/L) 120 NaCl, 4.8 KCl, 24 NaHCO 3 , 0.5 Na 2 HPO 4 , 5 HEPES, 2.5 CaCl 2 , 1.2 MgCl 2 , and 3–17 d -glucose. Vehicle (H 2 O), Exendin4(1–39) (10–20 nM), or Liraglutide (10 nM) were applied at the indicated time points, with forskolin (10 µM) acting as a positive control. Immunostaining LUXendin555 (250 nM) or LUXendin645 (50–250 nM) were applied to cells or tissue for 60 min, before fixation in 4% formaldehyde. Primary antibodies were applied overnight at 4 °C in PBS + 0.1% Triton + 1% BSA. Secondary antibodies were applied in the same buffer for 1 h at room temperature, before mounting on slides using Vectashield Hardset containing DAPI. Primary antibodies were mouse monoclonal anti-GLP1R 1:30 (Iowa DHSB; mAb #7F38), rabbit anti-insulin 1:500 (Cell Signaling Technology, #3014), mouse monoclonal anti-glucagon 1:2000 (Sigma-Aldrich, #G2654), and mouse anti-somatostatin 1:5000 (Invitrogen, #14-9751-80). Secondary antibodies were goat anti-mouse DyLight488, goat anti-mouse Alexa Fluor 568, and donkey anti-rabbit DyLight 488 1:1000. Images were captured using an LSM880 meta-confocal microscope. DyLight488 and Alexa Fluor 568 were excited at λ = 488 nm and λ = 568 nm, respectively. Emitted signals were detected at λ = 500–550 nm (DyLight 488) and λ = 519–574 nm (Alexa Fluor 568). GLP1R surface expression was quantified vs. total GLP1R expression, and normalized against Exendin4(1–39) controls. Super-resolution microscopy SRRF: MIN6 were treated with 250 nM LUXendin645 before live imaging, or fixation and mounting on slides using Vectashield Hardset containing DAPI. Imaging was performed using a Crest X-Light spinning disk system in bypass (widefield) mode. Excitation was delivered at λ = 640/30 nm through a ×60/1.4 NA objective using a Lumencor SPECTRA X light engine. Emission was collected at λ = 700/75 nm using a Photometrics Delta Evolve EMCDD. A 250–500 frame raw image sequence was captured (~2 min) before offline super resolution radial fluctuation (SRRF) analysis to generate a single super-resolution snapshot using the NanoJ plugin for ImageJ (NIH) 38 . STED microscopy : MIN6 cells were treated with 100, 200, and 400 nM LUXendin651 before fixation (4% paraformaldehyde, 20 min). Cells were mounted in Mowiol supplemented with DABCO and imaged on an Abberior STED 775/595/RESOLFT QUAD scanning microscope (Abberior Instruments GmbH, Germany) equipped with STED lines at λ = 595 and λ = 775 nm, excitation lines at λ = 355, 405, 485, 561, and 640 nm, spectral detection, and a UPlanSApo ×100/1.4 oil immersion objective lens. Following excitation at λ = 640 nm, fluorescence was acquired in the spectral window λ = 650–800 nm. For live-imaging, MIN6 cells were seeded on 18 mm coverslips 24–48 h prior to treatment with 400 nM LUXendin651 for 30–45 min before washing once in full medium. Coverslips were transferred into a magnetic chamber (Chamlide CMB, Live Cell Instrument) and washed once with HBSS buffer (Lonza, with additional 5 mM HEPES bubbled with carbogen for 5 min and pH adjusted to 7.4 with NaOH), which was also used as imaging buffer at 24 °C. Live imaging was performed within 45 min after mounting. Deconvolution was performed with Richardson–Lucy algorithm on Imspector software. FWHM was measured on raw data and calculated using OriginPro 2017 software with Gaussian fitting ( n = 15 profiles). Minimum and maximum intensity values refer to intensities after deconvolution for STED images and smoothing with a 1-pixel lowpass Gaussian filter for confocal images. Spatial GLP1R expression patterns were analyzed using the F - and G -functions, where F = distance between an object of interest and its nearest neighbor, and G = distance from a given position to the nearest object of interest (FIJI Spatial Statistic 2D/3D plugin) 57 . Both measures were compared to a random distribution of the same measured objects, with a shift away from the mean ± 95% confidence intervals indicating a non-random or more clustered organization (i.e. more space or smaller distance between objects). Cells possessing highly concentrated GLP1R clusters were identified based upon their fluorescence above a threshold of the population mean fluorescence +1 s.d. Single-molecule microscopy: For single-molecule experiments, CHO-K1-SNAP_GLP1R cells were seeded onto 25 mm clean glass coverslips at a density of 3 × 10 5 per well. On the following day, cells were labeled in culture medium with 100 pM LUXendin645 or LUXendin651 for 20 min; this concentration avoids labeling all GLP1R, which would otherwise preclude single-molecule analysis in a stable cell line. At the end of the incubation, cells were washed 3 × 5 min in culture medium. Cells were then imaged at 37 °C in phenol-red free Hank’s balanced salt solution, using a custom built TIRF microscope (Cairn Research) based on an Eclipse Ti2 (Nikon, Japan) equipped with an EMCCD camera (iXon Ultra, Andor), 637 nm diode laser, and a ×100 oil-immersion objective (NA 1.49, Nikon). Image sequences were acquired with an exposure time of 60 ms. Image sequences were analyzed with an automated particle detection software (utrack) in the MATLAB environment 40 , 58 . To analyze the motion of receptors, the time-averaged mean-squared displacement (TA-MSD) 59 of individual trajectories from TIRF image sequences was computed 40 . To calculate the diffusion coefficient ( D ), the TA-MSD data were fitted with the following equation: documentclass[12pt]{minimal} usepackage{amsmath} usepackage{wasysym} usepackage{amsfonts} usepackage{amssymb} usepackage{amsbsy} usepackage{mathrsfs} usepackage{upgreek} setlength{oddsidemargin}{-69pt} begin{document}$${mathrm{TA}} - {mathrm{MSD}}left( t right) = 4Dt^{alpha} + 4{sigma}_{{mathrm{err}}}^2$$end{document} TA − MSD t = 4 D t α + 4 σ err 2 where t indicates time, α is the anomalous diffusion exponent and σ err is a constant offset for localization error. Only trajectories lasting at least 50 frames were analyzed ( n traj = 5057 for Cy5 and 8612 for SiR). Trajectories were then categorized according to the diffusion parameters D and α. Particles with D < 0.01 μm 2 s − α were considered to be immobile. Normal diffusion was assigned to particles that had D ≥ 0.01 μm 2 s − α and 0.75 ≤ α ≤ 1.25. Sub-diffusion and super-diffusion were assigned to particles with D ≥ 0.01 μm 2 s − α and α < 0.75 or α > 1.25, respectively.
Brain labelling
Mice were injected subcutaneously with 100 pmol/g of LUXendin645 and left for two hours before terminal anaesthesia and transcardial perfuse fixation with 4% fresh formalin. Brains were serially sectioned at 30 µm and mounted on slides before imaging, as above. Super-resolution snapshots (~140 nm lateral resolution) were acquired using a Zeiss LSM880 equipped with an Airyscan module and a ×63/1.2W objective. Brain clearing was carried out using the 3DISCO protocol 60 . Samples were suspended on a needle, before imaging using a custom-built optical projection tomography (OPT) platform, with images collected after excitation at λ = 470 and 660 nm. Images were reconstructed using custom-written MATLAB scripts and visualized in Volocity (Perkin-Elmer).
Two-photon in vivo imaging Female and male
C57BL/6J mice 7–12 weeks of age were used. Each mouse was anesthetized with isoflurane and a small, 1 cm vertical incision was made at the level of the pancreas. The exposed organ was orientated underneath the animal and pressed against a 50 mm glass-bottom dish for imaging on an inverted microscope. Body temperature was maintained using heat pads and heating elements on the objective. The mouse received Hoechst 33342 (1 mg/kg in PBS) to label nuclei, a 150 kDa fluorescein-conjugated dextran (1 mg/kg in PBS) to label vasculature, and 75 μL of 30 µM LUXendin555 via retro-orbital IV injection. Images were collected using a Leica SP8 microscope, equipped with a ×25/0.95 NA objective and Spectra Physics MaiTai DeepSee mulitphoton laser. Excitation was delivered at λ = 850 nm, with signals collected with a HyD detector at λ = 460/50, λ = 525/50, λ = 624/40 nm for Hoechst, FITC, and LUXendin555 , respectively. Blood was collected from the tail vein prior to and 30 min after LUXendin555 injection, and glucose was measured using an AlphaTrak2 glucometer. All in vivo imaging experiments were performed with approval and oversight from the Indiana University Institutional Animal Care and Use Committee (IACUC).
Stem cell differentiation and gene expression analyses
WA01/H1 hESCs were differentiated using the protocol published by Nair et al. 61 . Briefly, dissociated H1 hESCs were plated on six-well plates at a density of 5.5 million cells in 5.5 mL media per well. The plates were incubated at 37 °C and 5% CO 2 on an orbital shaker at 100 rpm to induce spheroid formation. After 24 h, six-step differentiation was induced. Differentiation was stopped at day 21 and spheroids labelled with LUXendin645 , fixed in 4% formaldehyde and co-stained with insulin and glucagon. To confirm differentiation, a subset of spheroids was paraffin-embedded, sectioned at 5 µm and stained for insulin and NKX6-1. Primary antibodies were guinea pig anti-insulin 1:500 (Dako Cytomation, #A0564), mouse monoclonal anti-glucagon 1:2000 (Sigma-Aldrich, #G2654), and rabbit monoclonal anti-NKX6-1 (D8O4R) 1:400 (Cell Signaling, #54551). Secondary antibodies were donkey anti-guinea pig FITC, donkey anti-mouse FITC, and donkey anti-rabbit Cy3 1:200 (Jackson Immuno Research Laboratories, #706-096-148, #715-096-150, #711-166-152). The spheroids and sections were imaged using a Leica SP8 confocal microscope with a ×20/0.75 IMM objective. Manders’ co-efficient (Coloc 2 plugin for FIJI) was used to quantify the extent of overlap of LUXendin645 signal with the insulin or glucagon channels (M1). nCounter gene expression assay (Nanostring, WA) was used to assess GLP1R gene expression in hESCs, differentiated β-like cells, and human islets. The values are normalized to six different housekeeping genes ( B2M, GAPDH , GUSB , HPRT1 , POLR2A , and TBP ). Human islets were obtained from Alberta Islet Distribution Program. Sex, age, and BMI of each islet sample were: #1: Male, 53 y.o., 33.7 kg/m 2 , #2: Female, 17 y.o., 22.7 kg/m 2 , #3: Male, 18 y.o., 22.9 kg/m 2 . WA01/H1 hESCs were obtained under MTA from WiCell (Madison WI) and institutional use was approved by the BCCHR/UBC Human Research Ethics Board (Approval # H09-00676). For FACS analysis, LUXendin -labelled spheroids were collected, incubated with Accumax at 37 °C for 10 min and dissociated into single cells. CMRL with 1% BSA was added, followed by filtering through a 40-mm nylon filter. Cells were centrifuged for 5 min at 200× g , washed with PBS, and resuspended in 500 µL of PBS. LUXendin + and LUXendin − cells were sorted into TRIzol for further qPCR using a BD FACSAria IIu. RNA was isolated with TRIzol, DNase-treated with Turbo DNAse Free, and reverse transcribed with Superscript III. TaqMan qPCR was performed and data were normalized by TBP . Primers used were: GLP1R (forward [F], 5′-GTGCTATACATCCACTTCAGGG-3′; reverse [R], 5′-GCTCTGGTTATCGCCTCTG-3′; and probe 5-TCCACCTGAACCTGTTTGCATCCT-3′), NKX6-1 (F, 5′-TCGTTTGGCCTATTCGTTGG-3′; R, 5′-TGTCTCCGAGTCCTGCTTC-3′; and probe 5-TGCTTCTTCCTCCACTTGGTCCG-3′), INS (F, 5′-CTAGTGTGCGGGGAACG-3′; R, 5′-CACGCTTCTGCAGGGAC-3′; and probe 5-CGGCGGGTCTTGGGTGTGTA-3′), GCG (F, 5′-GTCCAGATACTTGCTGTAGTCAC-3′; R, 5′-ACGTTCCCTTCAAGACACAG-3′; and probe 5-ATGGCGCTTGTCCTCGTTCATCT-3′), and TBP (F, 5′-GAGAGTTCTGGGATTGTACCG-3′; R, 5′-ATCCTCATGATTACCGCAGC-3′; and probe 5-TGGGATTATATTCGGCGTTTCGGGC-3′).
Statistical analyses
Measurements were performed on discrete samples unless otherwise stated. All analyses were conducted using GraphPad Prism software. Unpaired or paired Student's t -test was used for pairwise comparisons. Multiple interactions were determined using one-way or two-way ANOVA followed by Bonferonni’s, Dunn’s, or Sidak’s posthoc tests (accounting for degrees of freedom). Reporting summary Further information on research design is available in the Nature Research Reporting Summary linked to this article.
Supplementary information Supplementary Information Peer Review File Description of Additional Supplementary Files Supplementary Movie 1 Supplementary Movie 2 Supplementary Movie 3 Supplementary Movie 4 Reporting Summary
📊 Figures
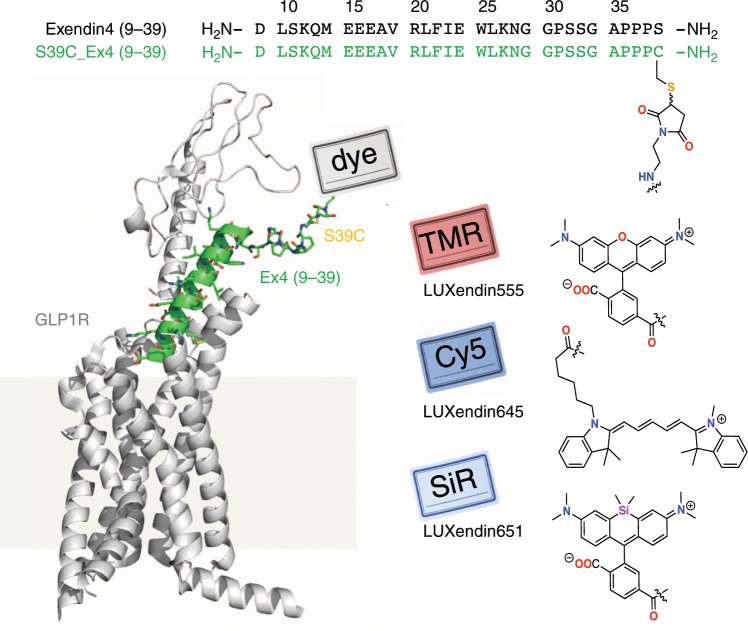
Fig. 1
Sequence and structure of LUXendin555, LUXendin645, and LUXendin651.
LUXendins are based on the antagonist Exendin4(9u201339), shown in complex with GLP1R. The label can be any dye, such as TMR (top), SiR (middle), or Cy5 (bottom) to give LUXendin555, LUXendin645, and ...
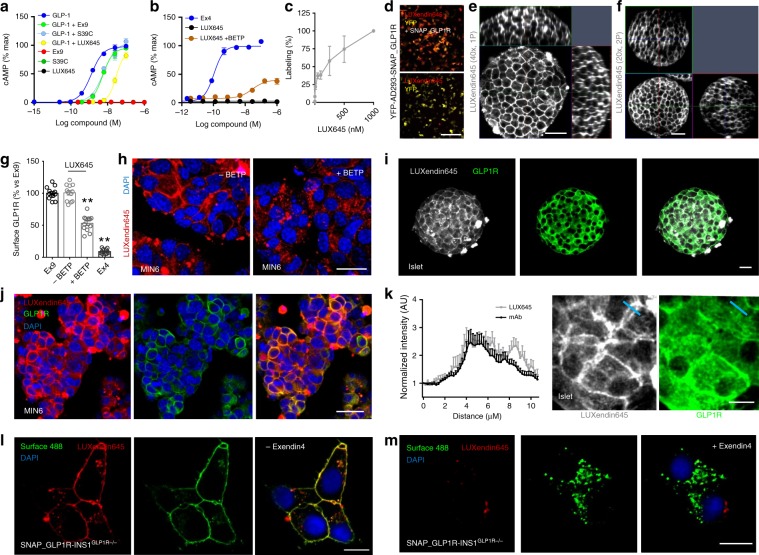
Fig. 2
LUXendin645 binding, signaling, and labeling.
a Exendin4(9u201339), S39C-Exendin4(9u201339), and LUXendin645 (LUX645)u00a0display similar antagonistic properties (applied at 1u2009u00b5M) in HEK293-SNAP_GLP1R following 30u2009min GLP-1-stimulatio...
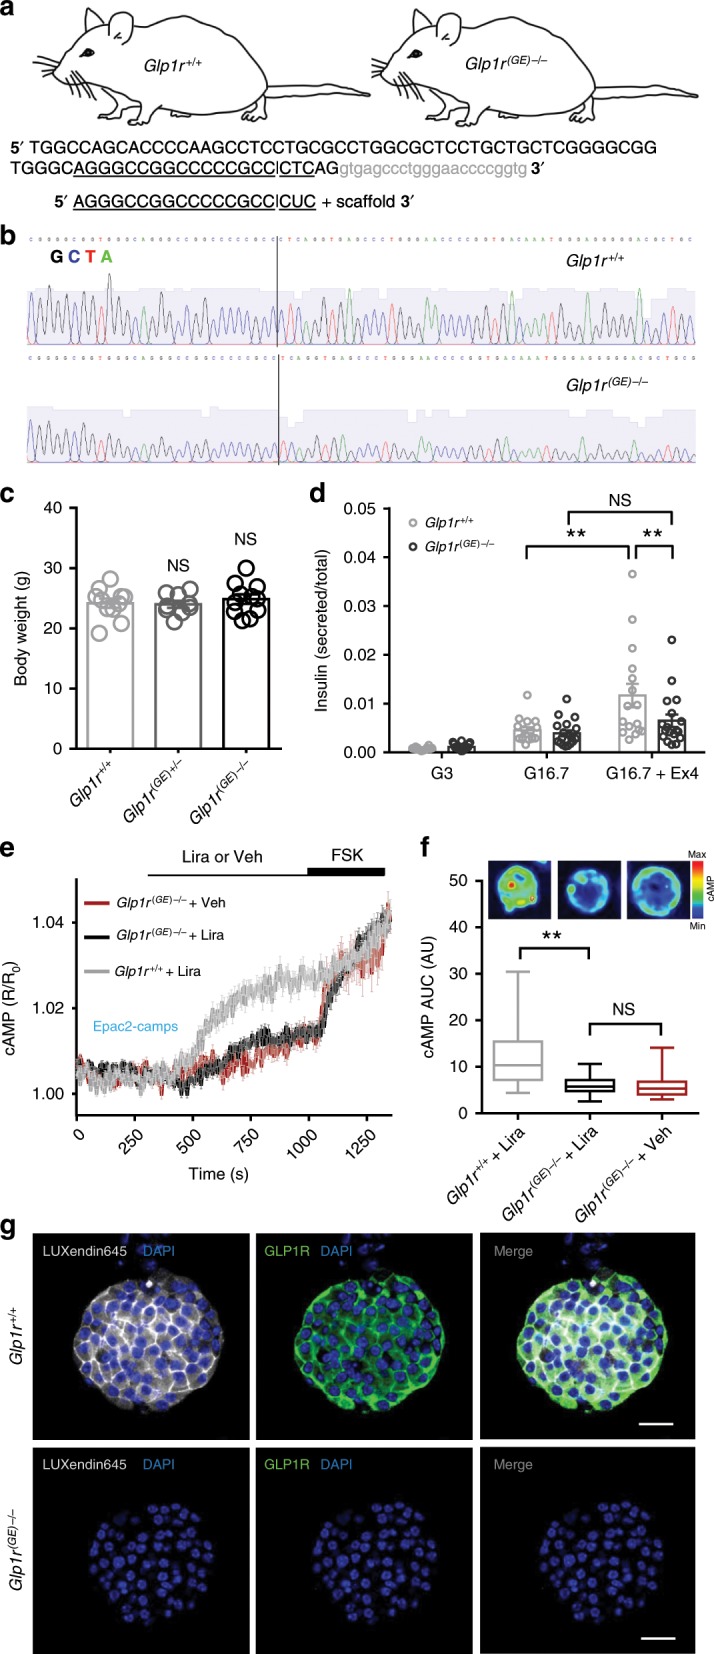
Fig. 3
LUXendin645 is highly specific for the GLP1R.
a Schematic showing sgRNA-targeting strategy for the production of Glp1r (GE)u2212/u2212 mice. The sgRNA used targeted Glp1r and the double-strand break mediated by Cas9 lies within exon1 (capital let...
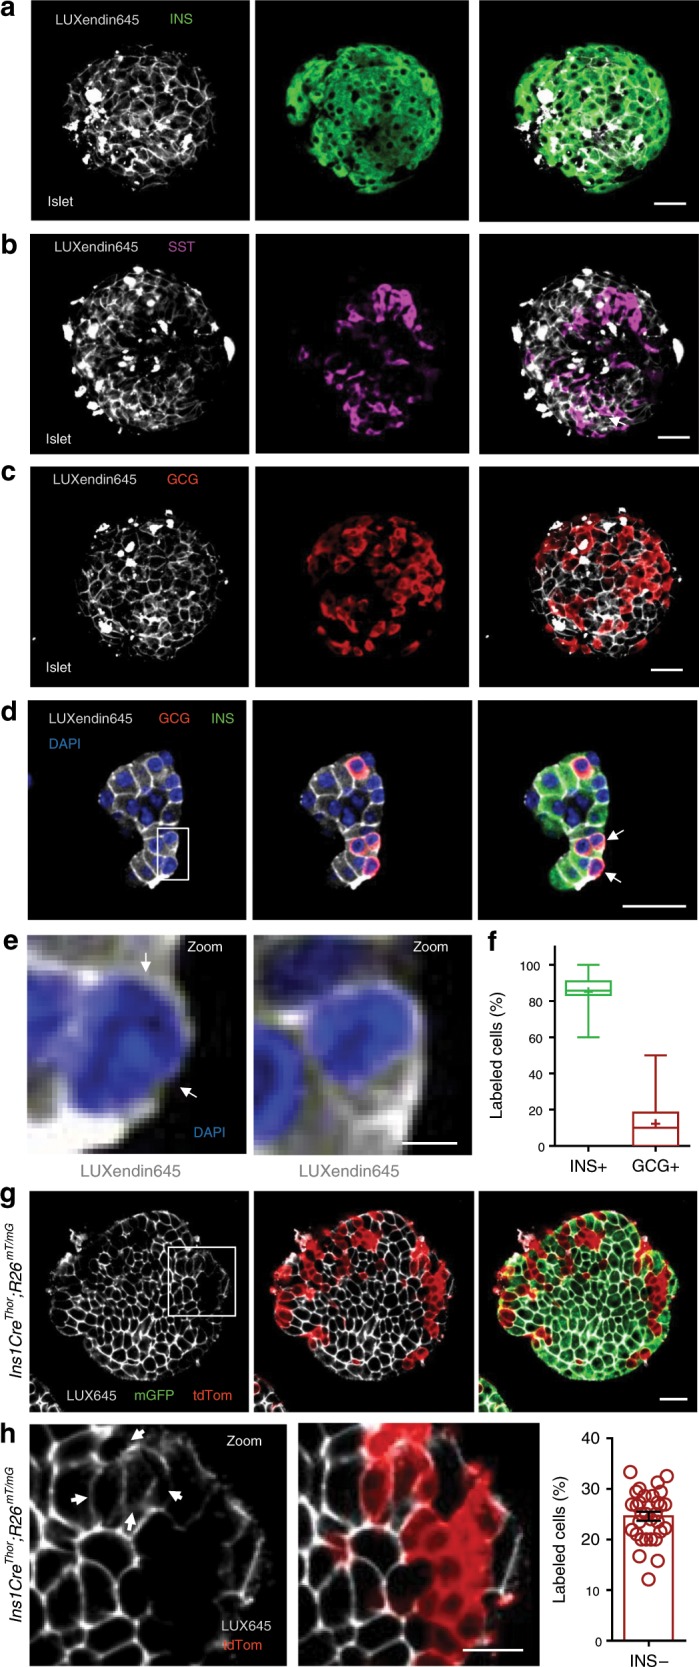
Fig. 4
LUXendin645 reveals GLP1R expression in a subpopulation of u03b1-cells.
a u2013 c LUXendin645 labeling is widespread throughout the intact islet, co-localizing predominantly with u03b2-cells a and u03b4-cells b , but less so with u03b1-cells c stained for insulin (INS), s...
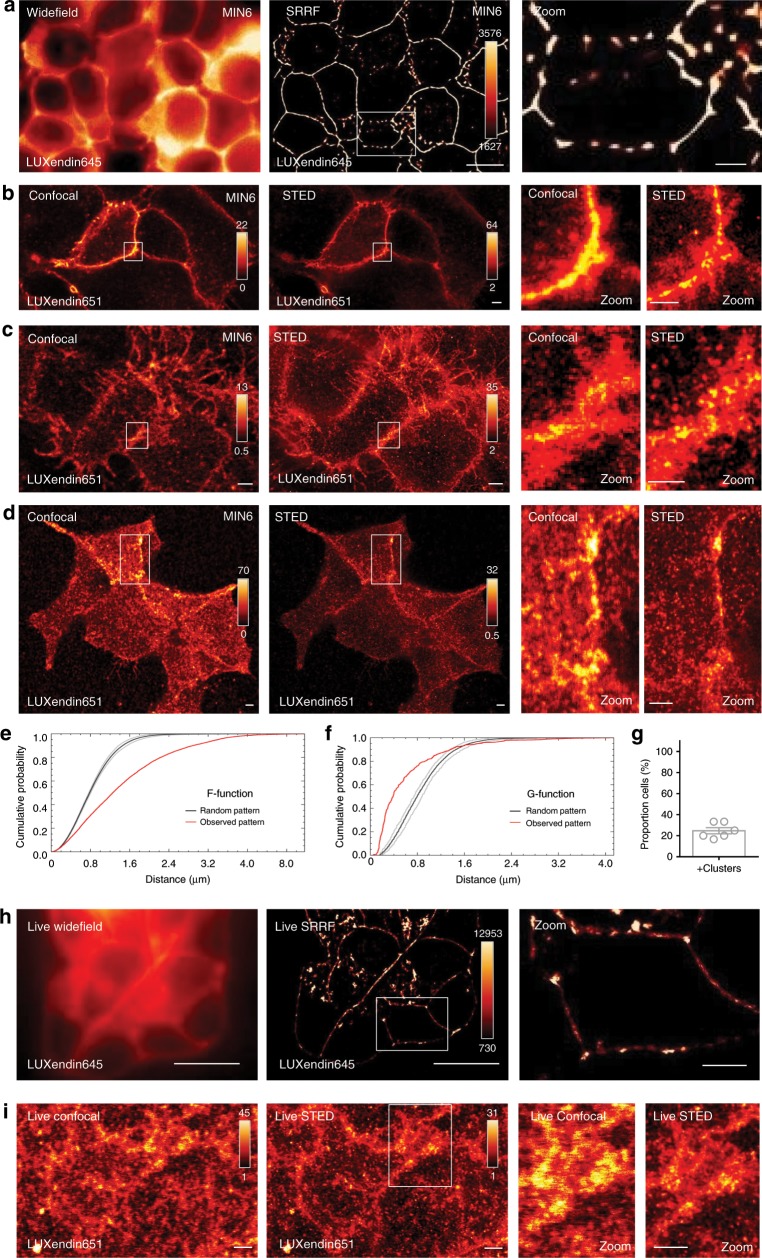
Fig. 5
LUXendin651 and LUXendin645 allow nanoscopic detection of GLP1R.
a LUXendin645 allows super-resolution snapshots of MIN6 u03b2-cells using widefield microscopy combined with super-resolution radial fluctuations (SRRF) (representative image from n =u20098 images, th...
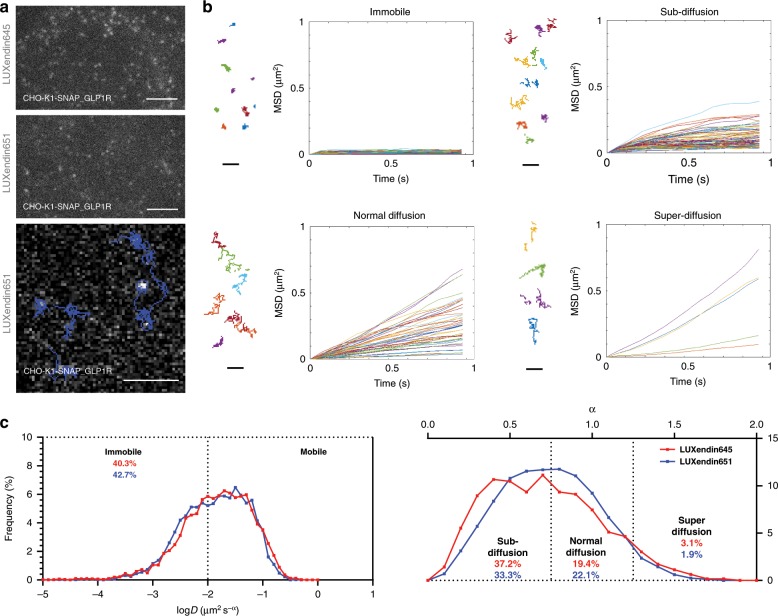
Fig. 6
LUXendin645 and LUXendin651 allow single molecule GLP1R imaging.
a Representative single molecule microscopy images showing tracking of LUXendin645 - and LUXendin651 -labeled GLP1R at or close to the membrane (scale baru2009=u20093u2009u00b5m). b Mean square displa...
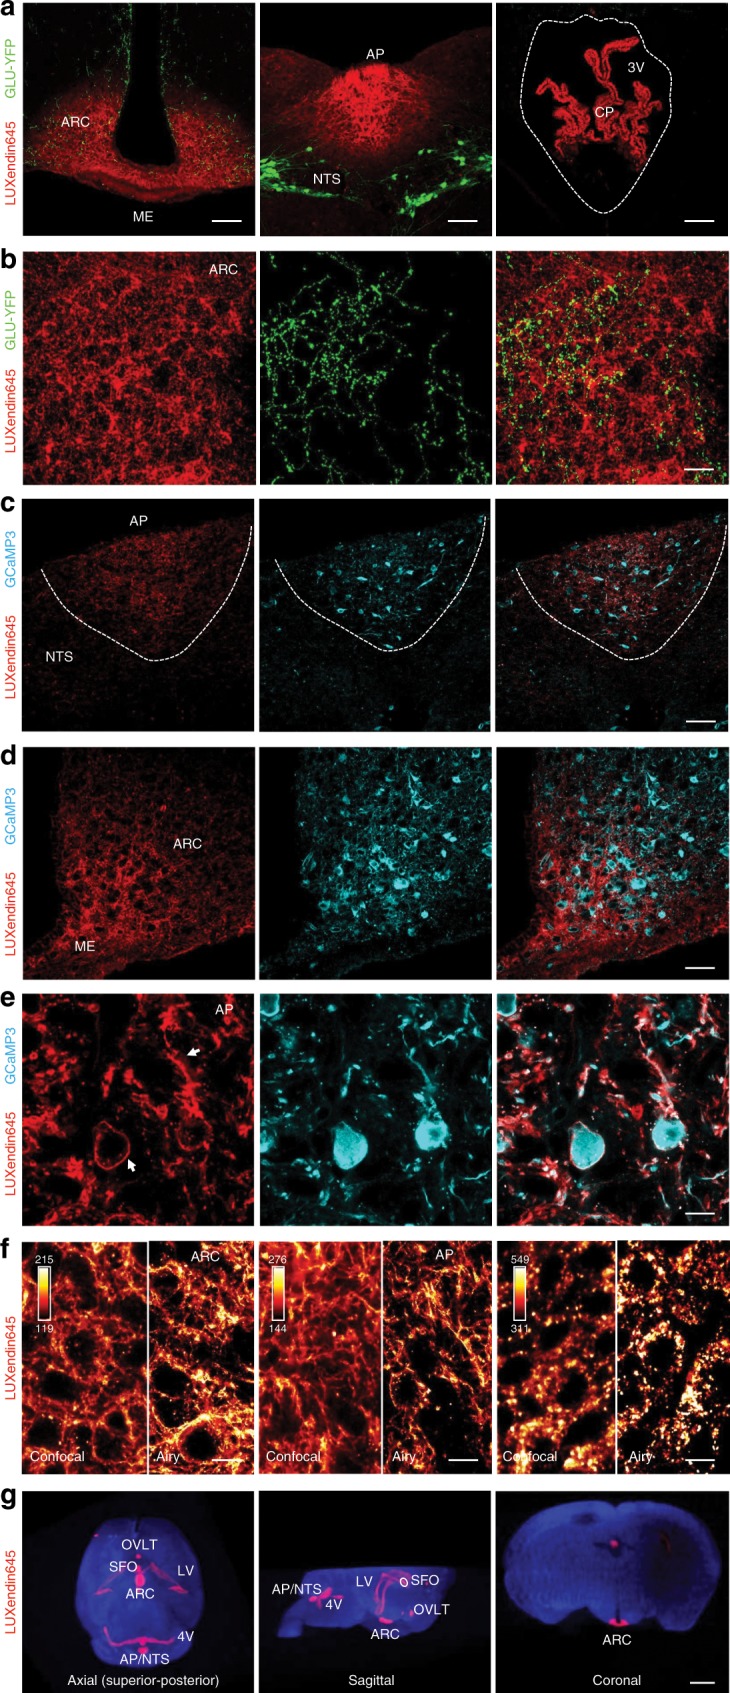
Fig. 7
LUXendin645 highlights GLP1R-expressing neurons in the brain.
a LUXendin645 labeling is detected in the the median eminence (ME), arcuate nucleus (ARC), area postrema (AP)/nucleus tractus solitaris (NTS), and choroid plexus (CP), in close association with GLP1-p...
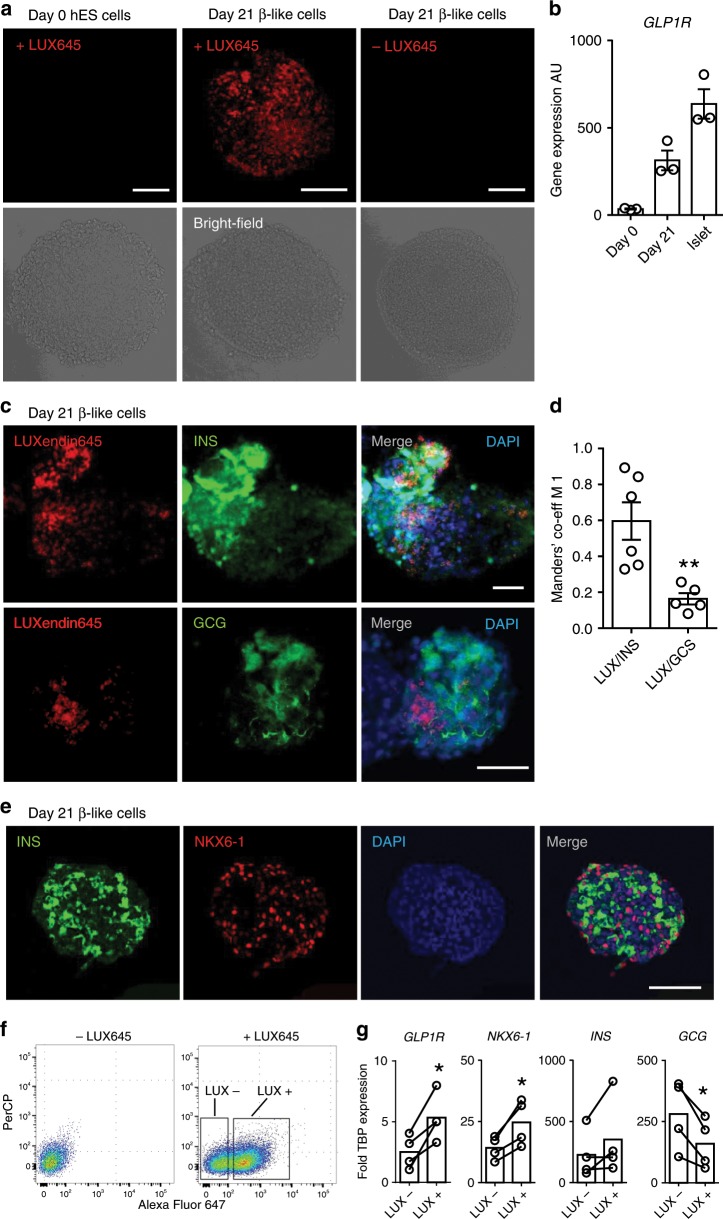
Fig. 8
LUXendin645 labels human ESC-derived u03b2-like cells.
a LUXendin645 (LUX645)u00a0labels u03b2-like cells in intact spheroids, which were differentiated and cultured for 21 days. No signal is detected in undifferentiated human ES cells (day 0) or unlabell...
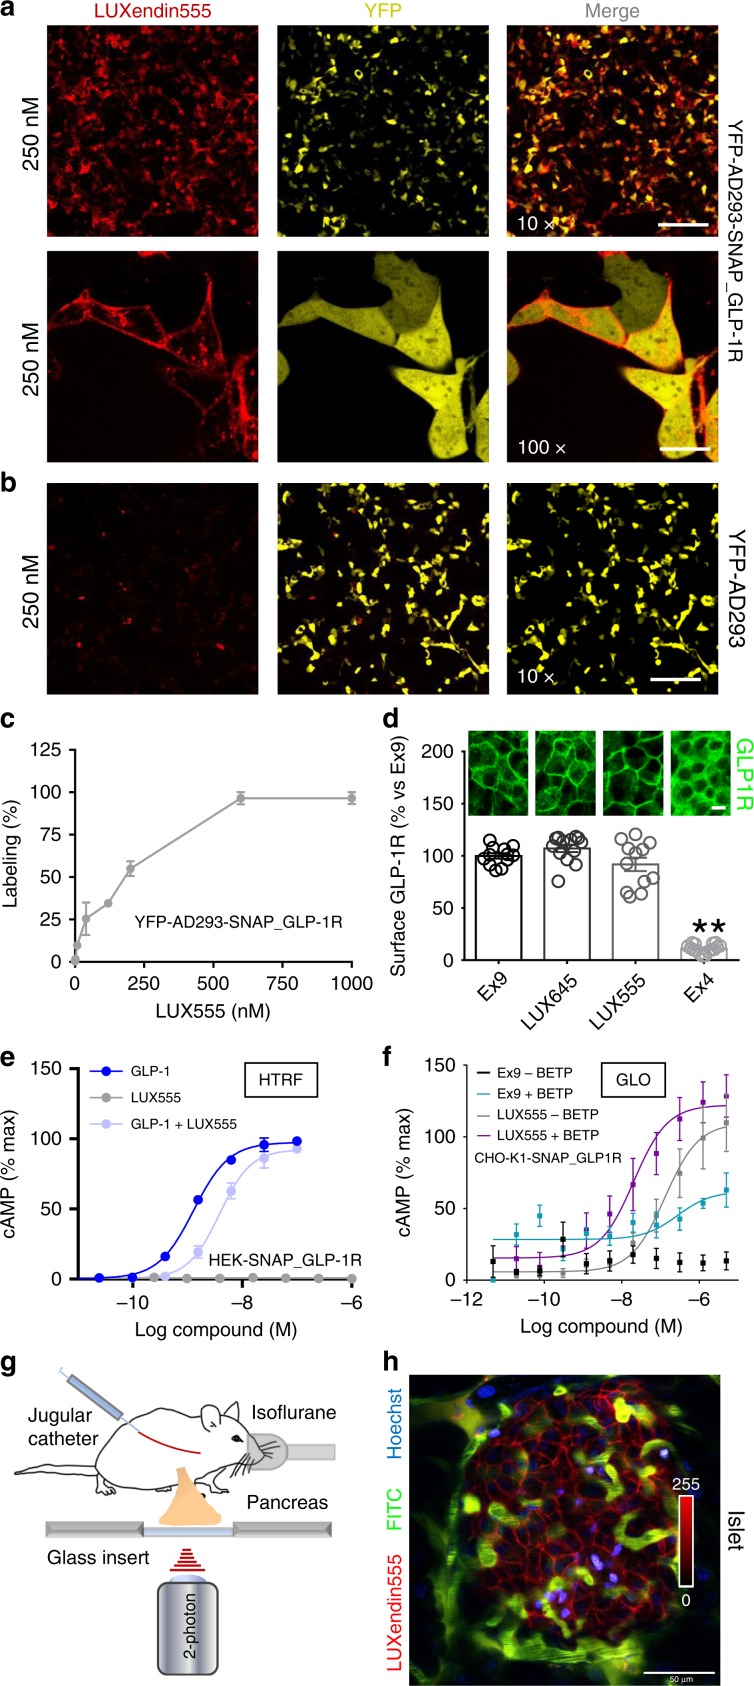
Fig. 9
LUXendin555 allows in vivo labeling of islets.
a u2013 c LUXendin555 labels YFP-AD293_SNAP-GLP1R a but not YFP-AD293 b controls with max labeling at 600u2009nM c ( n =u20093 independent assays) (u00d710 scale baru2009=u2009213u2009u00b5m; u00d7100...
Figure images are served from the NIH/NLM PubMed Central Open Access Subset or Europe PMC; copyright remains with the publishers and authors.
💬 Discussion
0 commentsNo comments yet. Be the first to start a discussion!
Leave a Comment