Abstract
Developments in microscopy have been instrumental to progress in the life sciences, and many new techniques have been introduced and led to new discoveries throughout the last century. A wide and diverse range of methodologies is now available, including electron microscopy, atomic force microscopy, magnetic resonance imaging, small-angle x-ray scattering and multiple super-resolution fluorescence techniques, and each of these methods provides valuable read-outs to meet the demands set by the samples under study. Yet, the investigation of cell development requires a multi-parametric approach to address both the structure and spatio-temporal organization of organelles, and also the transduction of chemical signals and forces involved in cell-cell interactions. Although the microscopy technologies for observing each of these characteristics are well developed, none of them can offer read-out of all characteristics simultaneously, which limits the information content of a measurement. For example, while electron microscopy is able to disclose the structural layout of cells and the macromolecular arrangement of proteins, it cannot directly follow dynamics in living cells. The latter can be achieved with fluorescence microscopy which, however, requires labelling and lacks spatial resolution. A remedy is to combine and correlate different readouts from the same specimen, which opens new avenues to understand structure-function relations in biomedical research. At the same time, such correlative approaches pose new challenges concerning sample preparation, instrument stability, region of interest retrieval, and data analysis. Because the field of correlative microscopy is relatively young, the capabilities of the various approaches have yet to be fully explored, and uncertainties remain when considering the best choice of strategy and workflow for the correlative experiment. With this in mind, the Journal of Physics D: Applied Physics presents a special roadmap on the correlative microscopy techniques, giving a comprehensive overview from various leading scientists in this field, via a collection of multiple short viewpoints.
🔬 Techniques
🧬 Organisms
✨ Fluorophores
🧪 Sample Preparation
🔬 Cell Lines
🏭 Microscope Brands
📷 Detectors
💻 Code & Software
💾 Data Repositories
🏛️ Research Organizations (ROR)
Affiliated research institutions:
📊 Figures
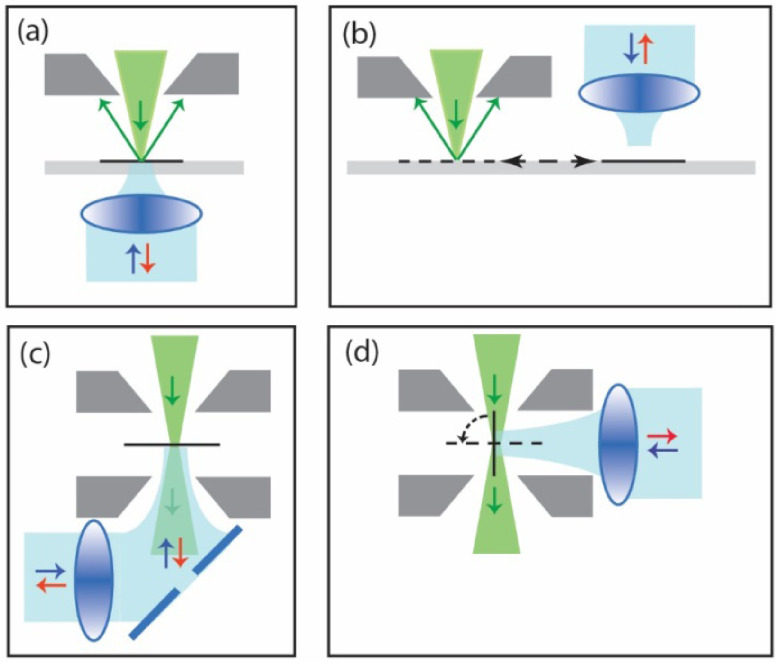
Figure 1.
Schematic indication of realizations for integrated LM inside ((a), (b)) scanning or ((c), (d)) transmission EMs. Designs can be distinguished based on whether ((a), (c)) both microscopes share the sa...
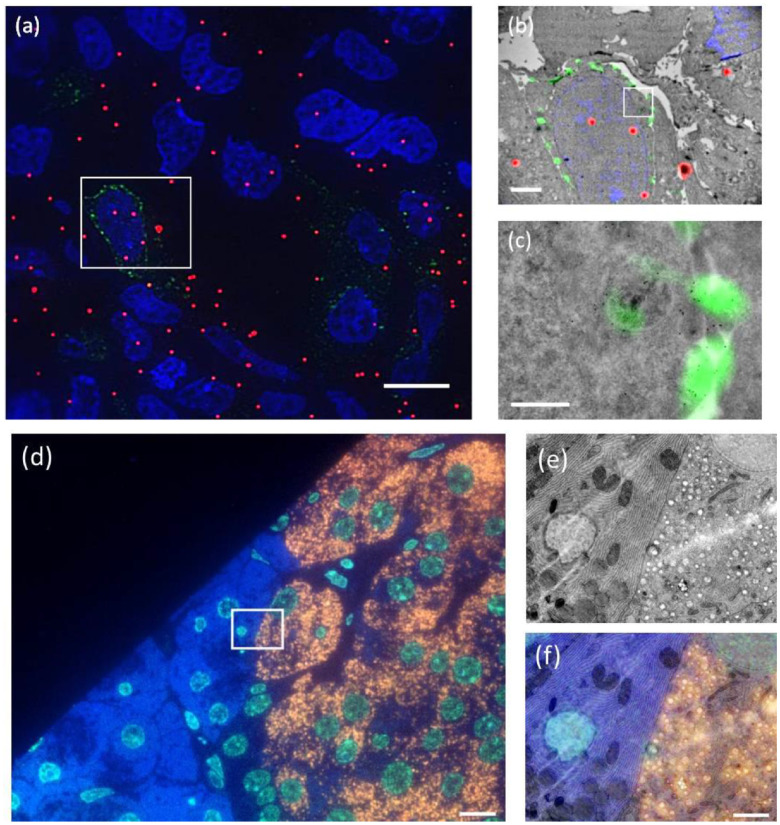
Figure 2.
Examples of (a)u2013(c) fiducial and (d)u2013(f) non-fiducial based image registration in integrated microscopes. (a) FM image in TEM (implementation according to figure 1(d) ) of Tokuyasu sections of...
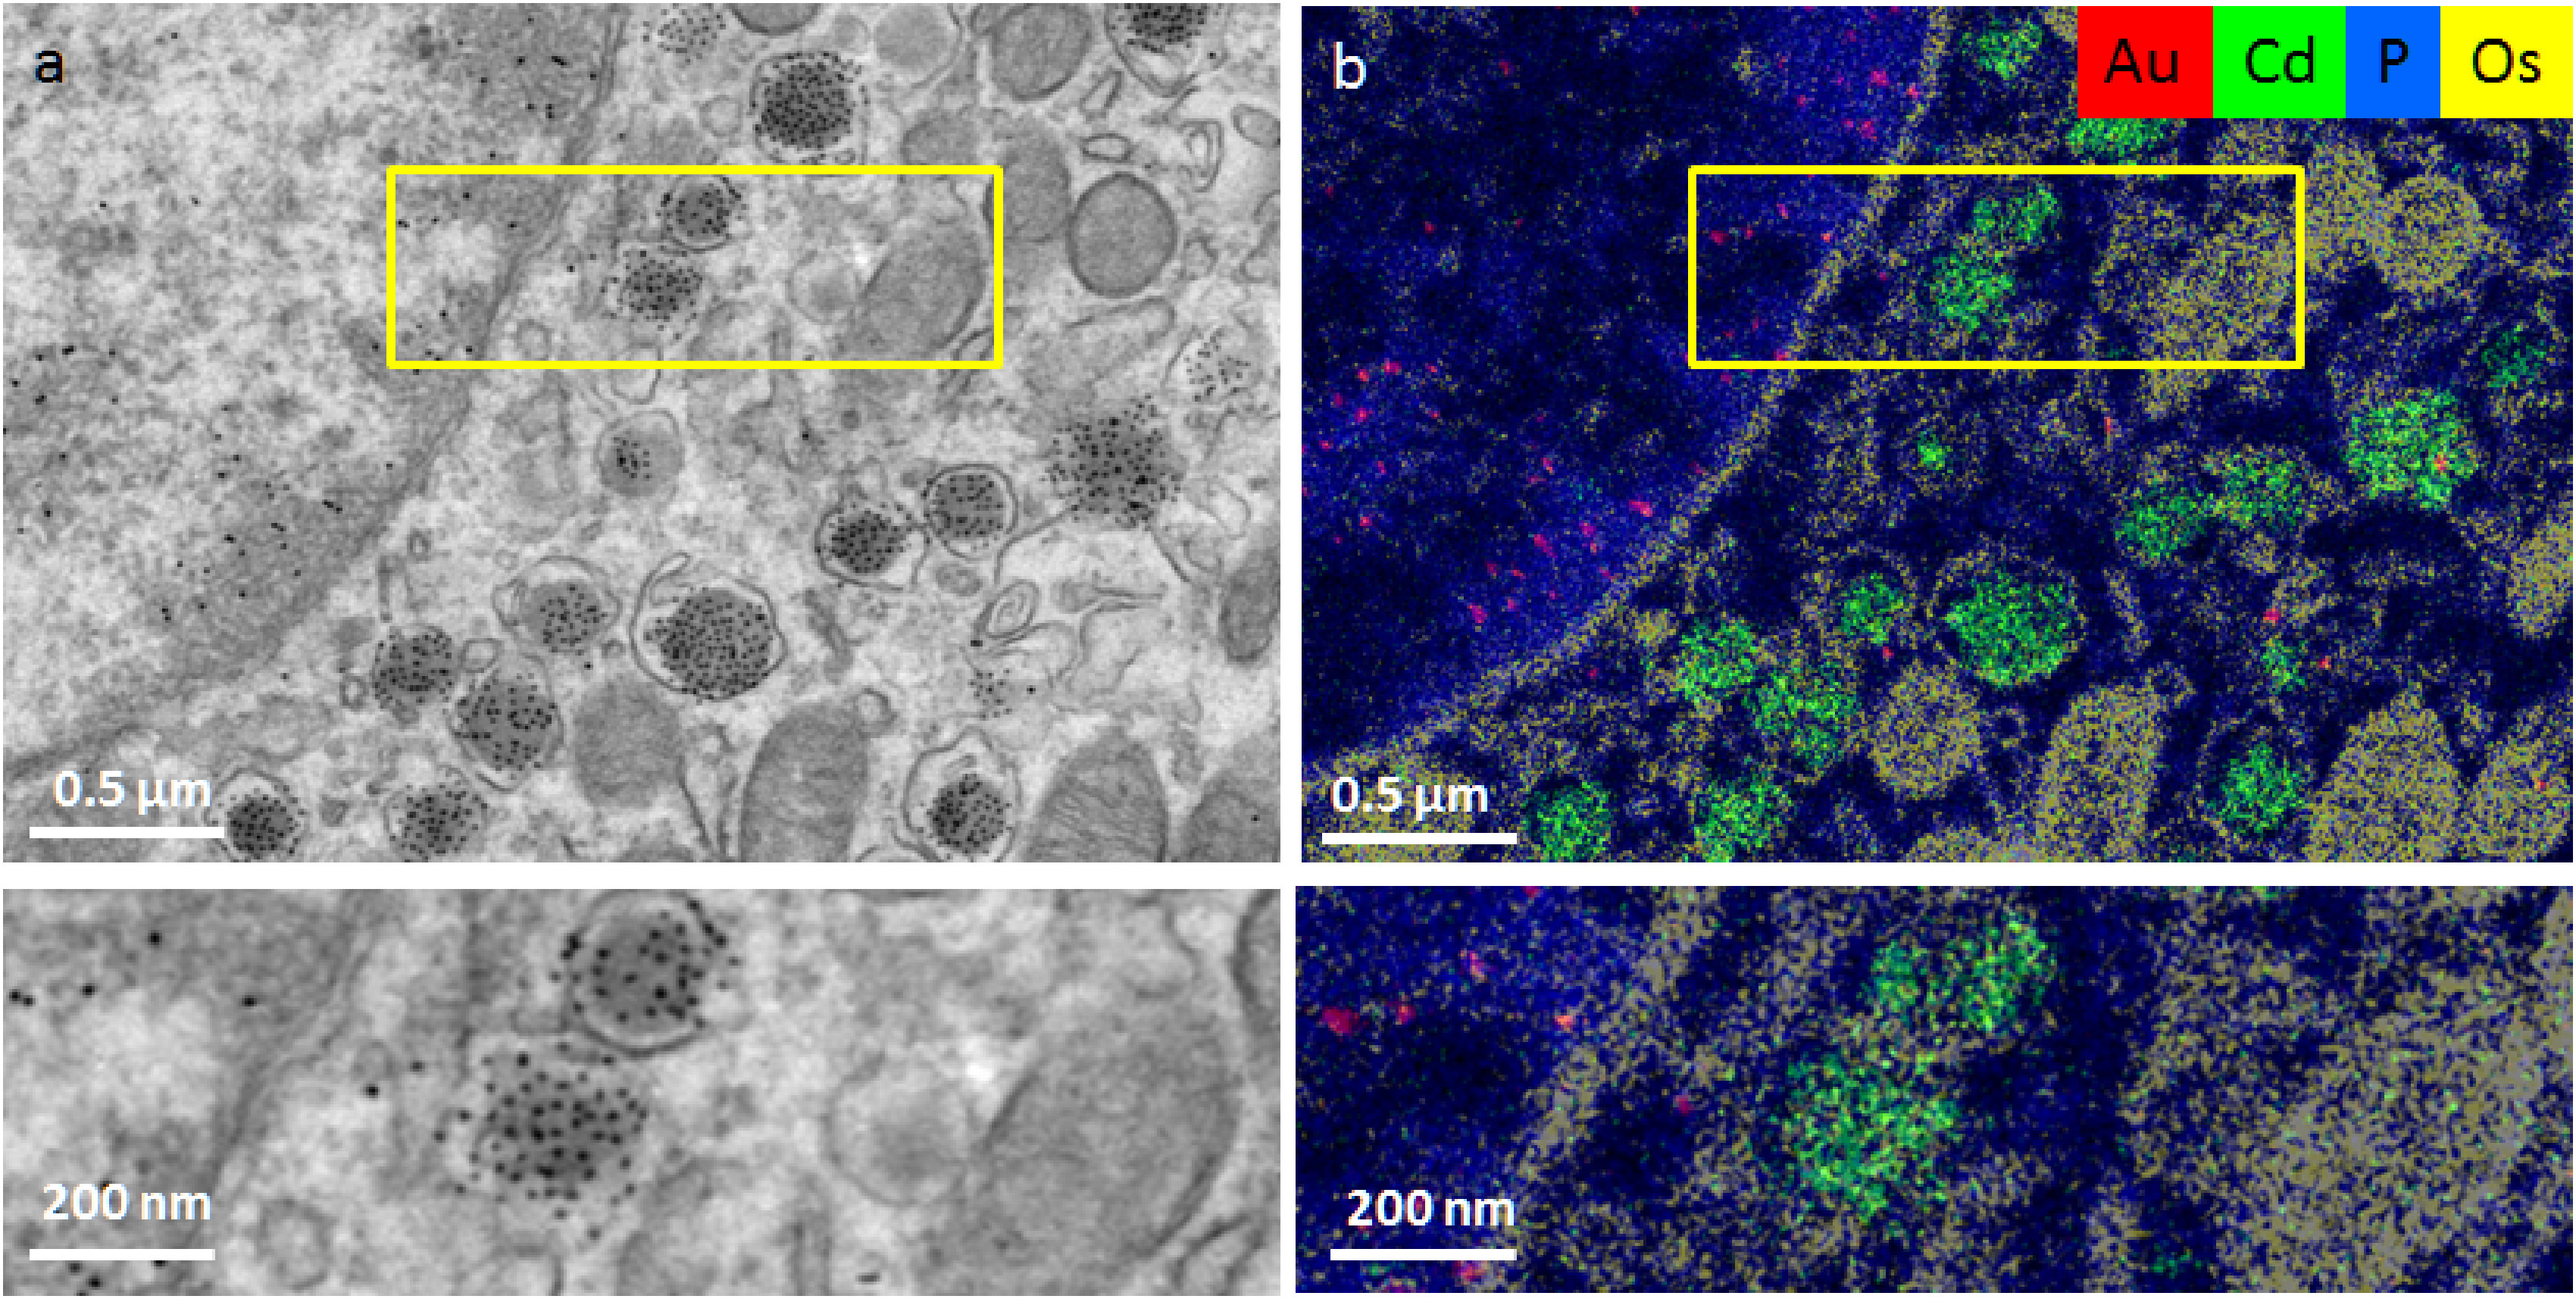
Figure 3.
u2018ColorEMu2019 using elemental analysis by energy dispersive x-ray imaging. ColorEM: label-free (P), paint (Os) and labeling DNA (Au) and peptides (Cd) is compatible. (a) Part of an islet of Langer...
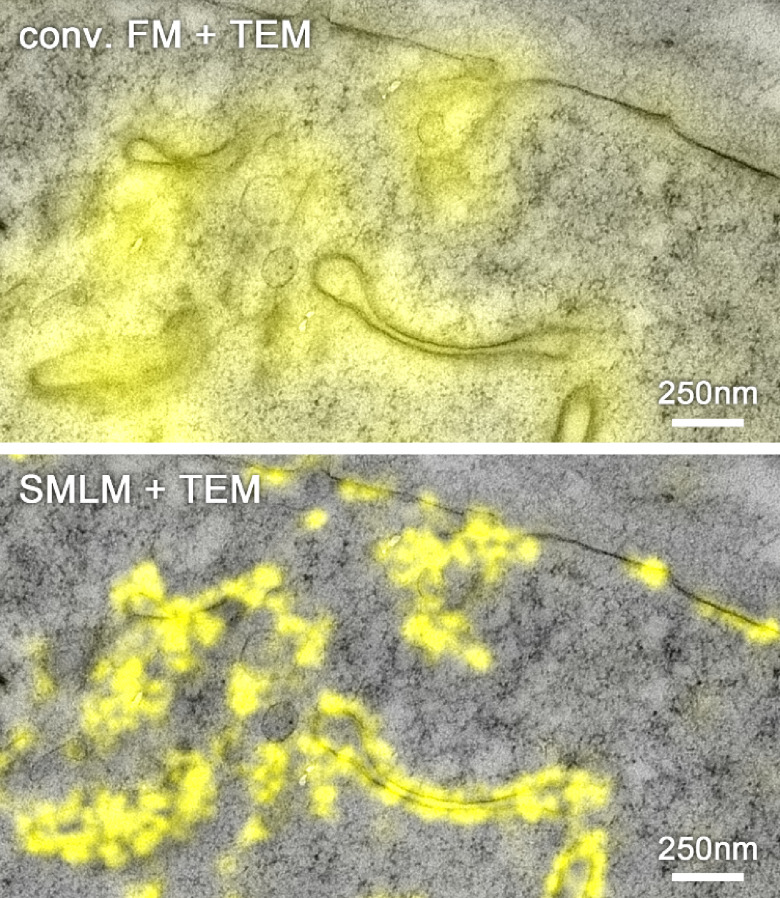
Figure 4.
Overlay of fluorescence signal of mVenus-labelled EphA2 protein imaged by conventional FM (top) and super-resolution single molecule localization microscopy (SMLM) (bottom) with a TEM image in a freez...
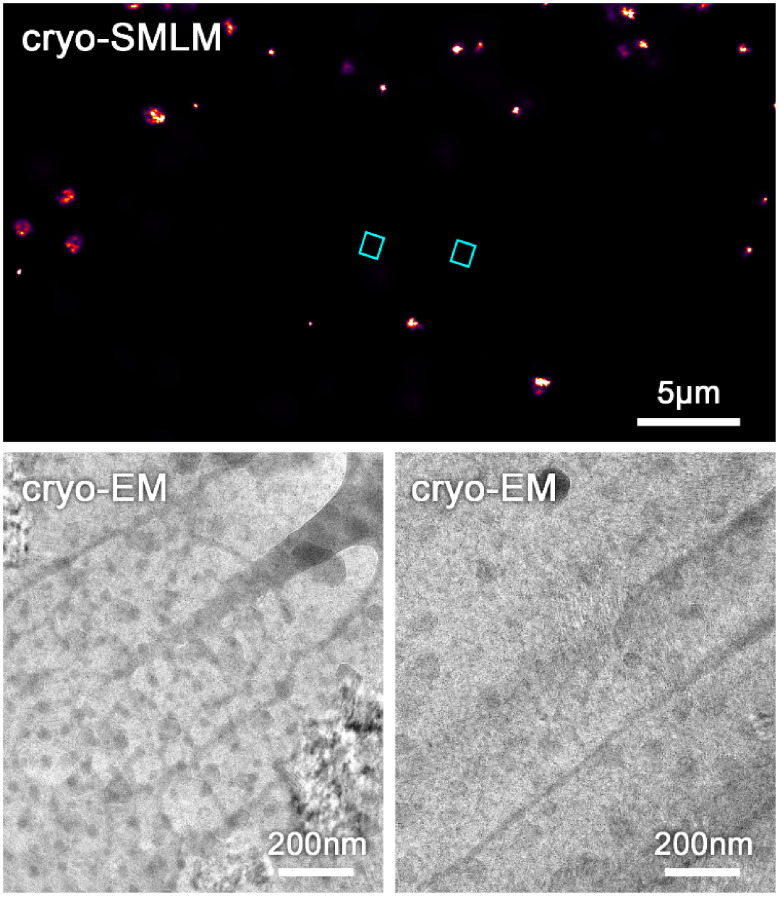
Figure 5.
Top: cryo-SMLM of a mitochondrial protein labelled with clover in a whole vitrified COS7 cell before thinning by focused ion beam milling (for method see [ 12 ]). For cryo-SMLM a laser intensity of ap...
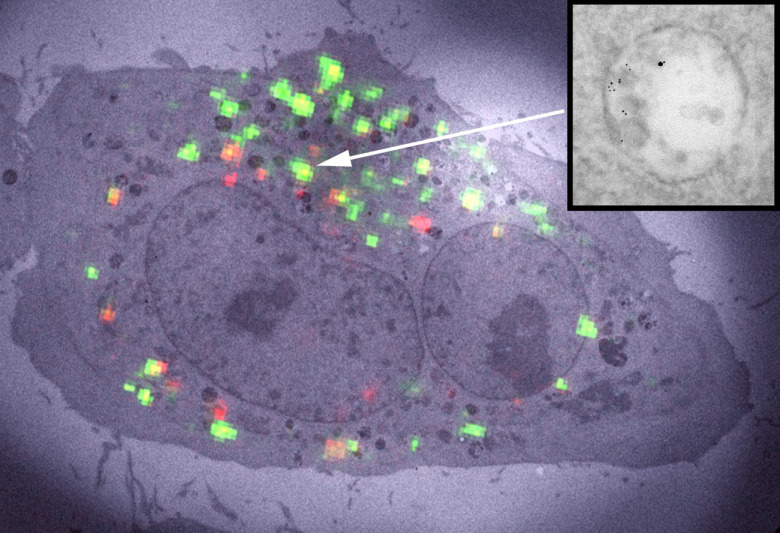
Figure 6.
Example of a mismatch between fluorescence and gold coupling to proteins of interest. Epidermal growth factor coupled to Alexa488 and 10u2009nm gold particles internalised into HeLa cells shows bright...
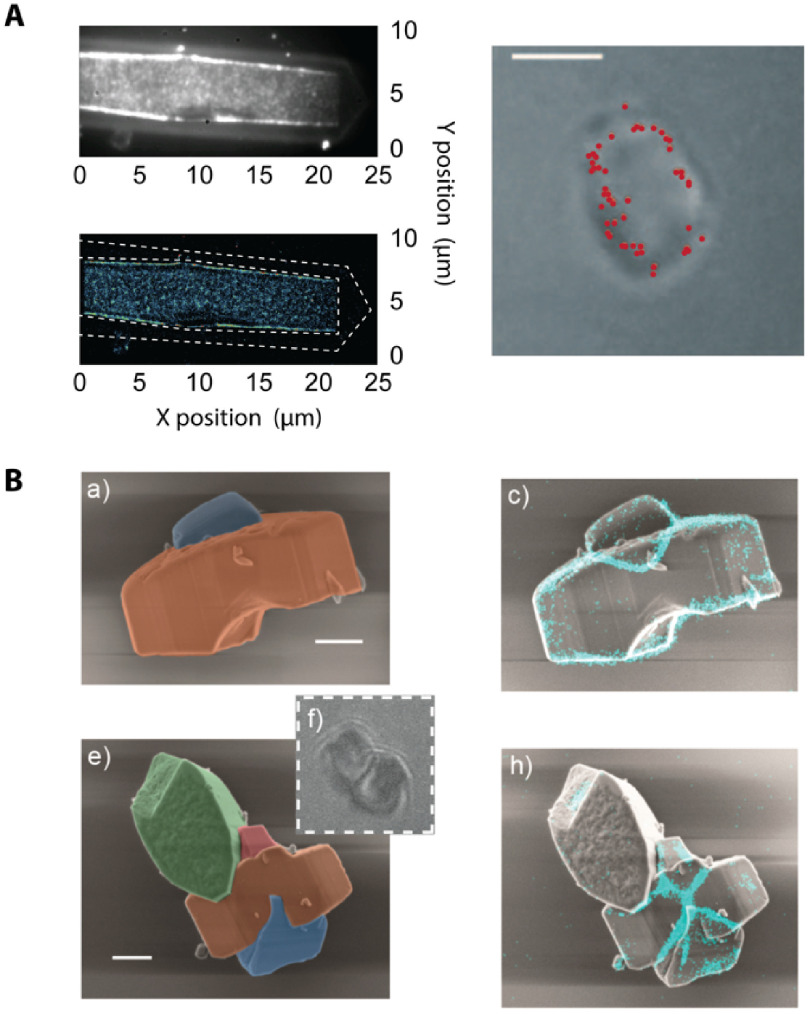
Figure 7.
(A) When studying catalyst materials, optical microscopy can be used to visualize chemical events, e.g. using fluorogenic reagents (top left). By carefully tuning reaction conditions, the locations of...
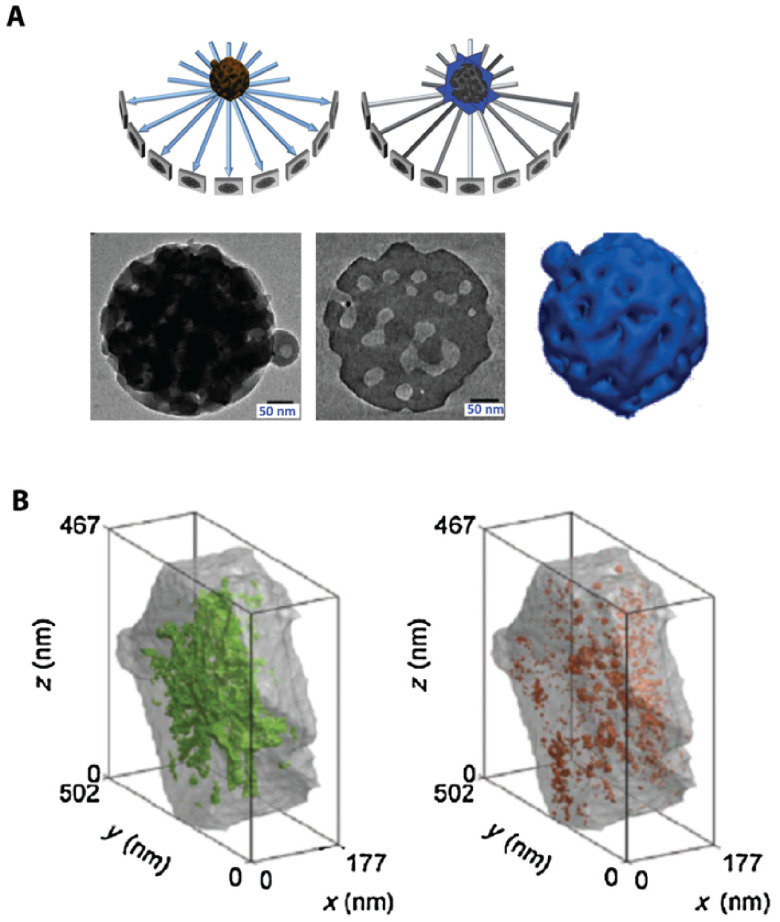
Figure 8.
(A) The principle of ET. (B) ET allows the open (green) and closed (orange) mesopore volume in a zeolite Y crystal to be quantified. Reprinted from [ 54 ], Copyright 2015, with permission from Elsevie...
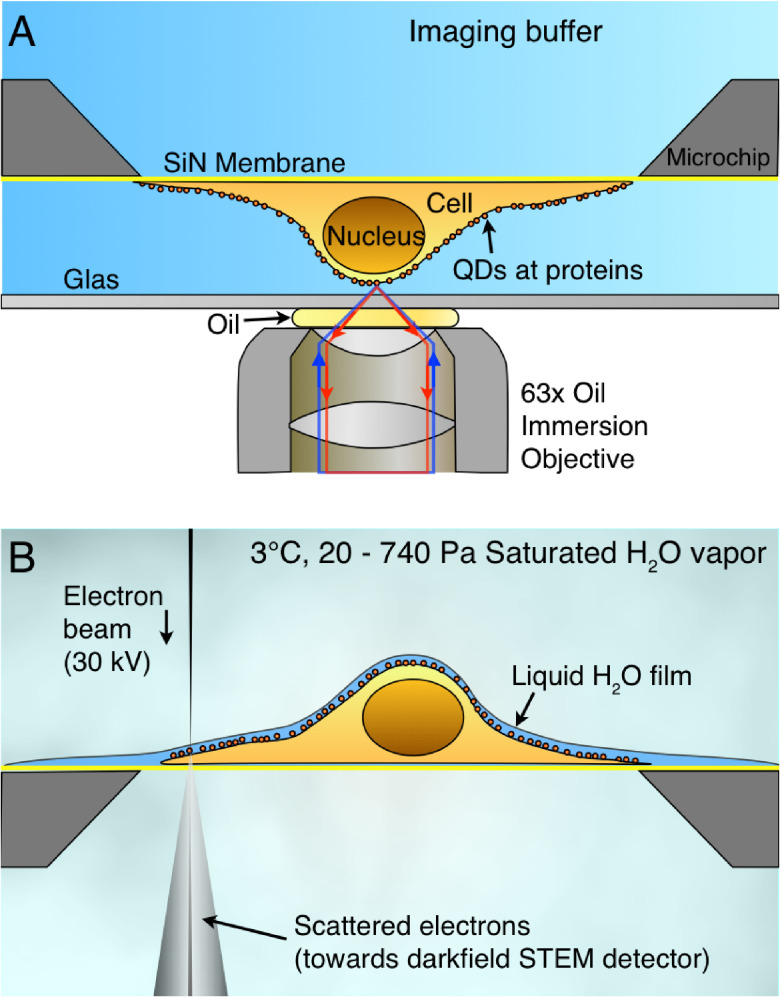
Figure 9.
Correlative microscopy of membrane proteins in whole cells in liquid. (A) Cells are grown on a silicon nitride (SiN) membrane, supported by a silicon chip. A microchip with quantum dot (QD) labelled a...
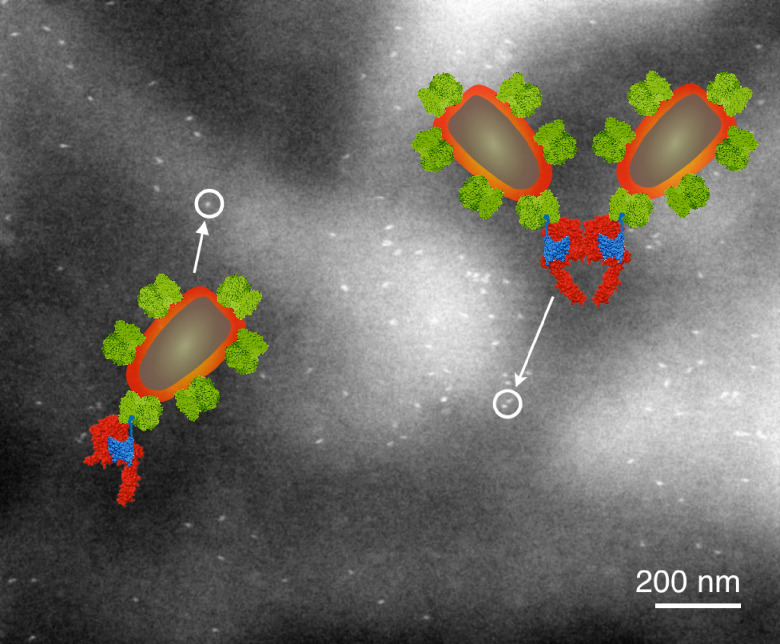
Figure 10.
Liquid-phase ESEM-STEM image of a membrane region of a breast cancer cell showing the locations of HER2 receptors labelled with QDs. The overlay shows molecular models of the HER receptor with label c...
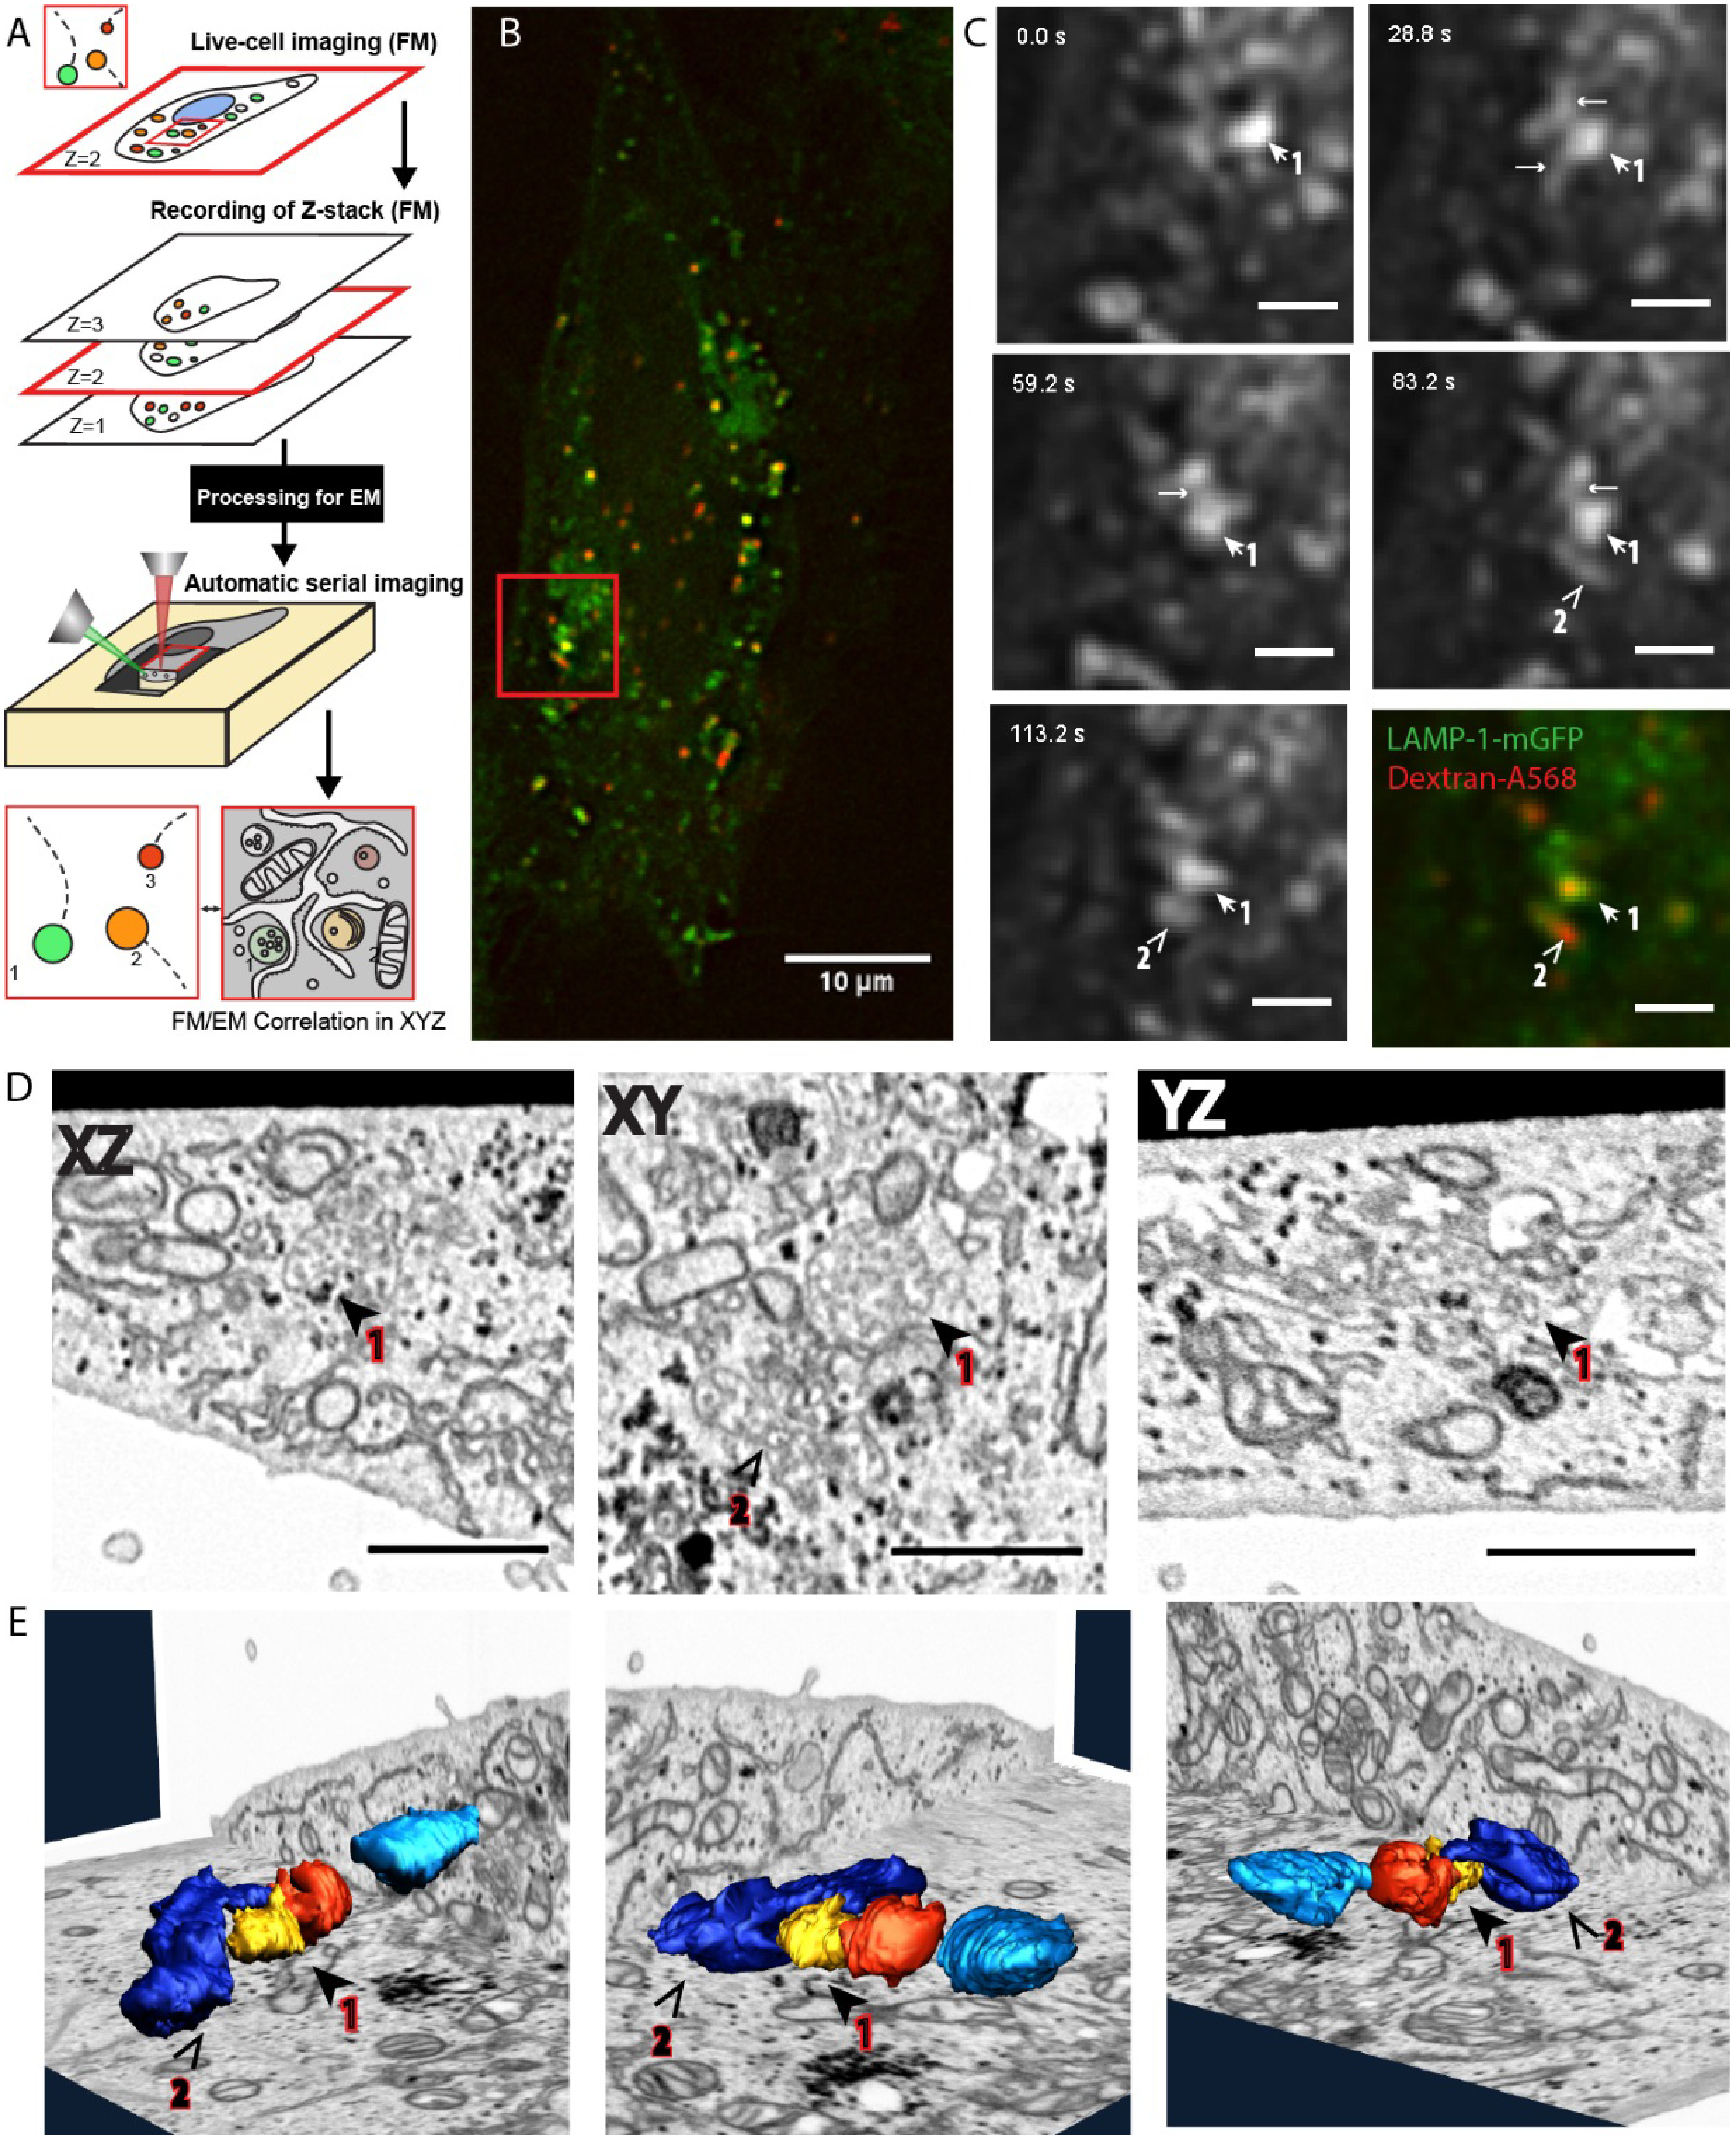
Figure 11.
Volume-CLEM providing a direct link between live cell dynamics and 3D ultrastructure on the single organelle level [ 82 ]. (A) Schematic representation of the complete live-cell fluorescence to volume...
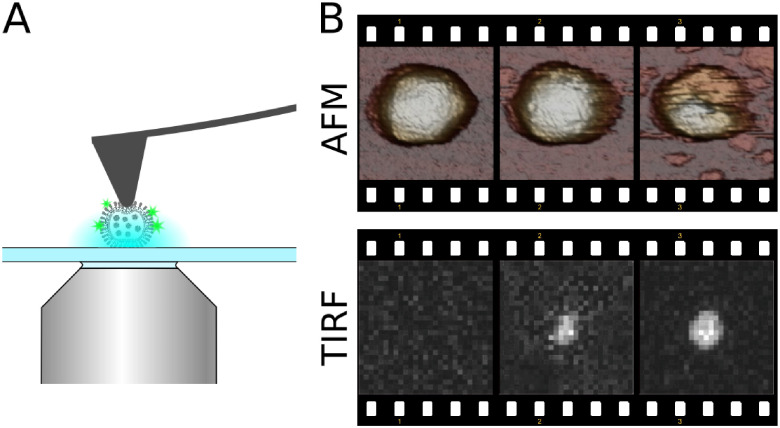
Figure 12.
(A) A schematic of a simultaneous force spectroscopy and single molecule fluorescence experiment on a virus. An AFM tip is used for both imaging and manipulation purposes at the nanoscale. The molecul...
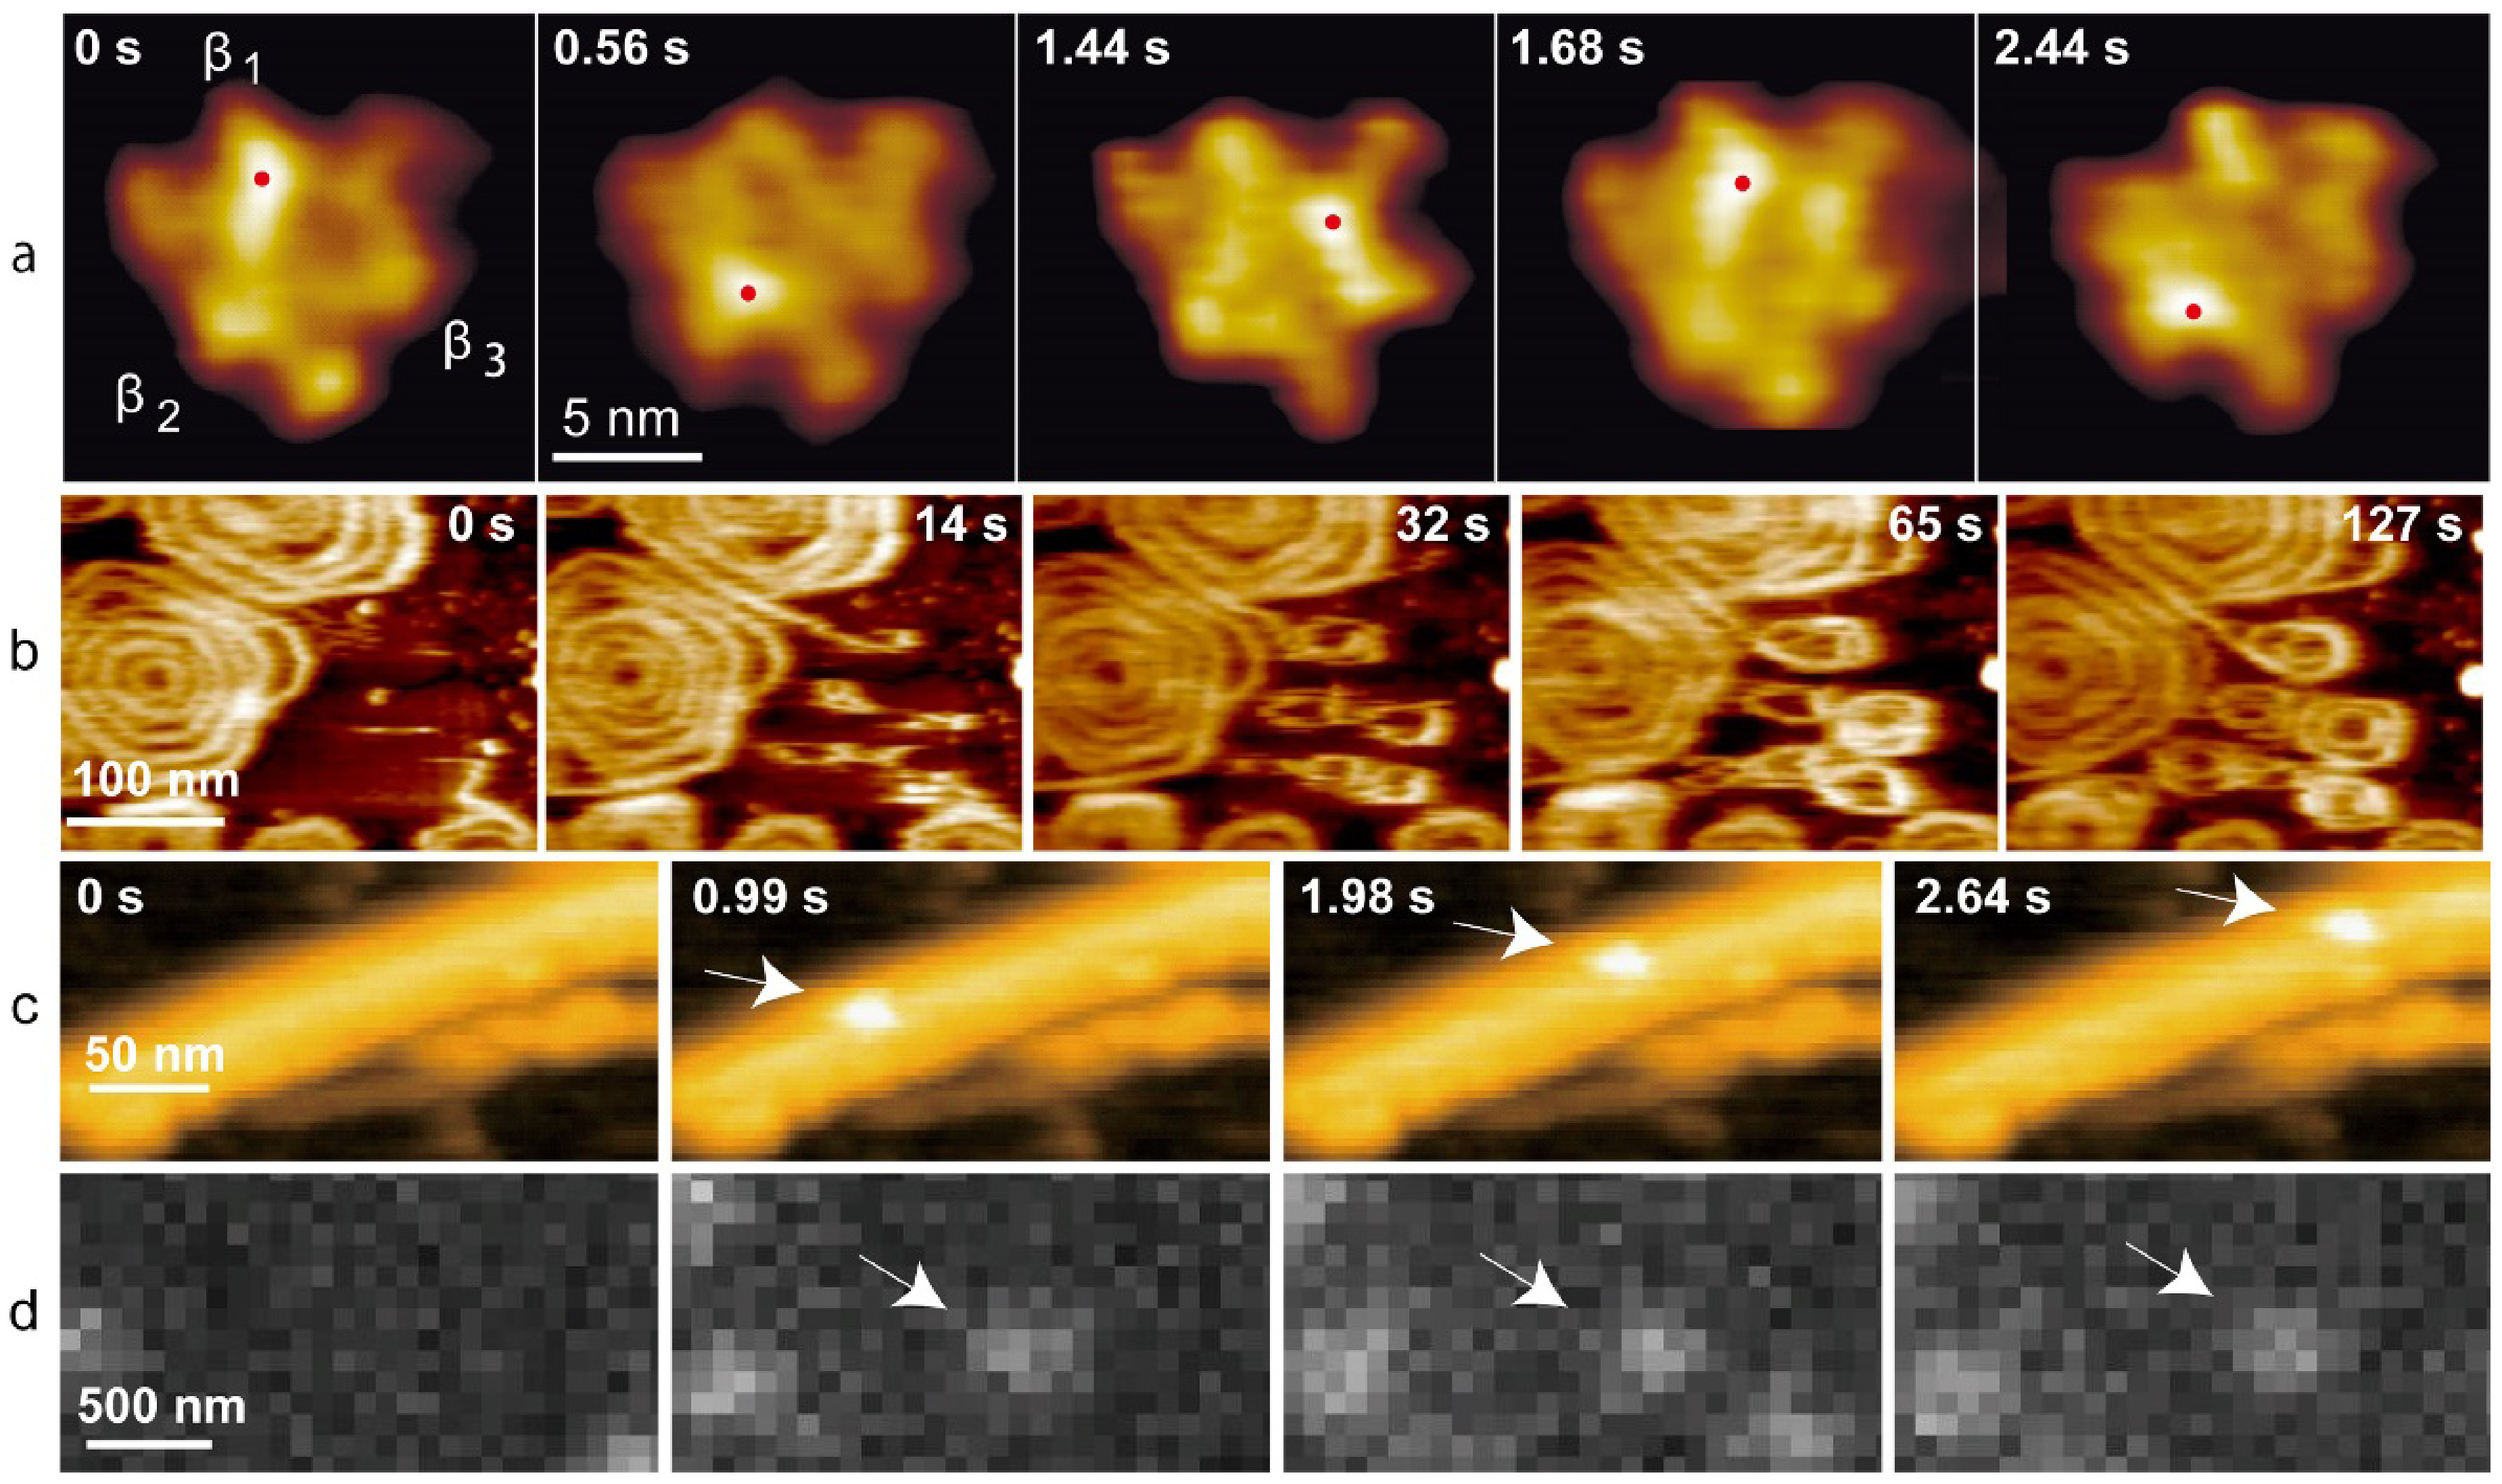
Figure 13.
(a) HS-AFM images of u03b1 3 u03b2 3 subcomplex of F 1 -ATPase undergoing conformational changes in the presence of adenosine triphosphate (ATP). The height of a nucleotide-free u03b2 subunit is large...
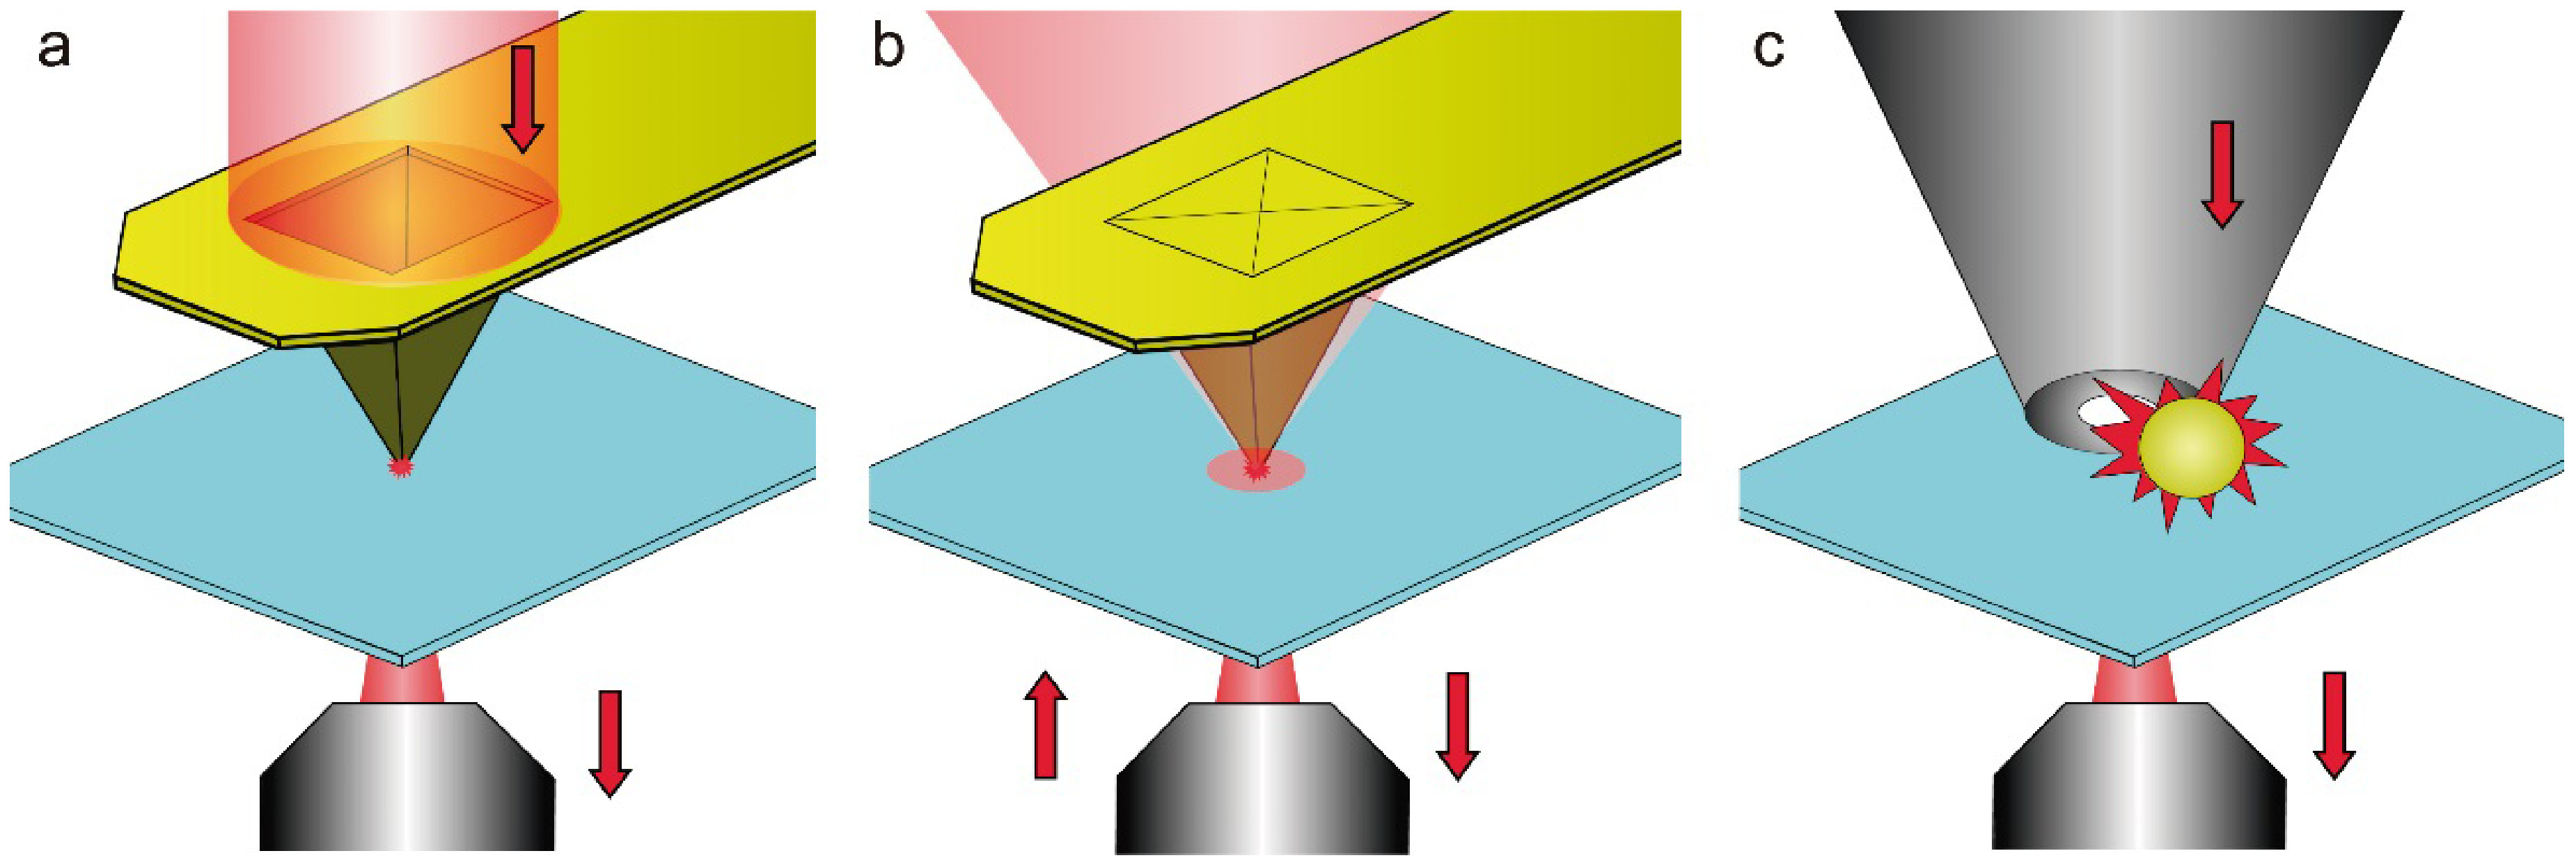
Figure 14.
Various configurations of cantilever-based NSOM. (a) Aperture NSOM relying on a specially designed cantilever chip. The tip has a small optical opening at the apex, where a localized evanescent light ...
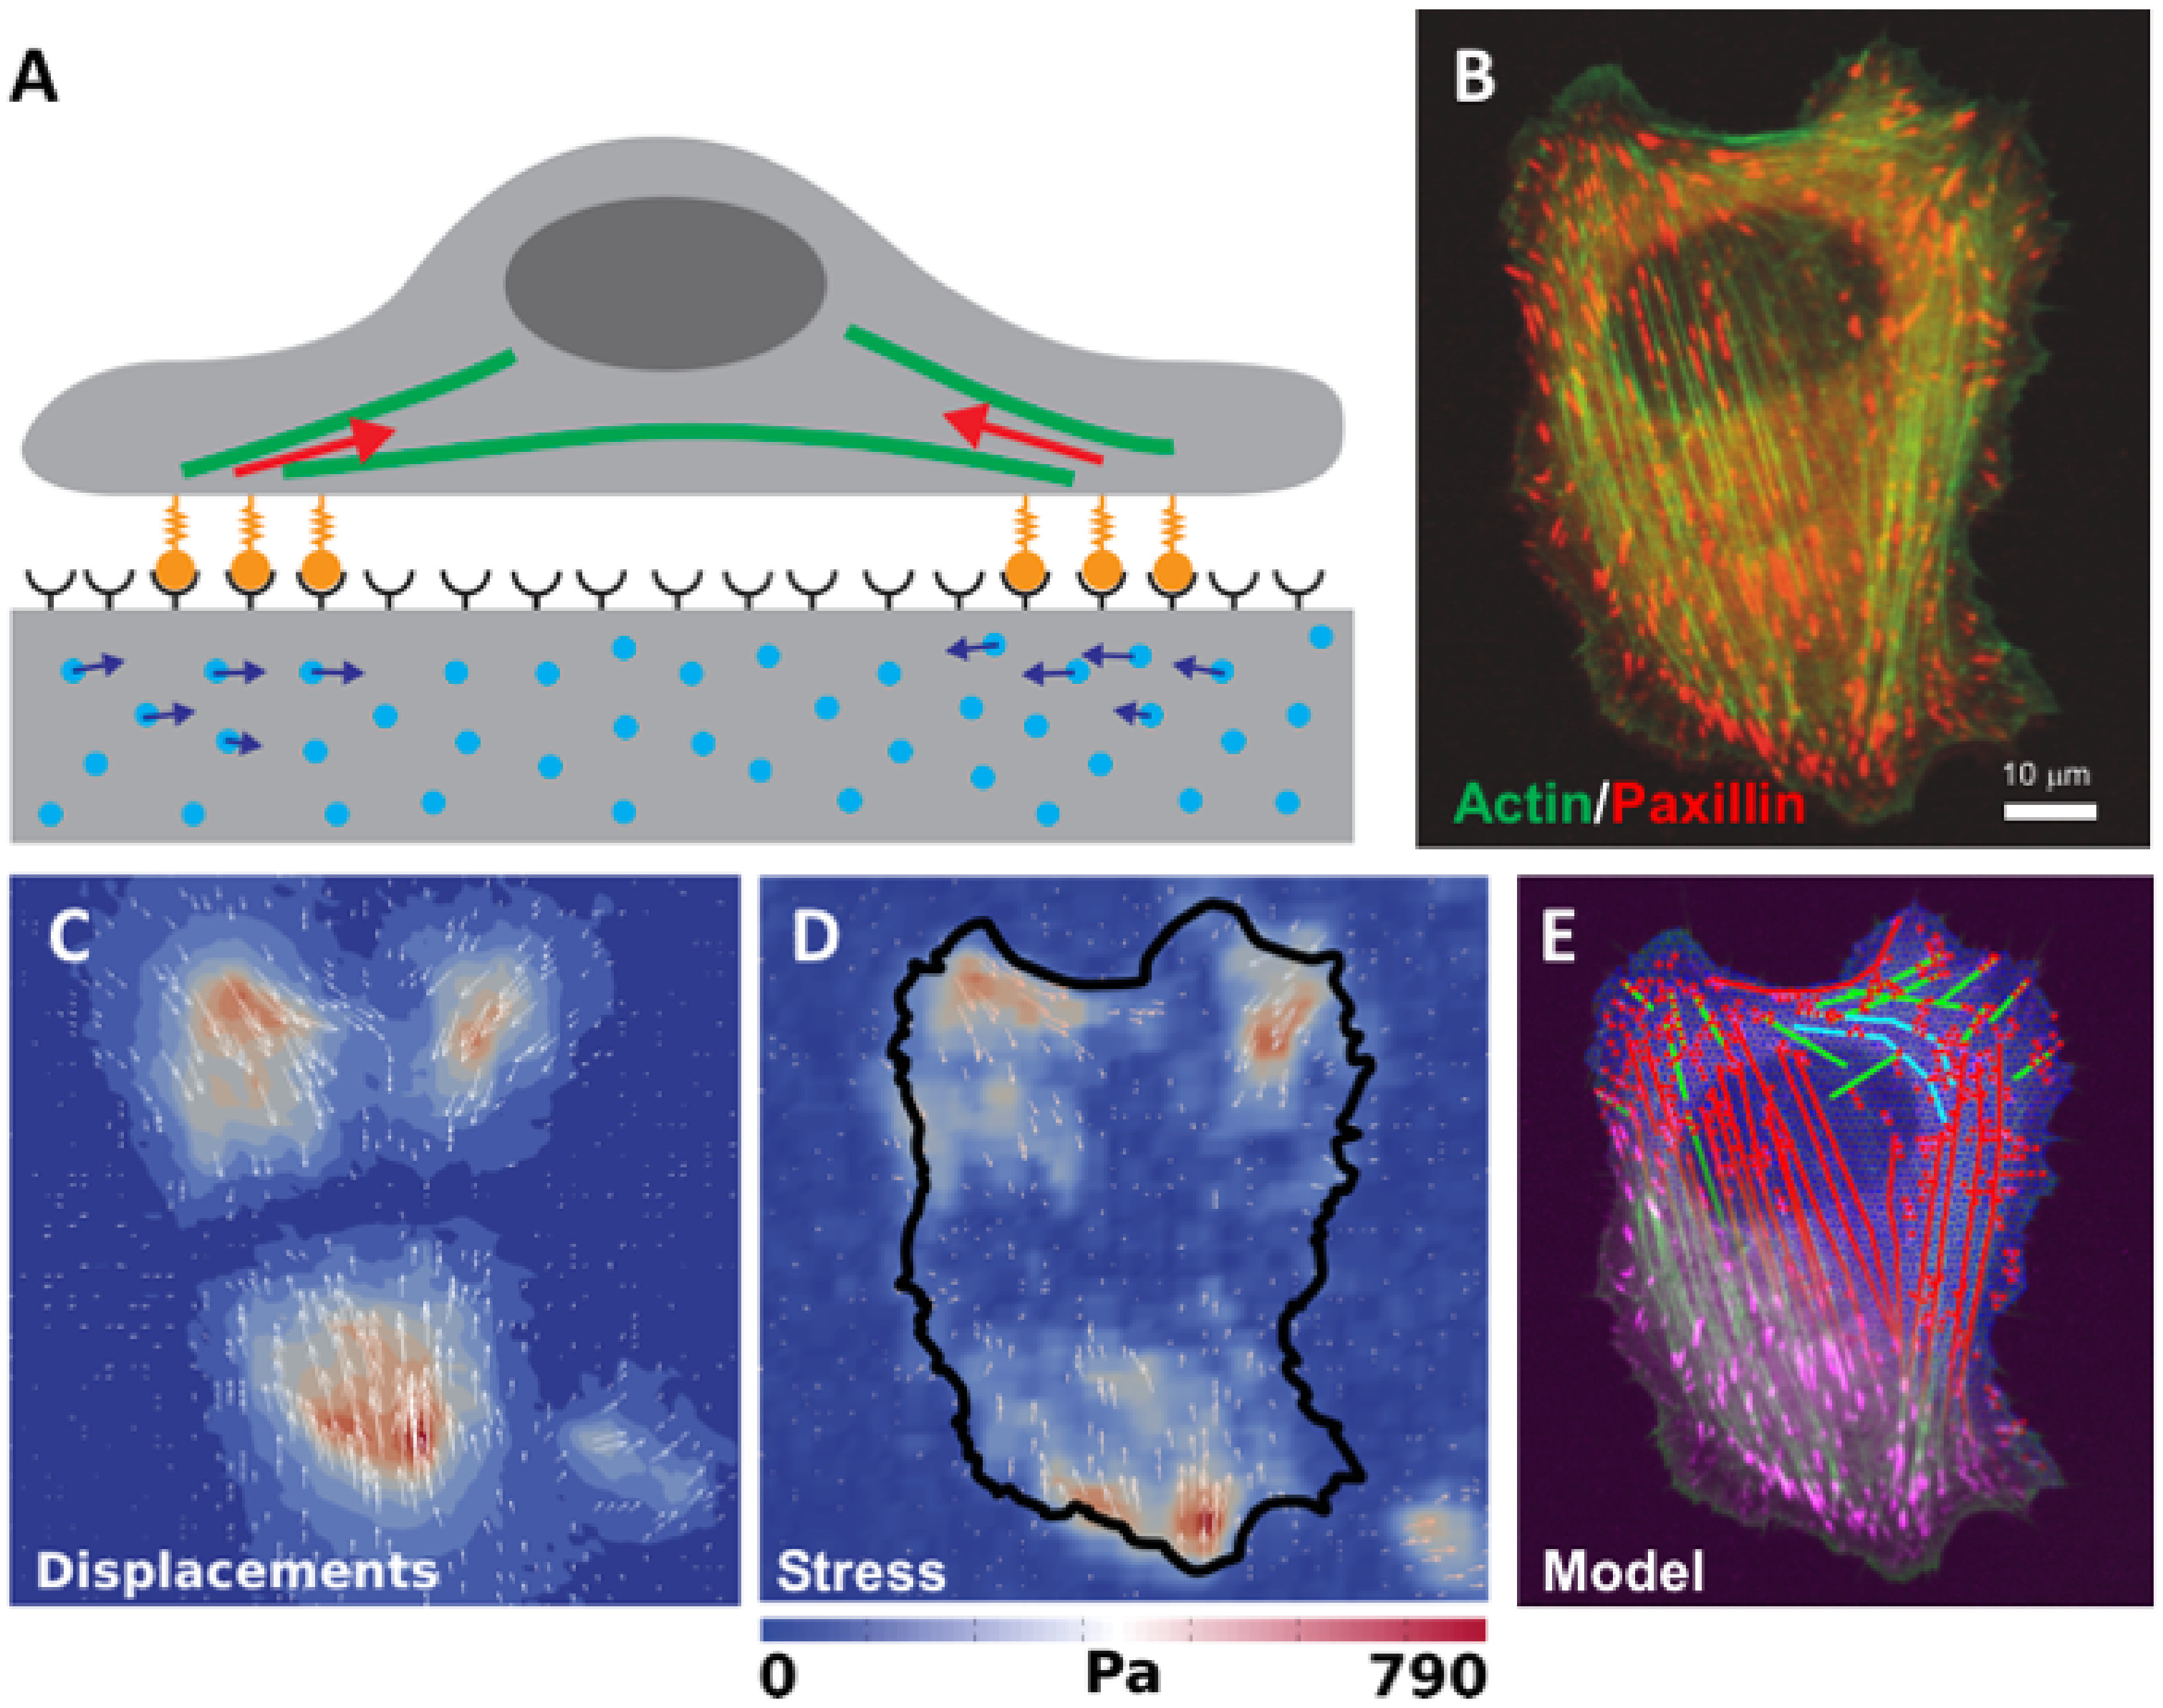
Figure 15.
2D TFM. (A) Movement of marker beads in the flat elastic substrate are converted into an estimate of the cellular forces at adhesion sites. (B) An adherent U2OS-cell has many adhesion sites (marked by...
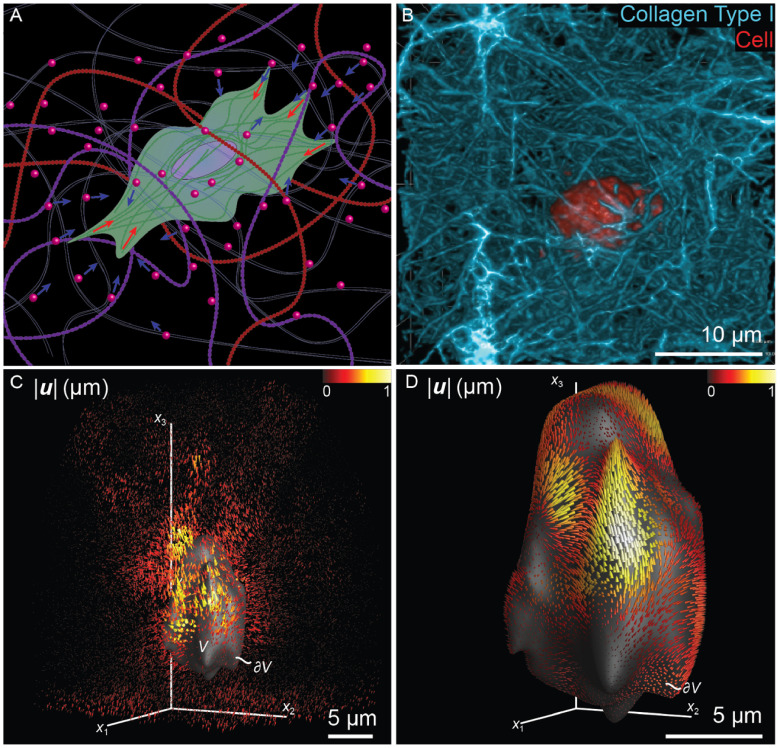
Figure 16.
3D TFM. (A) Movement of marker beads in a 3D soft matrix are converted into an estimate of the 3D cellular displacements forces at adhesion sites. (B) A fully embedded human neutrophil (red) inside a ...
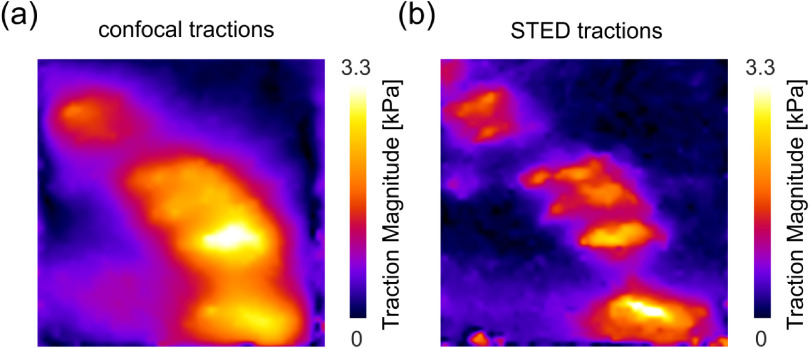
Figure 17.
STFM applied to HeLa cell focal adhesions. (a), (b) Traction magnitude calculated from the measured confocal (a) and STED (b) recordings of the bead displacements. Scale bars, 2 u00b5 m.
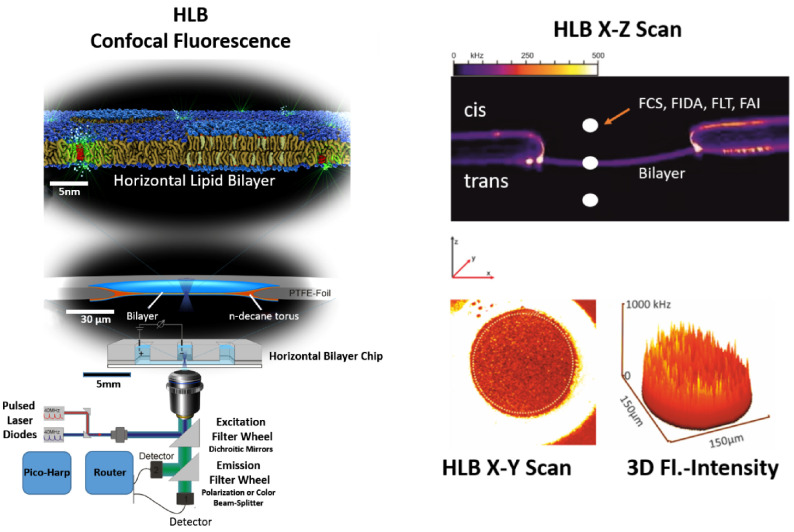
Figure 18.
Principal setup of a horizontal lipid bilayer (HLB) combined with a confocal scanning spectrometer allowing high resolution fluorescence imaging and spectroscopy [ 132 u2013 134 ].
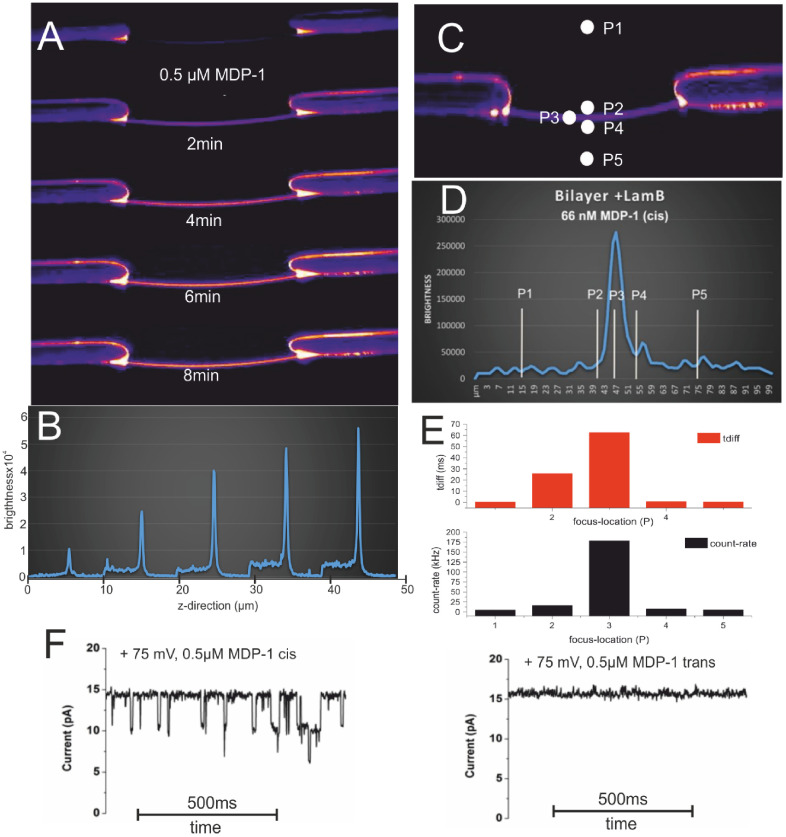
Figure 19.
(A) shows a stack of confocal x - z scans through a LamB containing bilayer (POPC/POPE/POPS 8:1:1) after addition of 60u2009nM MDP-1 (cis side, buffer symmetrical (cis/trans) 1 M KCl 10u2009mM HEPES p...
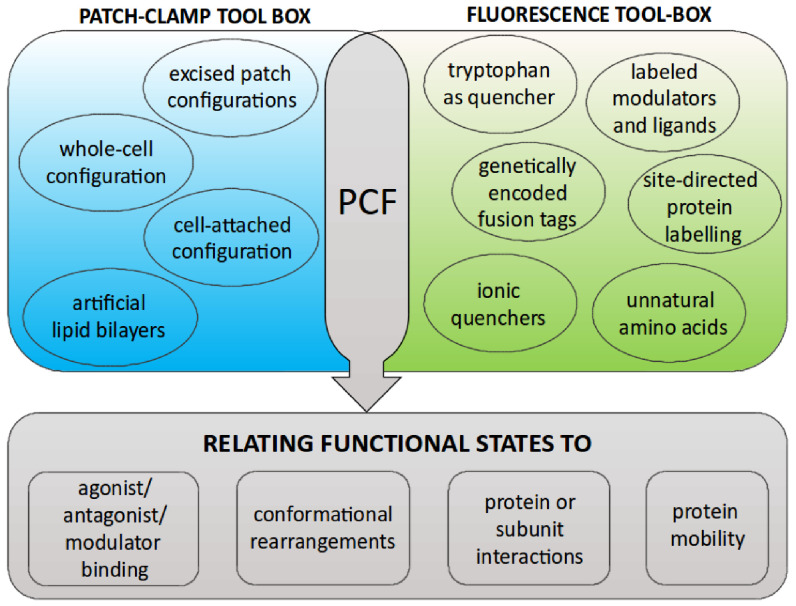
Figure 20.
Overview of the main electrophysiological and spectroscopic tools combined in PCF. The high variability of PCF, given by the number of possible combinations of electrophysiological and spectroscopic t...
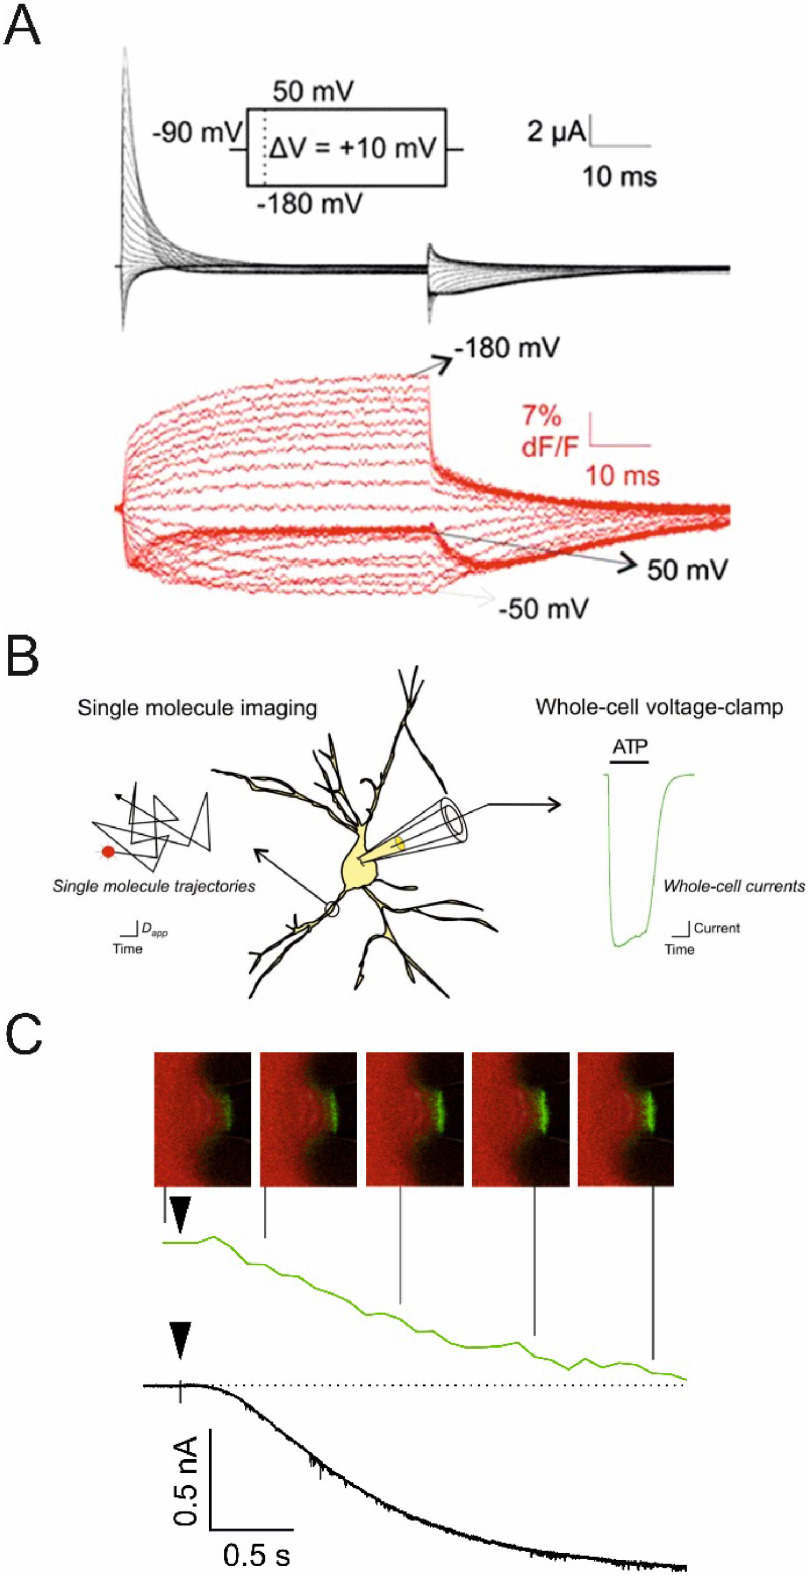
Figure 21.
Three examples illustrating the wide variety of combining electrophysiological and spectroscopic approaches. (A) VCF with Xenopus laevis oocytes expressing voltage-dependent potassium channels (K V 1....
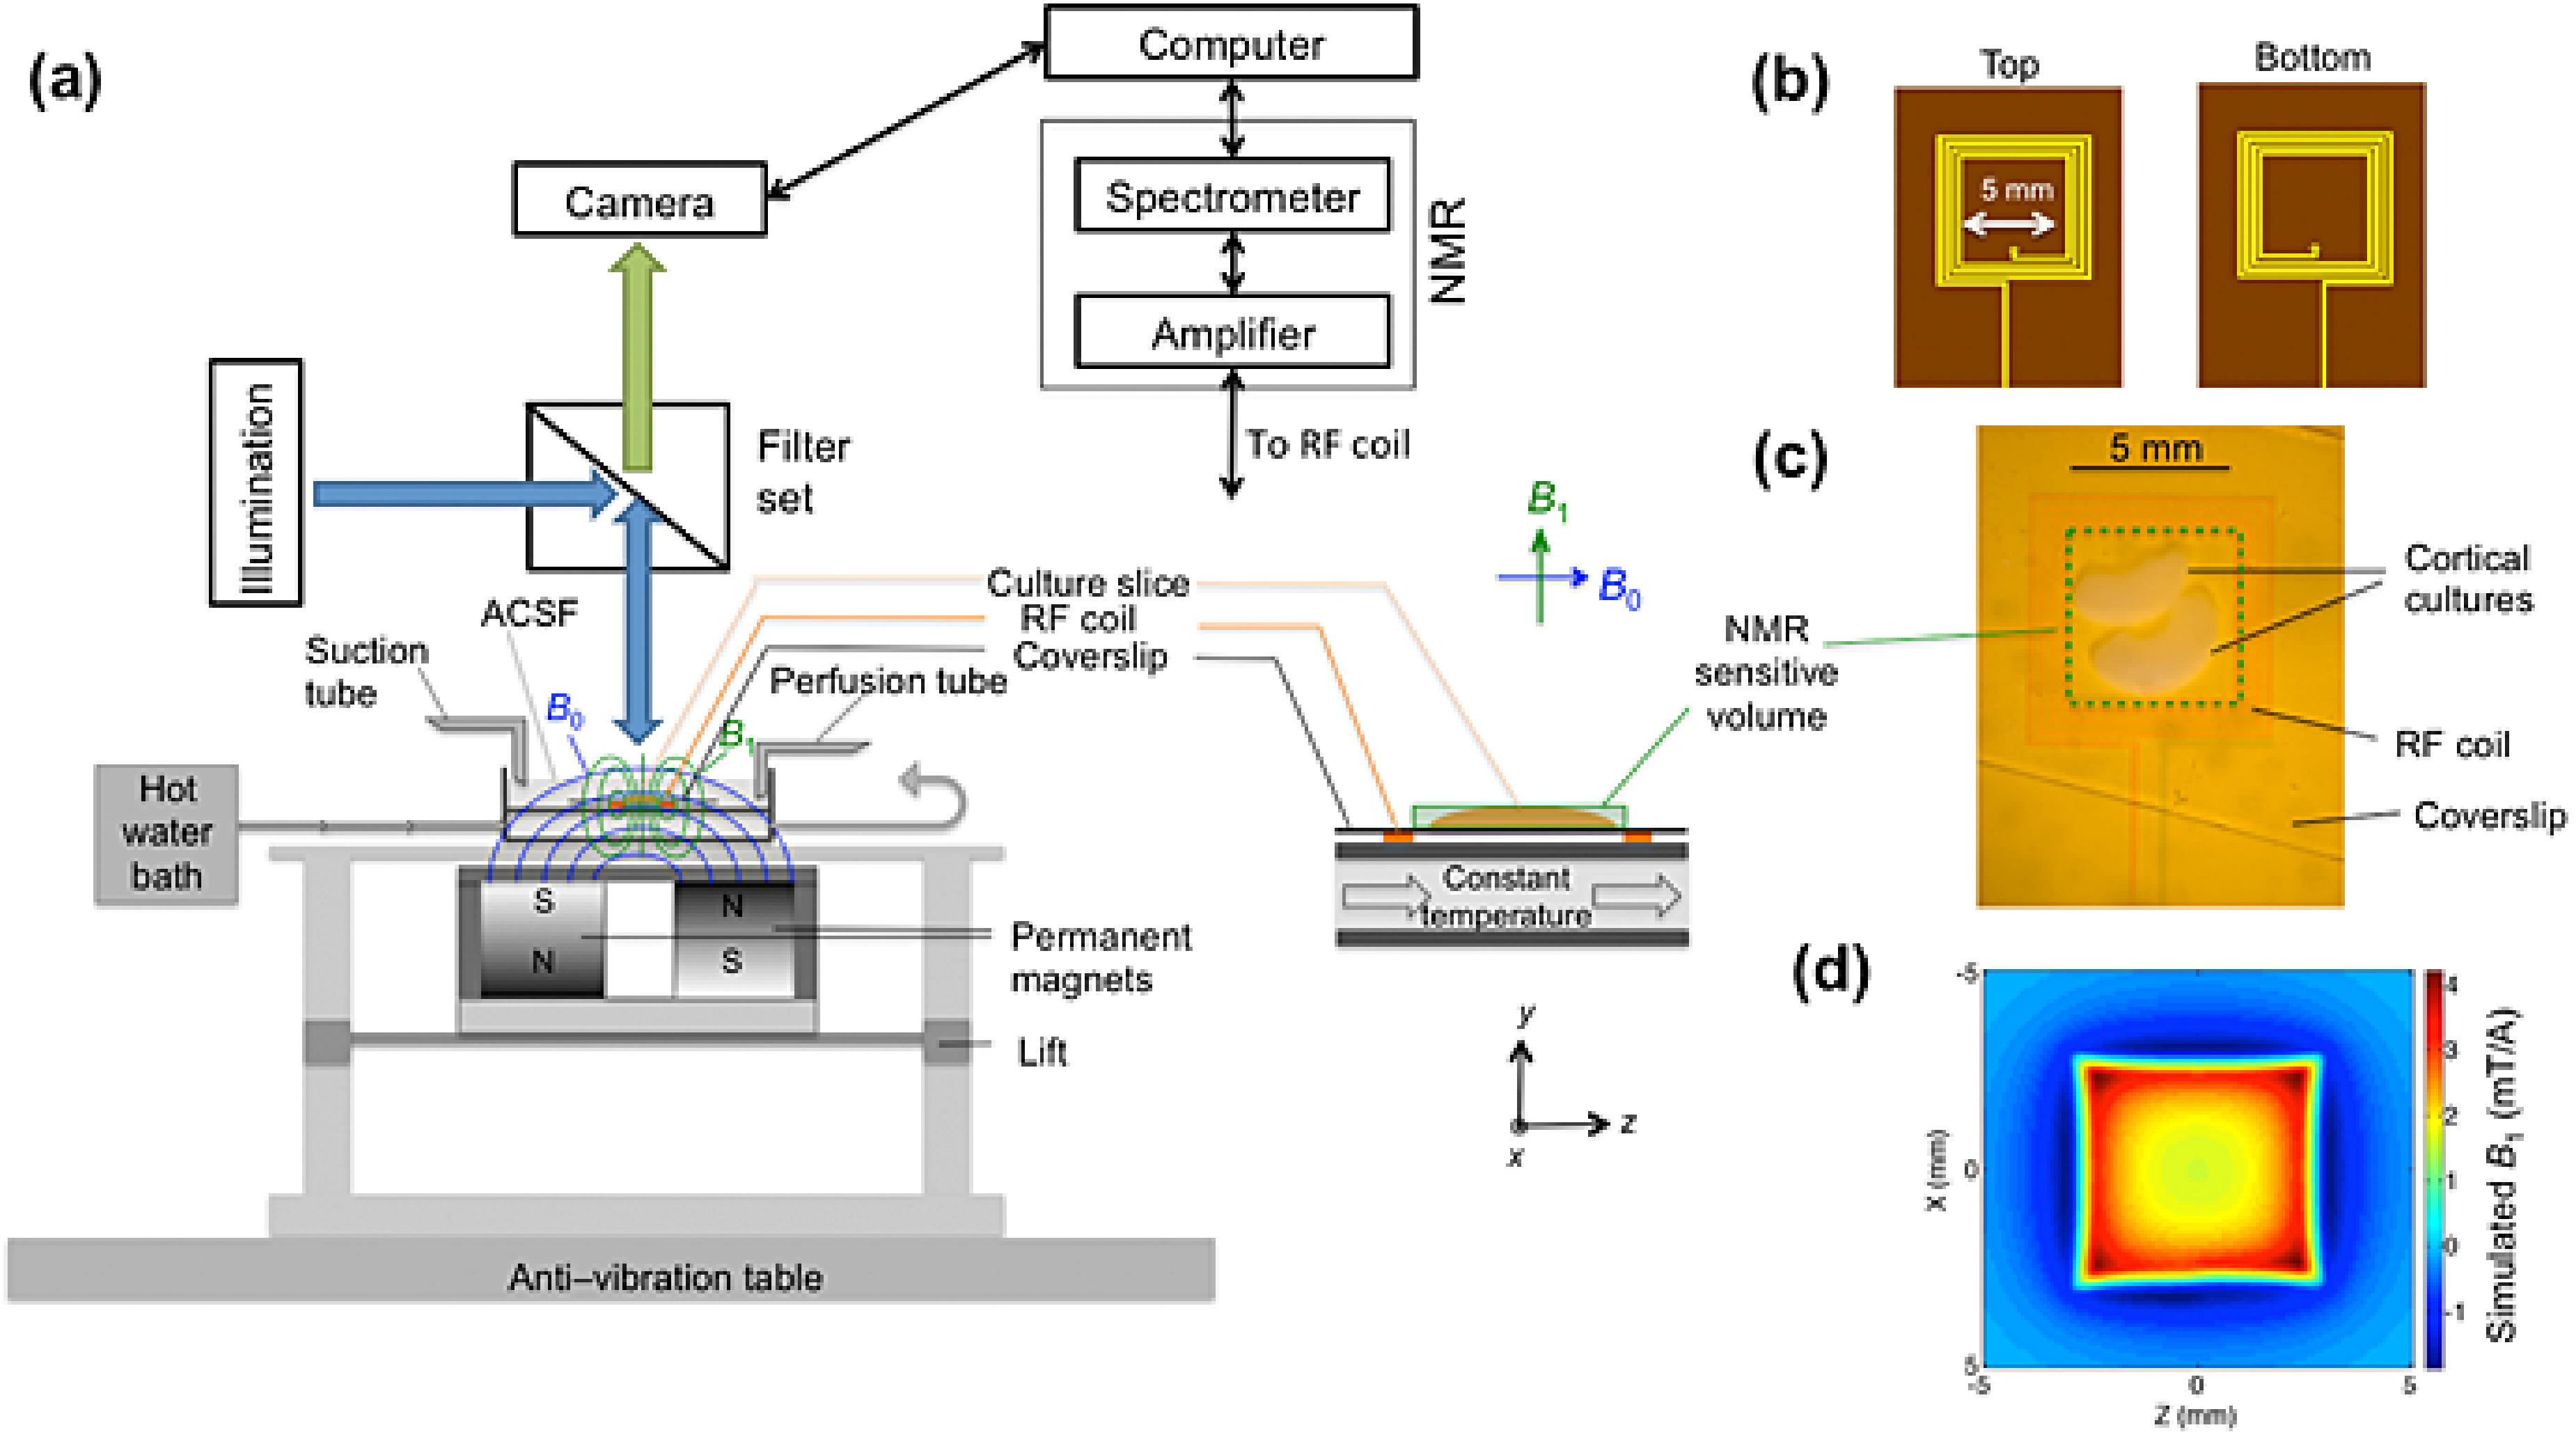
Figure 22.
A platform for simultaneous in vitro fMRI and FI. (a) This system is based on an open MRI at 0.32 T (bottom table), a brain slice chamber with constant nutrient flow (middle) and a camera (top) for de...
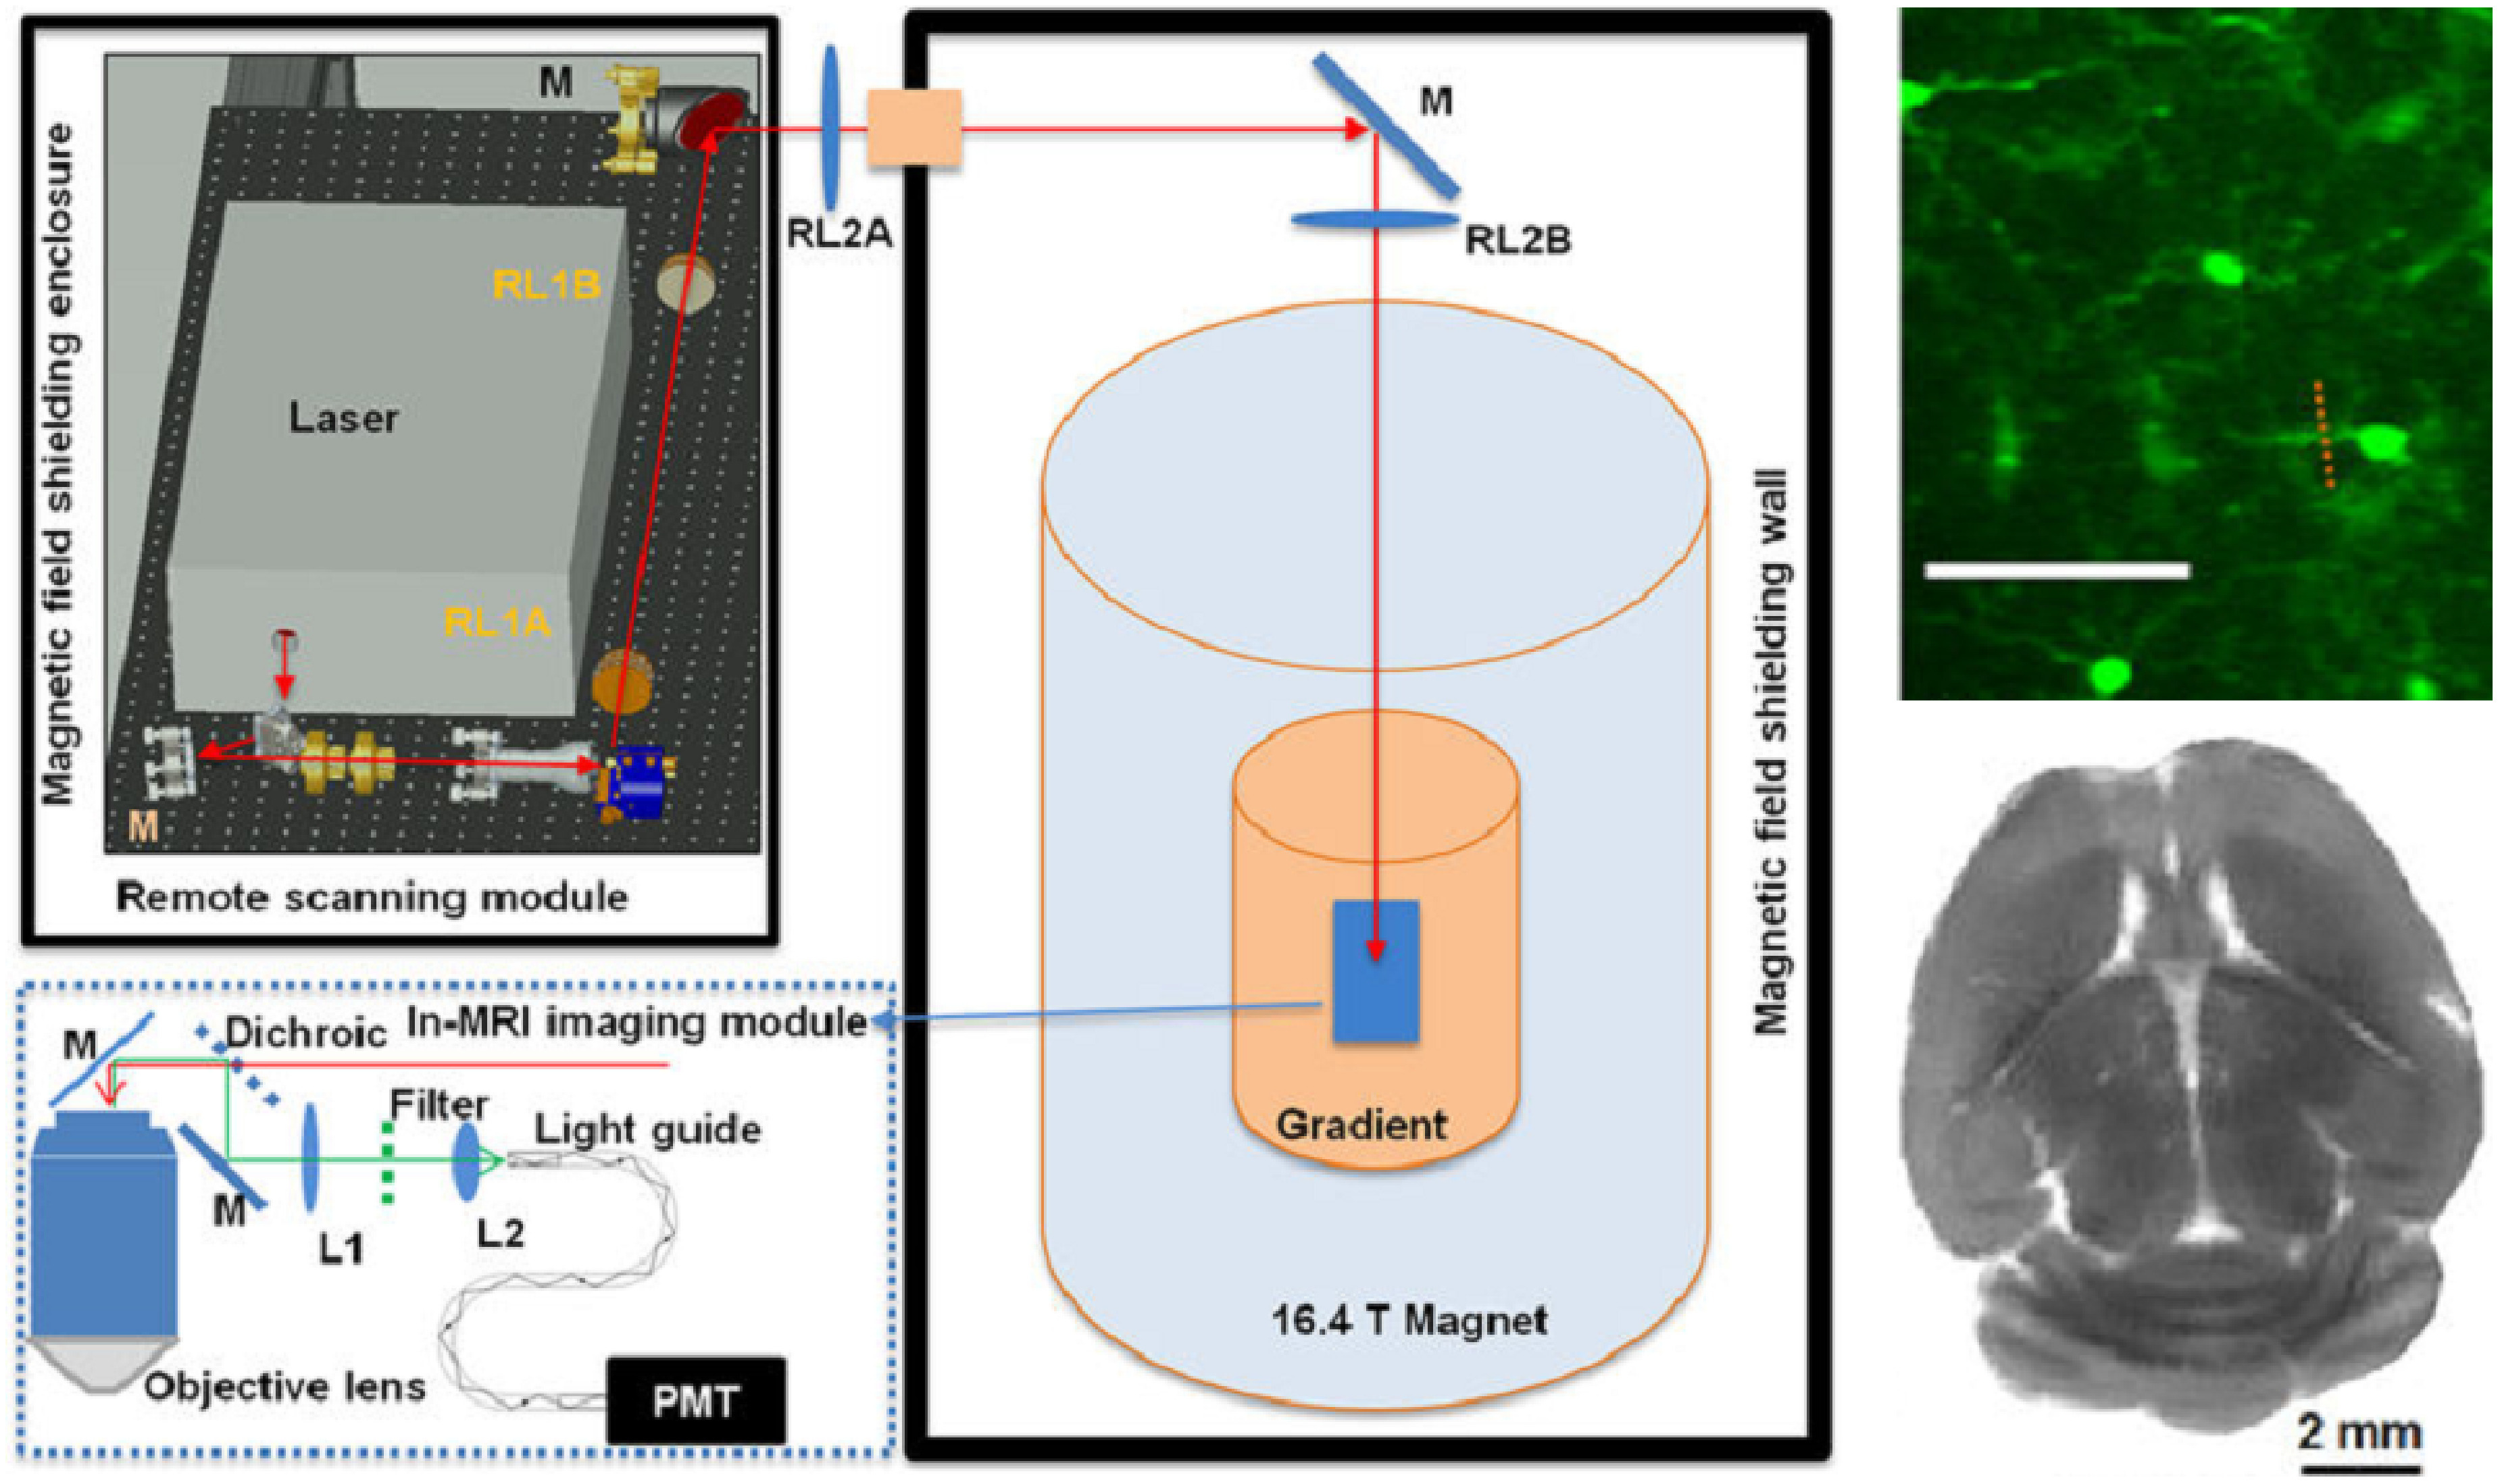
Figure 23.
A proof-of-concept ex vivo platform for TPM and MRI at 16.4 T. The laser scanning module (upper left corner) was located outside the 16.4 T magnet room and the excitation laser beam was guided into th...
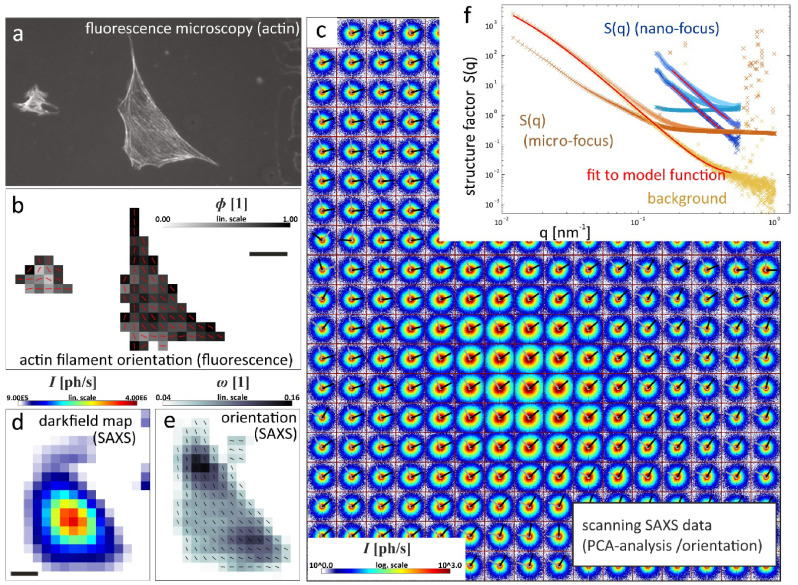
Figure 24.
Scanning x-ray microscopy using a micro- or nano-focused beam. (a) Fluorescence microscopy shows the actin fiber distribution that is pixelwise analysed in (b). (c) Composite image of the scan area in...
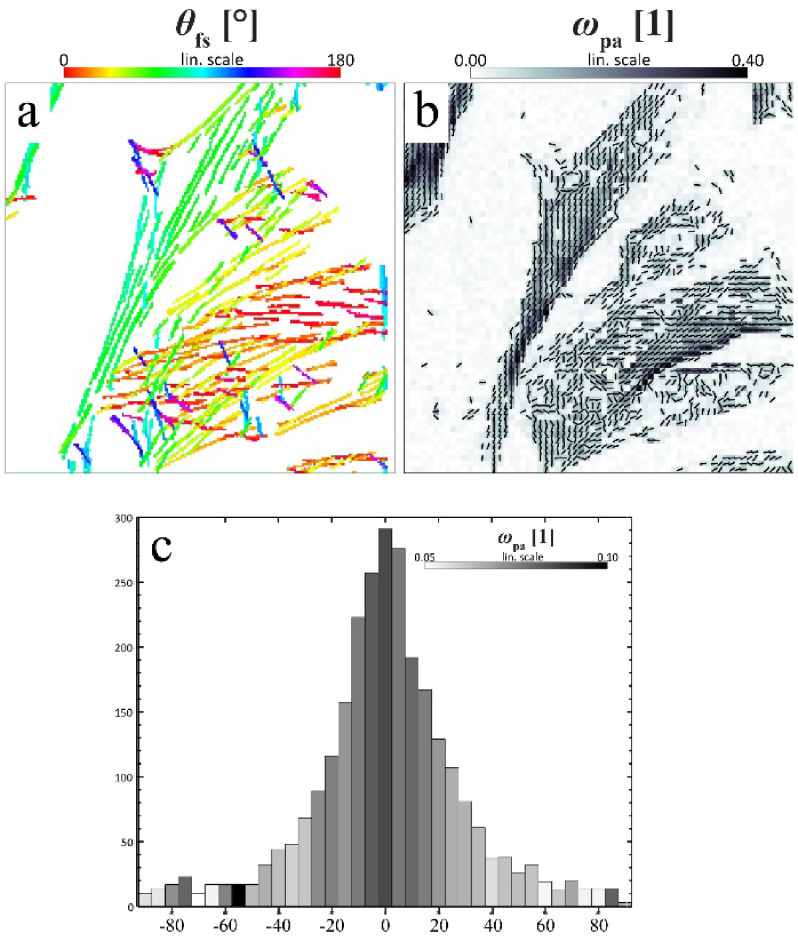
Figure 25.
Correlating fluorescence and x-ray scattering anisotropy. (a) Most significant filaments determined by the filament sensor from a fluorescence micrograph of neonatal rat cardiac tissue. (b) PCA-result...
Figure images are served from the NIH/NLM PubMed Central Open Access Subset or Europe PMC; copyright remains with the publishers and authors.
💬 Discussion
0 commentsNo comments yet. Be the first to start a discussion!
Leave a Comment