Abstract
AbstractWe demonstrate the use of cryogenic super-resolution correlative light and electron microscopy (csCLEM) to precisely determine the spatial relationship between proteins and their native cellular structures. Several fluorescent proteins (FPs) were found to be photoswitchable and emitted far more photons under our cryogenic imaging condition, resulting in higher localization precision which is comparable to ambient super-resolution imaging. Vitrified specimens were prepared by high pressure freezing and cryo-sectioning to maintain a near-native state with better fluorescence preservation. A 2-3-fold improvement of resolution over the recent reports was achieved due to the photon budget performance of screening out Dronpa and optimized imaging conditions, even with thin sections which is at a disadvantage when calculate the structure resolution from label density. We extended csCLEM to mammalian cells by introducing cryo-sectioning and observed good correlation of a mitochondrial protein with the mitochondrial outer membrane at nanometer resolution in three dimensions.
🔬 Techniques
🔭 Microscopes
🧬 Organisms
💻 Software
✨ Fluorophores
🧪 Sample Preparation
🔬 Cell Lines
🏭 Microscope Brands
🧪 Reagent Suppliers
📷 Detectors
🎨 Filters
💻 Software Details
💻 Code & Software
💾 Data Repositories
🏛️ Research Organizations (ROR)
Affiliated research institutions:
📋 Methods
Protein expression and purification The FPs were cloned into a pRSET vector using the appropriate restriction sites and expressed in the Escherichia coli strain BL21 (DE3). The bacteria were cultured at 310 K to OD = 0.6. The expression of proteins was induced by adding 0.1 mM IPTG and incubating overnight at 295 K. The proteins were purified with a Ni-NTA His-Bind resin (Qiagen). Then, further purification of the proteins was performed through a gel-filtration step using a Superdex 200 column (GE Healthcare). Purified proteins were concentrated by ultrafiltration and diluted in PBS for additional analysis.
Spectra measurement
The measurement of spectra of Dronpa at different temperatures was performed using a spectrometer (FLS920, Edinburgh Instrument) equipped with a liquid nitrogen cryostat (OptistatDN-V2, Oxford Instruments). The slow-freezing of the samples from 293 K to 143 K was achieved by meticulous control of the liquid nitrogen flow. Purified Dronpa was diluted to ~0.02 mM. This concentration was necessary to avoid impurity peaks. Moreover, glycerol (60%) was used as a cryo-protectant to prevent crystalline ice formation. The evolution of the emission spectra of Dronpa subjected to a temperature gradient with excitation wavelength at 445 nm was observed ( Fig. 2c,d ). Plasmid construction The Dronpa gene was cloned and inserted into the pEGFP-N1 (Clontech) vector using BamHI and NotI to replace the EGFP gene, which generated pDronpa-N1. The first 33 amino acids of TOM20 (Homo sapiens, NP_055580 ) were PCR-amplified and inserted into pDronpa-N1. The correct localization of TOM20-Dronpa in HEK293 cells was verified using confocal microscopy ( Methods , Figure S5 ) Cell culture HEK293 cells were cultured in Dulbecco’s Modified Eagle Medium (DMEM) (Gibco) containing 10% fetal bovine serum and maintained at 310 K and 5% CO 2 in a humidified incubator. Cells were then transiently transfected using Lipofectamine TM 2000 (Invitrogen) for 24 h.
Show full methods section
Protein expression and purification The FPs were cloned into a pRSET vector using the appropriate restriction sites and expressed in the Escherichia coli strain BL21 (DE3). The bacteria were cultured at 310 K to OD = 0.6. The expression of proteins was induced by adding 0.1 mM IPTG and incubating overnight at 295 K. The proteins were purified with a Ni-NTA His-Bind resin (Qiagen). Then, further purification of the proteins was performed through a gel-filtration step using a Superdex 200 column (GE Healthcare). Purified proteins were concentrated by ultrafiltration and diluted in PBS for additional analysis.
Spectra measurement
The measurement of spectra of Dronpa at different temperatures was performed using a spectrometer (FLS920, Edinburgh Instrument) equipped with a liquid nitrogen cryostat (OptistatDN-V2, Oxford Instruments). The slow-freezing of the samples from 293 K to 143 K was achieved by meticulous control of the liquid nitrogen flow. Purified Dronpa was diluted to ~0.02 mM. This concentration was necessary to avoid impurity peaks. Moreover, glycerol (60%) was used as a cryo-protectant to prevent crystalline ice formation. The evolution of the emission spectra of Dronpa subjected to a temperature gradient with excitation wavelength at 445 nm was observed ( Fig. 2c,d ). Plasmid construction The Dronpa gene was cloned and inserted into the pEGFP-N1 (Clontech) vector using BamHI and NotI to replace the EGFP gene, which generated pDronpa-N1. The first 33 amino acids of TOM20 (Homo sapiens, NP_055580 ) were PCR-amplified and inserted into pDronpa-N1. The correct localization of TOM20-Dronpa in HEK293 cells was verified using confocal microscopy ( Methods , Figure S5 ) Cell culture HEK293 cells were cultured in Dulbecco’s Modified Eagle Medium (DMEM) (Gibco) containing 10% fetal bovine serum and maintained at 310 K and 5% CO 2 in a humidified incubator. Cells were then transiently transfected using Lipofectamine TM 2000 (Invitrogen) for 24 h.
Cryo-nanoscopy setup
The cryo-nanoscopy system ( Fig. 1a , Methods , Figure S1 ) consists of a cryo-chamber and a home-built upright microscopy ( Figure S2a ). We used a commercial cryo-chamber from Leica (Leica EM FC6) which is widely used for ultrathin cryo-sectioning of biological samples and has been shown to keep samples vitrified. The cryo-chamber uses cryogenic nitrogen gas to build up a stable cryogenic environment surrounding the sample stage and objective (Olympus , 100x, NA 0.8). Inside the cryo-chamber, a copper block (made of oxygen free copper) ( Methods , Figure S2b ), which is connected with the piezo stage by two glass rods, is used to support a copper sample holder ( Methods , Figure S2c ). The sample holder (made of oxygen free copper) has been designed to adopt four EM finder grids and is kept in place on the copper block by four small magnets integrated inside both parts. The glass rods is connected to a 3-axies piezo stage placed outside of the cryo-chamber. The piezo stage is attached to a XY stage. The goal of the design is to reduce the heat conduction from the cryo-chamber to sample stages and to provide high mechanical stability by avoiding the vibration of cryo-chamber due to liquid nitrogen pump. A heating wire is attached to a copper tube connecting the objective to prevent water condensation at the objective. For fluorescence activation and excitation, we used a 405 nm diode laser (OBIS, Coherent) and two solid-state lasers (OPSL, Coherent) with wavelengths of 488 nm and 561 nm coupled into a single-mode polarization-maintaining optical fiber. The laser beams were combined using DM1 and DM2 (LM01-427-25, LM01-503-25, SEMROCK) and delivered into the objective with DM3 (Di01-R405/488/561/635-25×36, SEMROCK), which reflected all laser beams but allowed the transmission of emitted fluorescence. An AOTF (AOTFnC-400.650, AA) was used for flexible control of the wavelength and intensity of the lasers delivered by the fiber. Two EMCCDs (iXon DV-897 BV, Andor) were used in this implementation to ensure that the super-resolution imaging system (EMCCD1) and the feedback stabilization system (EMCCD2) remained independent of each other during data acquisition. A green (532 nm) light-emitting diode (LED) facilitated brightfield imaging. The fluorescence of the dark red beads (200 nm, Invitrogen) excited by the 488 nm laser was split by DM4 (DM690, Olympus), which reflected parts of the bead signal to EMCCD2 and allowed transmission of the leftover bead signal and the fluorescence of Dronpa. The image of the dark red beads and Dronpa on EMCCD1 was split by DM5 (FF560-Di01-25×36, SEMROCK) and cleaned by EM2 and EM3 (FF03-525/50-25, FF01-697/58-25), then projected onto two regions of EMCCD1. The bead image on EMCCD1 was used for correlation with TEM images, and the bead image on EMCCD2 was used for drift correction. The major advantage of the two-EMCCD system is the flexibility of optimizing the feedback stabilization system and fluorescence imaging system separately. Two cylindrical lenses were placed before EMCCD1 and EMCCD2 to enable imaging in 3D. A feedback loop that tracked the image of the dark red beads on EMCCD2 in real time actuated a piezo stage (P-733.3 DD, E-516 controller, Physik Instrument) and locked the sample at a fixed set point during data acquisition. Two computers were used to control EMCCD1 and EMCCD2 independently. A fast synchronization unit was designed to communicate with PC2 and the piezo stage controller to synchronize imaging with piezo stage movement for fast feedback. The fast feedback stabilizes the position of the sample with ~5 nm precision during data acquisition ( Fig. 1b–e ).
Cryo-nanoscopy imaging and data analysis
EM finder grids with cryo-sections were first transferred to a sample holder that can support up to 4 grids in liquid nitrogen. Then, the sample was transferred into the cryo-chamber and mounted onto a copper block by four tiny magnetic buttons. A tiny Pt100 temperature sensor was inserted into the copper block around the samples to monitor the temperature. The cryo-chamber was usually pre-cooled to 113 K for more than 30 min before specimens were loaded. We first identified regions with fluorescence under low-power illumination with a 488 nm laser and further verified the regions of interest (ROIs) by the bright-field image on EMCCD1. Then, we ensured the presence of fiducial markers (fluorescent beads) on the red channel of EMCCD1 and EMCCD2 and locked the specimens at set positions through our feedback stabilization system. Next, we gradually increased the 488 nm laser power to 1.5 kW·cm −2 at the specimen to switch the ensemble Dronpa fluorescence to the single-molecule level. The 1.5 kW·cm −2 power was chosen as a compromise of imaging speed and avoiding devitrification of the specimen. Finally, the single-molecule images were obtained at 20 Hz. The activation laser pulses ranged from 0.005–0.5 kW·cm −2 at the specimen during data recording with a 4 Hz repeat rate and 0.01 s width. To avoid build-up of heat, we divided our imaging process into several sessions. Each session lasts for 5 min or less, with 10–20 seconds of breaks in between with no laser illumination. Inside the cryo-chamber, samples are surrounded by continuous replenished, gently flowing cryogenic nitrogen gas. The heat caused by laser-sample interaction would be quickly conducted during the breaks. At the end of the experiments, we have checked our sample and verified that there is no obvious crystalline ice formation. One example with 17 min total laser illumination is presented in Movie S1. Data analysis and super-resolution image reconstruction were performed as previously described with some modifications 3 25 31 . We first applied an àtrous wavelet filter 32 to the original fluorescence images to extract all the single molecules. Then, a trajectory linking algorithm ( http://physics.georgetown.edu/matlab/ ) was used to find the corresponding single molecule in successive frames. Each identified molecule was background-subtracted and fit to an elliptical Gaussian function to obtain its precise centroid position and Gaussian width (w x and w y ). Based on the calibration curve ( Methods , Figure S7 ), the molecules whose ellipticity was too large or too small were rejected. The remaining molecules were divided linearly into 8 z-sections on the basis of z-positions. Meanwhile, sample drift during image acquisition in all three dimensions was further estimated by analyzing the trace of fiducial markers which are imaged on red channel of EMCCD1. Finally, every drift-corrected molecule was represented by a Gaussian spot whose FWHM was determined by the localization error of each molecule, and the final PALM image was rendered. To analyze the properties of FPs under CT, purified FPs were first diluted to ~1 mg/ml and fast frozen under a Vitrobot Mark IV (FEI). The excitation laser power was maintained at ~2.0 kW·cm −2 . Single-molecule data were recorded at CT and analyzed as previously described 33 . To analyze the behaviors of fluorescent proteins under CT, we collected fluorescence images under different illumination protocols ( Fig. 2a,b , Methods and Figures S3 , S4 ). We developed software for the control of AOTF and the generation of sophisticated time sequences of different lasers ( https://github.com/shepherd87/pyAOTF ).
Preparation of support film
The traditional support film on an EM grid has a high background fluorescence that affects the performance of fluorescence nanoscopy. We found that most of the background fluorescence was generated by contaminants on the surface of the glass slides that were used to generate the thin formvar film. We applied a chemical cleaning method to wash the glass slides. Briefly, glass slides were washed in a mixture of 250 ml of clean water, 50 ml of ammonium hydroxide, and 50 ml of hydrogen peroxide in a 500 ml beaker for 3 h at 383 K. After rinsing 3 times in ddH 2 O, the glass slides were carefully transferred to a beaker containing anhydrous ethyl alcohol overnight and dried on a clean bench. A cleaned glass slide was dipped into a 0.2% formvar/chloroform solution in a volumetric beaker and dried above the liquid surface. After scoring the edge of the slides, the film was floated onto the water surface, and 200 mesh EM-finder copper grids (Gilder Grids, England) were placed on the film and dried on filter paper. For fine correlation between light and EM, we deposited 200 nm fluorescent beads and 50 nm gold particles on the surface of the formvar film before applying to vitreous cryo-sections. Briefly, 3 μl of 1:300 diluted dark red 200 nm fluorescent beads was added to a glow-discharged grid for 1 min, and extra liquid was then blotted using filter paper. After the grid was dried, another 3 μl of a ddH 2 O-diluted solution of 50 nm gold particles (Microspheres-Nanospheres, 790116-010) was applied onto the grid for 1 min, and extra liquid was blotted using filter paper. The grids were then dried and stored until use. High-pressure freezing Transfected HEK293 cells were harvested enzymatically by trypsin and centrifugation at 600 g, then re-suspended in an equal volume mixture of 40% w/v dextran (M r ~40,000, Sigma) and 1:2 diluted dark red 200 nm fluorescent beads. Finally, the samples were vitrified using a high-pressure freezing apparatus (EMPACT2, Leica Microsystems, Germany) as described previously 18 .
Cryo-electron microscopy of vitreous specimens
Cryo-EM of vitreous specimens has been thoroughly described 18 and has been correlated with conventional fluorescence imaging 20 21 . In the current study, the vitrified sample was mounted in the holder of an ultramicrotome (UC6/FC6, Leica Microsystems, Germany) at 113 K. After trimming the sides of the copper tube with a cryo 45° diamond trimming knife (Diatome, Biel, Switzerland), the sample was sectioned using a cryo 25° diamond knife (Diatome, Biel, Switzerland) with a nominal thickness of 200 nm. Ribbons of sections were transferred onto the above-prepared grid using an eyelash glued to a wooden stick, and the sections were pressed and then attached to the formvar film using two polished ceramic plates. The grids with cryo-sections were stored in liquid nitrogen prior to observation. After fluorescence imaging, TEM sample grids containing vitreous cryo-sections of HEK293 cells were transferred and imaged by a cryo-electron microscope (FEI Titan Krios) operated at 300 kV and equipped with a 4K*4K CCD camera (Gatan UltraScan 4000). For cryo-ET data collection, a defocus of approximately -15 μm was used with a total electron dose
📊 Figures
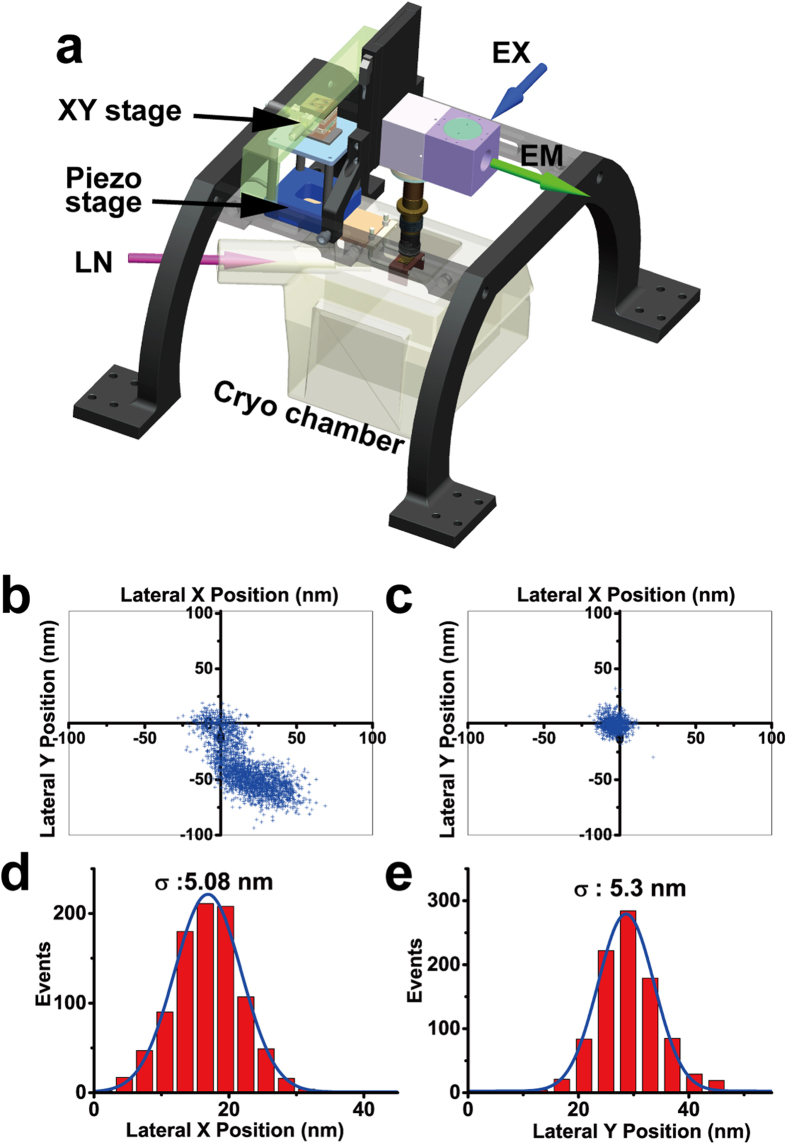
Figure 1
Schematic drawing and drift correction capability of the system.
( a ) Schematic drawing of the cryo-nanoscopy system. A dark red fluorescent bead was monitored for 5 min without active feedback ( b ) and with active feedback ( c ). Lateral X ( d ) and Y ( e ) posi...
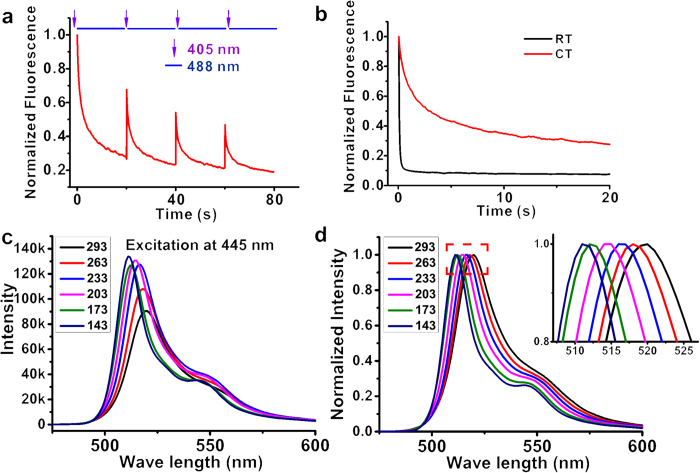
Figure 2
Photophysical properties of Dronpa at CT.
( a ) Photoswitching capability of Dronpa at CT (113 K). Purified Dronpa proteins were first switched off by a 488u2009nm laser, followed by alternative illumination with 405u2009nm and 488u2009nm las...
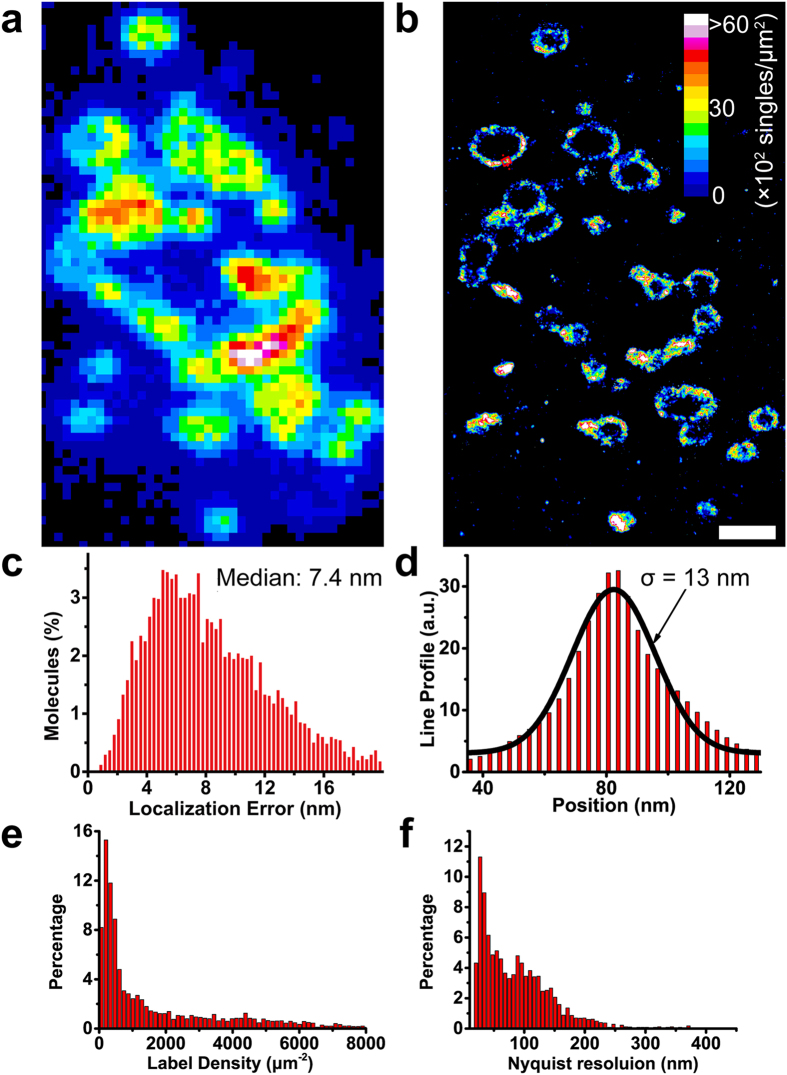
Figure 3
Verification of cryo-nanoscopyu2019s resolving capability.
( a , b ) Conventional fluorescence image ( a ) and PALM image ( b ) of a 200u2009nm cryo-section of a TOM20-Dronpa-labeled HEK293 cell. Scale bar, 1u2009u03bcm. ( c ) Distribution of the localization...
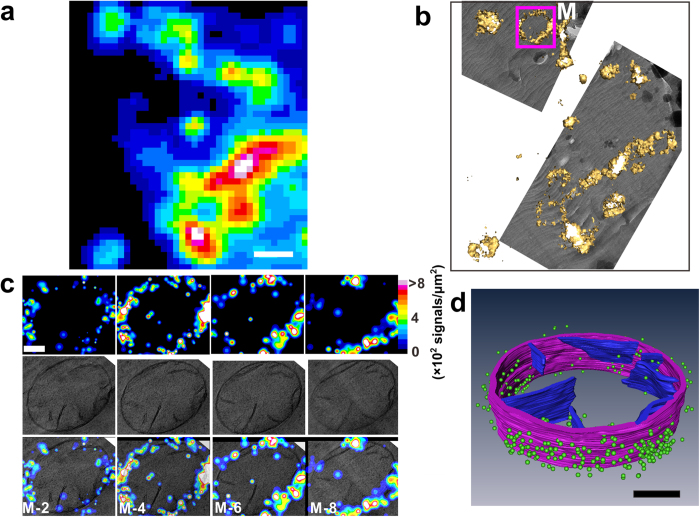
Figure 4
3D correlative images from cryo-sections of HEK293 cells expressing TOM20-Dronpa.
( a ) Summed image from single-molecule data. Scale bar, 1u2009u03bcm. ( b ) Correlative isosurface reconstruction of a PALM image with low magnification TEM data. ( c ) Each column in c was from a si...
Figure images are served from the NIH/NLM PubMed Central Open Access Subset or Europe PMC; copyright remains with the publishers and authors.
💬 Discussion
0 commentsNo comments yet. Be the first to start a discussion!
Leave a Comment