Abstract
AbstractBacteria of the phylum Planctomycetes have been previously reported to possess several features that are typical of eukaryotes, such as cytosolic compartmentalization and endocytosis-like macromolecule uptake. However, recent evidence points towards a Gram-negative cell plan for Planctomycetes, although in-depth experimental analysis has been hampered by insufficient genetic tools. Here we develop methods for expression of fluorescent proteins and for gene deletion in a model planctomycete, Planctopirus limnophila, to analyse its cell organization in detail. Super-resolution light microscopy of mutants, cryo-electron tomography, bioinformatic predictions and proteomic analyses support an altered Gram-negative cell plan for Planctomycetes, including a defined outer membrane, a periplasmic space that can be greatly enlarged and convoluted, and an energized cytoplasmic membrane. These conclusions are further supported by experiments performed with two other Planctomycetes, Gemmata obscuriglobus and Rhodopirellula baltica. We also provide experimental evidence that is inconsistent with endocytosis-like macromolecule uptake; instead, extracellular macromolecules can be taken up and accumulate in the periplasmic space through unclear mechanisms.
🔬 Techniques
🔭 Microscopes
🧬 Organisms
💻 Software
✨ Fluorophores
🧪 Sample Preparation
🔬 Cell Lines
🏭 Microscope Brands
🧪 Reagent Suppliers
📷 Detectors
💻 Software Details
💾 Data Repositories
🏛️ Research Organizations (ROR)
Affiliated research institutions:
📋 Methods
Cultivation conditions
Planctopirus limnophila DSM 3776 (the bacterium formerly known as Planctomyces limnophilus ) and Gemmata obscuriglobus DSM 5831 were cultivated at 28 °C in limnic medium 3 (M3) composed of 1 g l −1 peptone, 1 g l −1 yeast extract, 1 g l −1 glucose, 5 ml vitamin solution (double concentrated) and 20 ml l −1 mineral salt solution buffered with 10 mM HEPES at pH 7.5. Rhodopirellula baltica SH1 DSM 10527 was cultivated at 28 °C in marine medium 2 (M2) composed of 1 g l −1 peptone, 1 g l −1 glucose, 10 ml vitamin solution (double concentrated), 250 ml double-concentrated artificial sea water (46.94 g l −1 NaCl, 7.84 g l −1 Na 2 SO 4 , 21.28 g l −1 MgCl 2 × 6H 2 O, 2.86 g l −1 CaCl 2 × 2H 2 O, 0.384 g l −1 NaHCO 3 , 1.384 g l −1 KCl, 0.192 g l −1 KBr, 0.052 g l −1 H 3 BO 3 , 0.08 g l −1 SrCl 2 × 6H 2 O, 0.006 g l −1 NaF) and 20 ml l −1 mineral salt solution buffered with 5 mM Tris/HCl at pH 7.5. Escherichia coli K12 Top10, was cultured at 37 °C in lysogeny broth composed of 5 g l −1 yeast extract, 10 g l −1 trypton and 10 g l −1 NaCl at 7.0 pH.
Construction of a GFP Planctopirus limnophila strain
The constitutive GFP expression system consists of a TN5 transposon, harbouring the GFPmut2 (ref. 46 ) gene along with a kanamycin resistance cassette under the transcriptional control of the GAPDH promoter from P. limnophila . Briefly, the construction was based on the pMOD3 vector (Epicentre). This pMOD3 vector and the pKen GFP mut2 plasmid (Addgene) were both cut with Xma I and Pst I (Fermentas). Vector backbone and the GFP insert were ligated (NEB quick ligation) to construct pCJ0001. This plasmid and the PCR product of plasmid pCR2.1 (Invitrogen) (primer CJ326: 5′-GTC AAT CGA TGC GGT TTT ATG GAC AGC AAG-3′ and CJ327: 5′-AGC TGA ATT CGC GAC ACG GAA ATG TTG AAT-3′) were cut with Cla I and Eco RI. Subsequently, the pCJ0001 backbone was ligated to the kanamycin resistance cassette obtained from pCR2.1 to construct pCJ0002. Then, the GAPDH promoter was amplified (Phusion DNA polymerase, NEB) from P. limnophila gDNA (primer CJ403: 5′-AGC GAG AGA ATC AGG CTT ACC-3′ and CJ404: 5′-AGC CAA CGT TTC ATG CAT ATC-3′). For further processing, a subsequent PCR was performed on the amplified product to attach Xma I and Eco RI restriction sides (Primer CJ340: 5′-ACT GAA TTC ATC ACC TGT TGA GGC GAT TC-3′ and CJ341: 5′-ACT CCC GGG CAA CTG AAG TAC AGT CTG GA-3′). PCR product and pCJ0002 were cut with Xma I and Eco RI and ligated to yield pCJ0003. pCJ0003 was used to build the Tn5 transposon according to the epicentre PCR protocol (Epicentre Cat. No. MOD1503). Transposons were transferred into P. limnophila and insertion sites of ten clones were determined by arbitrary PCR as previously described 25 . Two clones (SCJ0034-1.2 and SCJ0036-2.2) showed similar cytosolic GFP localization and identical growth characteristics compared to the P. limnophila wild type. Strain SCJ0036-2.2 was used for this study.
Show full methods section
Cultivation conditions
Planctopirus limnophila DSM 3776 (the bacterium formerly known as Planctomyces limnophilus ) and Gemmata obscuriglobus DSM 5831 were cultivated at 28 °C in limnic medium 3 (M3) composed of 1 g l −1 peptone, 1 g l −1 yeast extract, 1 g l −1 glucose, 5 ml vitamin solution (double concentrated) and 20 ml l −1 mineral salt solution buffered with 10 mM HEPES at pH 7.5. Rhodopirellula baltica SH1 DSM 10527 was cultivated at 28 °C in marine medium 2 (M2) composed of 1 g l −1 peptone, 1 g l −1 glucose, 10 ml vitamin solution (double concentrated), 250 ml double-concentrated artificial sea water (46.94 g l −1 NaCl, 7.84 g l −1 Na 2 SO 4 , 21.28 g l −1 MgCl 2 × 6H 2 O, 2.86 g l −1 CaCl 2 × 2H 2 O, 0.384 g l −1 NaHCO 3 , 1.384 g l −1 KCl, 0.192 g l −1 KBr, 0.052 g l −1 H 3 BO 3 , 0.08 g l −1 SrCl 2 × 6H 2 O, 0.006 g l −1 NaF) and 20 ml l −1 mineral salt solution buffered with 5 mM Tris/HCl at pH 7.5. Escherichia coli K12 Top10, was cultured at 37 °C in lysogeny broth composed of 5 g l −1 yeast extract, 10 g l −1 trypton and 10 g l −1 NaCl at 7.0 pH.
Construction of a GFP Planctopirus limnophila strain
The constitutive GFP expression system consists of a TN5 transposon, harbouring the GFPmut2 (ref. 46 ) gene along with a kanamycin resistance cassette under the transcriptional control of the GAPDH promoter from P. limnophila . Briefly, the construction was based on the pMOD3 vector (Epicentre). This pMOD3 vector and the pKen GFP mut2 plasmid (Addgene) were both cut with Xma I and Pst I (Fermentas). Vector backbone and the GFP insert were ligated (NEB quick ligation) to construct pCJ0001. This plasmid and the PCR product of plasmid pCR2.1 (Invitrogen) (primer CJ326: 5′-GTC AAT CGA TGC GGT TTT ATG GAC AGC AAG-3′ and CJ327: 5′-AGC TGA ATT CGC GAC ACG GAA ATG TTG AAT-3′) were cut with Cla I and Eco RI. Subsequently, the pCJ0001 backbone was ligated to the kanamycin resistance cassette obtained from pCR2.1 to construct pCJ0002. Then, the GAPDH promoter was amplified (Phusion DNA polymerase, NEB) from P. limnophila gDNA (primer CJ403: 5′-AGC GAG AGA ATC AGG CTT ACC-3′ and CJ404: 5′-AGC CAA CGT TTC ATG CAT ATC-3′). For further processing, a subsequent PCR was performed on the amplified product to attach Xma I and Eco RI restriction sides (Primer CJ340: 5′-ACT GAA TTC ATC ACC TGT TGA GGC GAT TC-3′ and CJ341: 5′-ACT CCC GGG CAA CTG AAG TAC AGT CTG GA-3′). PCR product and pCJ0002 were cut with Xma I and Eco RI and ligated to yield pCJ0003. pCJ0003 was used to build the Tn5 transposon according to the epicentre PCR protocol (Epicentre Cat. No. MOD1503). Transposons were transferred into P. limnophila and insertion sites of ten clones were determined by arbitrary PCR as previously described 25 . Two clones (SCJ0034-1.2 and SCJ0036-2.2) showed similar cytosolic GFP localization and identical growth characteristics compared to the P. limnophila wild type. Strain SCJ0036-2.2 was used for this study.
Staining of planctomycetal cells
Membranes of P. limnophila , R. baltica , G. obscuriglobus and E. coli cells were stained with (N-(3-Triethylammoniumpropyl)-4-(6-(4-(Diethylamino) Phenyl) Hexatrienyl) Pyridinium Dibromide (FM4–64/FM4-64FX) 25 (ThermoFisher) or Nile Red (Sigma-Aldrich) at a final concentration of 3 μg ml −1 . Samples were incubated for 10 min at room temperature (RT). In addition, DAPI was added at a final concentration of 1 μg ml −1 for 10 min at RT. Cells were washed twice with 1 ml tap water and centrifuged at 2,500 × g for 1.5 min. For DiOC 6 (3) staining of P. limnophila , R. baltica and G. obscuriglobus , cells were incubated for 45 min at 28 °C at a final concentration of 5 μg ml −1 DiOC 6 (3) (ThermoFisher). To induce plasmolysis of P. limnophila and E. coli , cells were treated as previously described 28 . In brief: sucrose concentrations of 30% were applied for 3 min at RT respectively. Subsequently, cells were fixed with 1% glutaraldehyde for 1 h at RT. Afterwards, cells were stained with Fm4-64FX and DAPI as described above. For quantification, we used NIS elements 4.2 and 4.3 (Nikon) to determine signal intensity plots or intensity per area measurements. Signal intensities of line plots were consistently adapted due to different staining efficiencies. Cytosol and nucleoid size were measured using the GFP and DAPI signal respectively in comparison to the whole cell size determined in phase contrast applying the Auto Detect ROI analysis feature. NIS elements 4.3 were used to determine co-localization. For P. limnophila and R. baltica , 50 individual cells each were compared. Due to high-aggregation of G. obscuriglobus cells entire fields of view were analysed.
Wide field fluorescence microscopy
For sample immobilization, MatTek Glass Bottom Microwell Dishes (35 mm dish, 14 mm microwell with No. 1.5 cover-glass P35G-1.5-14-C) were used. To minimize drift and cell movement, 1% agarose pads were placed on top of 3 μl samples. To prevent evaporation, but to achieve optimal phase contrast imaging, the plastic lid was removed and the agarose pads were covered with an additional high-precision coverslip (LH24.1 Carl Roth GmbH). The coverslip was sealed against the plastic dish with grease (Vaseline, Lenhart Kosmetik). WF fluorescence- and Phaco samples were visualized on a Nikon Eclipse Ti inverse microscope with DAPI (370/36–440/40), GFP (485/20-525/30) and Fm4–64 (525/30-705/72) filters. Fluorescence z-stacks and bright-field images were taken using a Nikon N Plan Apochromat λ × 100/1.45 oil objective and the ORCA FLASH 4.0 HAMMATSU or Nikon DS-Ri2 cameras, respectively. Images were processed using the NIS-elements imaging software V4.2 and V4.3 (Nikon) together with the 3D Landweber Deconvolution algorithm (Z-step: 0.2 μm, spherical aberration: 0.2). Super resolution structured illumination microscopy (SR-SIM) Samples were visualized on a Zeiss LSM 780 with ELYRA PS.1 (Carl Zeiss AG) with 561, 488 and 405 nm lasers and BP 570–650+LP 750, BP 495–575+LP 750 and BP 420–480+LP 750 beam splitters. Z-Stack images were taken using Plan-Apochromat × 63/1.4 oil DIC M27 objective and processed using the software ZEN2011 (Carl Zeiss AG). Images were post processed using the Amira 6.0 3D image analysis software (FEI). To compare WF and SR-SIM resolution in biological samples, intensity maxima of Fm4–64 or Nile-Red stained membranes of 20 cells were compared using WF (Nikon Eclipse Ti) and SR-SIM (Zeiss LSM 780), respectively. In addition, a nanoruler GATTA-SIM120B (GATTAquant), with a defined distance of 120 nm of two Alexa Fluor 488 molecules, was used to determine the resolution of the Zeiss LSM 780.
Cryo-electron tomography of P. limnophila cells
A late-exponential-phase culture of P. limnophila was gently filtered (10 μm membrane filter, Whatman Nuclepore) to remove aggregated cells. Aliquots (3 μl) of the filtered cell suspension were mixed with the same volume of BSA-stabilized 15 nm colloidal gold solution (Aurion), and placed on holey carbon-coated 200 mesh copper grids (R2/1, Quantifoil, Jena, Germany) immediately before thin-film vitrification by plunge-freezing in liquid propane (63%)/ethane (37%) (ref. 47 ). Typically, grids with frozen-hydrated samples were mounted in Autogrids 48 and ∼200 nm thin lamellae of vitrified material were milled with 30 keV gallium ions after application of a protective platinum layer in a dual-beam (FIB/SEM) instrument (Quanta 3D FEG, FEI, Hillsboro, OR, USA) equipped with a Quorum cryo-stage maintained at −185 °C (PP2000T, Quorum, East Sussex, UK). Milling was carried out at nominal incident ion beam angles of 16° to 20° (9° to 13° effectively) using gallium beam currents of 300, 100 and 30 pA in sequential milling steps 49 . Afterwards tomographic tilt series were recorded under low dose conditions (total dose typically 150 e Å −2 ) on a Tecnai G2 Polara (FEI, Eindhoven, the Netherlands) equipped with a post-column energy filter and a 2 k CCD camera (MultiScan) or a K2 summit direct electron detector (Gatan, Pleasanton, CA, USA). For tilt series recorded with the direct detection device, dose fractionation mode was employed and subframes of each projection were sampled, which were then aligned to compensate for beam-induced object drift, using an in-house implementation of the algorithm from the study by Li et al . 50 Typically, tilt series were recorded at a nominal defocus of −5 or −6 μm, and a primary magnification of × 27,500 (corresponding to pixel sizes on the object level of 0.427 nm (K2) and 0.805 nm (2 k CCD)), and covered an angular range of ±60° in increments of 1.5° or 2°, respectively. IMOD v4.7.8 (ref. 51 ) was used for 3D reconstruction, and MatLab8 (MathWorks) incorporating the TOM toolbox 52 for all image processing. Segmentation of three times binned volumes was done in Amira v6.0.1 (FEI, Eindhoven, the Netherlands) with specific automatic membrane segmentation 53 . Freeze-etching Freeze-etching was performed on cells taken from a P. limnophila culture at two different time points. The cells were concentrated (centrifugation 800 g for 4 min) and inserted either in a gold dome-shaped carrier (1.7 μl per carrier) or in a jet-freeze carrier sandwich with a grid in between (3 μl for the total sandwich). The carriers were plunge frozen in liquid nitrogen. The frozen samples were introduced into a Balzers BAF400 freeze-etch machine precooled to −150 °C with pressure below 10 −7 bar. The samples were kept at −97 °C for 7 min before being fractured, after they were allowed to freeze-etch (sublimation of water) for 4 min. The samples were shadowed with 1 nm Pt-C (angle 45°) and 10 nm C (angle 90°). Subsequently, biological material was removed from the replicas by overnight incubation in 70% sulfuric acid. The replicas were washed twice on ddH 2 O and picked up with 700-mesh hexagonal copper grids. The grids were investigated at 60 kV in a JEOL JEM-1010 TEM instrument.
Immunofluorescence microscopy
For immunofluorescence microscopy 2 ml of an exponential-phase G. obscuriglobus culture was centrifuged at 2,500 g for 2 min. The supernatant was discarded and cells were dissolved in 3% paraformaldehyde (PFA). After incubation at 4 °C over night (ON) cells were washed three times with phosphate buffered saline (PBS). For permeabilisation, cells were resuspended in 150 μl ice cold resuspension buffer (50 mM Tris/HCL, 10 mM Na 2 EDTA X 2H 2 O pH 8.0, 0.1 mg ml −1 ) and subsequently 150 μl disruption buffer (200 mM NaOH, 1% SDS) was added. Samples were five times gently inverted and incubated for 15 min at RT. Afterwards, cells were washed three times in PBS and for further treatment dissolved in 1 ml × 1 blocking reagent (Roche, Germany) and incubated for 2 h at room temperature (RT) with agitation (300 r.p.m.). The primary antibody (anti-Na + -F 1 F 0 -ATPase 54 ) diluted 1:100 in × 1 blocking reagent. Samples were incubated over night at 4 °C, washed three times with PBS and treated with the secondary antibody (Alexa-Fluor 488 goat anti-rabbit) 1:1,000 diluted in PBST and incubated for 3 h at RT in the dark. Finally, cells were washed three times with PBST and diluted in a corresponding volume of mounting medium (20 mM Tris pH 8.0, 0.5% N-propyl gallate, 90% glycerol) for WF fluorescence microscopy. For dSTORM experiments cells were finally diluted in dSTORM-MEA-buffer 55 . For WF quantification, 50 positive labelled cells were divided into two parts; the outer rim (400 nm) and the inner part. The intensity per area was determined for each part using NIS elements 4.11 ROI analysis function.
Immunolabelling on ultrathin sections
Samples were high pressure frozen (Leica EM Pact) and freeze substituted with a 98% ethanol solution containing 2% water and 0.5% formaldehyde (−90 °C for 50 h, temperature rise 10° in 4 h; −50 °C for 24 h, temperature rise 10° in 4 h; −30 °C for 12 h). Samples were transferred into 100% ethanol at −30 °C with several changes and then allowed to reach a temperature of 7 °C and embedded in LRWhite resin. After polymerization, ultrathin sections were cut with a diamond knife, collected with butvar-coated nickel grids and incubated with the anti-Na + -F 1 F 0 -ATPase 54 IgG antibody (1:20 dilution) overnight at 7 °C. After washing with PBS, sections were placed onto drops of protein A-gold (1:75 dilution, 15 nm in size) and were incubated for 1 h at room temperature. After washing with PBS containing 0.1% Tween 20, sections were further washed with TE- buffer and distilled water. Counterstaining of the sections was performed with 4% uranyl acetate for 1 min before examination in a Zeiss TEM 910 transmission electron microscope. For quantification 10 micrographs (3.5 μm 2 ) were analysed independently by three different researchers. Secretion system proteins in Planctomycetes Essential secretion system proteins (secretion system I to VI, as defined by the KEGG database) were analysed with BLASTp and PSI-BLAST in the NCBI database against Planctopirus limnophila , Gemmata obscuriglobus and Rhodopirellula baltica genomes. Proteins with a higher identity than 30%, an e-value lower than 1e-6 and with conserved domain architecture were assumed as correct. Only proteins with positive reciprocal blast verification are listed. If no homologue was found boxes are marked in white ( Supplementary Fig. 6 ). In cases the protein sequence was notified by the KEGG database for one of the three analysed Planctomycetes this sequence was used as reference sequence for further analyses. Proteome analysis 500 ml of a P. limnophila culture, cultivated for 3 days at 28 °C and 90 r.p.m. was harvested by centrifugation (5,000 × g for 15 min). The pellet was resuspended in 30 ml ice cold 20 mM MOPS buffer pH 8, 200 mM NaCl containing one dissolved EDTA-free protease inhibitor tablet (Roche). The cells were disrupted by cell homogenization (3 × 30 s 6.0 m s −1 ; MP Biomedicals). Cellular debris was removed by centrifugation (5,000 × g for 20 min). Membranes were separated from the soluble proteins by centrifugation (160,000 × g , 1 h, 4 °C). To isolate crude membrane fractions containing both cytoplasmic and outer membranes, cell extracts were subjected to isopycnic sucrose gradient centrifugation (1, 1.5, 2, and 2.5 M, 200,000 × g , 24 h, 12 °C). Afterwards, membranes were treated with carbonate buffer to remove membrane associated and cytosolic proteins 56 57 58 followed by a precipitation step to enrich the membrane proteins 58 59 . Precipitated proteins were washed in 400 μl of icecold methanol and pelleted by centrifugation (13,000 × g , 15 min, 4 °C). The pellet was initially dried in a Speedvac (Eppendorf concentrator plus) for 8 min, air-dried in an extractor hood and finally dissolved in 8 M urea, 2 M thiourea. Aliquots of 12–30 μg protein were separated via one dimensional SDS–polyacrylamide gel electrophoresis 60 . In gel digestion of proteins was carried out as described 60 by dividing each lane into eight subsamples with similar protein amounts which were densitometrically determined using AIDA software (Raytest Isotopenmeßgeräte GmbH). Extraction and desalting of the resulting peptides was done according to ref. 61 . For liquid chromatography—tandem mass spectrometry (LC–MS/MS) analysis a nanoAQUITY Ultra Performance Liquid Chromatography System (Waters Corporation, Milford, MA, USA) was coupled to an LTQ Orbitrap Velos Pro mass spectrometer (Thermo Fisher Scientific Inc). Peptides from each gel piece were solved in 3% acetonitrile and 0.1% formic acid, centrifuged for 20 min at 109,000 × g and loaded onto a BEH C18 column, 130 Å, 1.7 μm, 75 μm × 250 mm at a flow rate of 0.35 μl min −1 (Waters Corporation). Elution of peptides from the column was performed using a 176 min gradient starting with 3.7% buffer B (80% acetonitrile and 0.1% formic acid) and 96.3% buffer A (0.1% formic acid in Ultra-LC–MS-water): 0–30 min 3.7% B; 30–51 min 3.7–22.1% B; 51–61 min 22.1–27.0% B; 61–127 min 27–48.3% B; 127–150 min 48.3–62.5% B; 150–163 min 62.5–99% B; 163–166 min 99% B; 166–171 min 99–3.7% B, 171–176 min 3.7% B. Primary MS scans were performed in the Fourier transformation mode scanning an m / z of 400–2,000 with a resolution (full width at half maximum at m / z 400) of 60,000 and a lock mass of 445.12,003. Primary ions were fragmented in a data-dependent collision induced dissociation mode for the 20 most abundant precursor ions with an exclusion time of 12 s and analysed by the LTQ ion trap. The following ionization parameters were applied: normalized collision energy: 35, activation Q: 0.25, activation time: 10 ms, isolation width: 2 m / z , charge state: +2 to +4. The signal to noise threshold was set to 2,000. MS/MS data were analysed using MaxQuant (Max Planck Institute of Biochemistry, www.maxquant.org , version 1.4.1.2) and the following parameters: peptide tolerance 5 p.p.m.; a tolerance for fragment ions of 0.6 Da; variable modification: methionine oxidation, fixed modification: carbamidomethylation; a maximum of three modifications per peptide was allowed; a minimum of two unique peptides per protein; fixed false discovery rate of 1%. All samples were searched against a database containing all protein sequences of P. limnophila DSM 3776 extracted from NCBI at 07/21/2015 with a decoy mode of reverted sequences and common contaminants supplied by MaxQuant. A protein was considerably reliable identified when it was identified in two biological replicates. Detected proteins were analysed using PSI-BLAST in the NCBI database, against NR, expect the taxa Planctomycetes (taxid: 203,682). Data were analysed with an expected threshold of 0.001 and five iterations. For all BLAST searches, an e-value of 1e-6 and an identity of 30% or less conserved domains were used as cut off. Furthermore, proteins were analysed with HHpred 62 (Hidden Markov Model Database: pdb 70_01Mar16+SCOPe95_2.05; MSA generation Method: PSI-BLAST; with 3 iterations; http://toolkit.tuebingen.mpg.de/hhpred ) for structure homology analysis. Subcellular protein localization was predicted using PSORTb 3.0 ( http://www.psort.org/psortb/ ) 63 with the Gram-negative option. Detected proteins were further compared to our bioinformatic analyses, as well as to previous analyses 23 ( Supplementary Table 2 ).
Construction of the P. limnophila ΔMC mutant
We searched for homologues of the G. obscuriglobus MC protein gp4978 ( WP_010038441.1 ) in the P. limnophila genome using BLAST. Plim_1972 ( WP_013110233 ) was found to be most similar (E value 0, similarity 40%). In addition, the structure-based analysis for MC-like proteins was repeated for P. limnophila , as previously described 15 , leading to the identification of other potential MC proteins in addition to Plim_1972 ( Supplementary Fig. 9 ). Due to the highest sequence similarity, Plim_1972 (the only gp4978 homologue with an NCBI BLAST alignment score above 200) was selected for gene deletion. For Red/ET Recombination (GeneBridge) based deletion of the P. limnophila MC homologue, a fosmid library was prepared using EpiFOS Fosmid Library Production Kit (Epicentre). Approximately 1,377 clones were screened for the presence of Plim_1927 (PLIM_RS10200). Four positive clones were found, and clone P12H10 was further processed with the BAC Subcloning kit (GeneBridge). As linear template, the kanamycin resistance cassette from pCJ003 was amplified (primer: CJ590: 5′-GCC GCC GTT TCT AAT TGA ACT ATG CCA TTC TGA TGA TCG AGA TTC AGT TCG CGG TTT TAT GGA CAG CAA G-3′ and CJ591: 5′-TTC ACA TGT GTT TTC TCG ATA ATG AGC ATT TTT TGA TGA GAA TCT GCG ATG CGA CAC GGA AAT GTT GAA T-3′). After electroporation, five clones were tested for carrying the selective marker and the Plim_1972 gene. The insertion and insertion sides were tested using primers CJ590, CJ591 and CJ600 (TTT GAA TGG CGA CTG ATC GG), CJ 601 (GGT TTC TTC CAT GAA GTC CAG TT) respectively. Three positive clones were identified (pCJ0100-pCJ0102). pCJ0100 plasmid DNA was linearized using Hind III (Fermentas). Linear DNA (2–4 μg) was introduced into P. limnophila using electroporation, as described before 25 . Cells were incubated on M3 plates (30 μg ml −1 kanamycin & 30 μg ml −1 chloramphenicol) for 7 days at 28 °C. Eight selected clones were incubated with M3 (30 μg ml −1 kanamycin and 30 μg ml −1 chloramphenicol) for 8 days at 28 °C at 90 r.p.m. Clone 6 (ΔPlim_1972) was used for further investigations and subsequently named P. limnophila ΔMC. In order to validate the genetic background of P. limnophila DSM 3776 in comparison to P. limnophila ΔMC, two different PCRs (Taq polymerase Qiagen), targeting either the flank regions of gene Plim_1972 (primers: CJ787_F 5′-CGA AAC CGC TTG AAG ATG A-3′ and CJ788_R 5′-AAT ACA CAC CCA TGT GTT GTT GC-3′; 3,628 bp amplicon for WT and 1,295 bp for ΔMC) or the kanamycin cassette, that is unique to the ΔMC mutant (primer: CJ326a 5′-GCG GTT TTA TGG ACA GCA AG-3′ and CJ327a 5′-GCG ACA CGG AAA TGT TGA AT-3′; 1 kb amplicon) were performed ( Supplementary Fig. 10a,b ). To further validate P. limnophila ΔMC, an exponentially growing culture of WT and mutant cells was used to prepare protein extracts according to ref. 64 . Samples were heated to 99 °C for 5 min and subsequently separated on a 12% gel SDS–PAGE at 80 V for 20 min, following by 100 V for 1.5 h. PVDF membrane (Carl Roth) was equilibrated for 10 s in methanol and washed in ddH 2 O. SDS–PAGE gel and membrane were incubated for 10 min in transfer buffer and blotted in transfer buffer for 2.5 h at 90 V at 4 °C. The membrane was blocked with skim milk powder (0.1 g l −1 ) over night at RT. Anti-Plim_1972 IgG (rabbit; COVANCE, Denver, USA) was incubated as first antibody (dilution 1:1,000) for 1 h at RT. The membrane was washed three times with PBST. The horseradish peroxidase conjugated second anti-rabbit-antibody (dilution 1:500; Cell Signalling Technologies) was incubated for 1 h at RT. Afterwards, the membrane was washed for three times with PBST. For detection, a horseradish peroxidase substrate system Lumi-light (Roche) was used. The blot was analysed using the photo imager Fujifilm LAS-3000. Macromolecule uptake experiment For GFP uptake, 1 ml of a stationary phase liquid culture of G. obscuriglobus and P. limnophila were harvested and incubated as previously described 16 . Cells were washed after incubation with 1 ml tap water and further analysed using WF fluorescence light microscopy and SR-SIM. As negative control, cells were poisoned at 50 μM CCCP final concentration. For co-localization, samples were stained afterwards with Nile Red and DAPI. To determine a positive uptake, treated cells were compared to the negative control. To visualize the uptake of fluorescein-labelled dextran (40 kDa, Thermo Fisher) or Alexa 647 labelled dextran (10 kDa, Thermo Fisher), P. limnophila and G. obscuriglobus cells were incubated in growth medium for 1 h at 28 °C with a final concentration of 5 μg ml −1 dextran. Cells were either washed and analysed directly after incubation or stained with Nile Red and DAPI. For dSTORM experiments a 0.01% Polylysine coated glass bottom dish (MatTek) with Alexa 647 labelled dextran at a final concentration of 5 μg ml −1 served as negative control. The SR-Tesseler method was used for cluster analysis in control and P. limnophila / G. obscuriglobus feeding experiments employing a minimum range of 40 nm and a minimum localization of 20 as previously described 65 . To compare the uptake of P. limnophila WT and the ΔMC mutant, 10 ml cells were inoculated in 20 ml M3 medium and incubated for 6 days at 28 °C with slight agitation (90 r.p.m.). These cultures were divided into triplicates, diluted (1:3) with fresh M3 medium and incubated for 6 days at 28 °C. Subsequently cells were fed with 1 μg ml −1 dextran (10 kDa) and incubated for 1.5 h. Unlabelled cells and cells treated with 50 μM CCCP served as control. Subsequently cells were stained with DAPI and analysed using fluorescence microscopy. A minimum of 175 cells in three different fields of view for each replicate were analysed (in total 15,556 WT and 19,502 mutant cells). For SEM and TEM uptake experiments 1 ml of P. limnophila cells were inoculated 1:3 in M3 medium and incubated 4 days at 28 °C with slight agitation (90 r.p.m.) in a baffled flask. Cells were incubated with 100 μl of GP10-DX-20 (Gold Nanoparticles, Dextran Coated, 10 nm, 20 ml) in 1 ml 10 mM Tris pH 7.5 for up to 4 h at 28 °C. Subsequently cells were washed two times in sterile tap water and then fixed in 1% formaldehyde for 1 h at 4 °C. Direct stochastic optical reconstruction microscopy (dSTORM) dSTORM reconstruction was acquired with a Nikon Eclipse Ti (Nikon GmbH) inverse microscope in ‘Sedat' configuration, with 647 nm Fibre Laser and 405 nm Argon laser and a mercury vapour and bright field LED. Differential interference contrast (DIC) was used for WF overlays. Images where taken with the Nikon × 100/1.49 Oil APO TIRF objective and an ANDOR iXon3 camera. dSTORM-MEA-buffer was used as previously described 55 . A time series of 5,000–20,000 frames per image was recorded at ∼55 Hz with 300 mV excitation and was processed with NIS- Elements Imaging software 4.11 (Nikon). Minimum peak height was determined according to the signal intensity. Drift correction was applied for all analysed images. TEM and SEM analysis of planctomycetal appendices For negative staining thin carbon support films were prepared by sublimation of carbon onto a freshly cleaved mica surface. Samples were negatively stained with 0.5–2% (w/v) aqueous uranyl acetate, pH 5.0, air-dried and examined in a TEM 910 transmission electron microscope (Carl Zeiss AG) at an acceleration voltage of 80 kV. Images were taken at calibrated magnifications using a line replica. Images were recorded digitally with a Slow-Scan CCD-Camera (ProScan, 1,024 × 1,024) with ITEM-Software (Olympus Soft Imaging Solutions). For the detection of gold labelled dextran, 4 μl drops of the bacterial solution were placed onto Butvar-coated 300 mesh copper grids, allowed to settle for 5 min and washed with distilled water. After air drying, samples were coated with a thin carbon layer and examined in a field emission scanning electron microscope (Zeiss Merlin, Carl Zeiss AG) using the Everhart Thornley HESE2-detector at an acceleration voltage of 5 kV and at calibrated magnifications.
Data availability
The mass spectrometry proteomics data have been deposited in the ProteomeXchange Consortium database via the PRIDE (ref. 66 ) partner repository with dataset identifier PXD005738. The authors declare that all other data supporting the findings of this study are available within the paper and its Supplementary Information Files , or from the corresponding author on request.
Supplementary Material Supplementary Information Supplementary Figures, Supplementary Tables and Supplementary References Supplementary Movie 1 Full CET tomogram of slices shown in Figure 3a-f Supplementary Movie 2 Animation of the 3D reconstruction shown in Supplementary Figure 7i Supplementary Movie 3 Animation of the 3D reconstruction shown in Figure 5g Supplementary Movie 4 Animation of the 3D reconstruction shown in Supplementary Figure 9g Peer Review File
📊 Figures
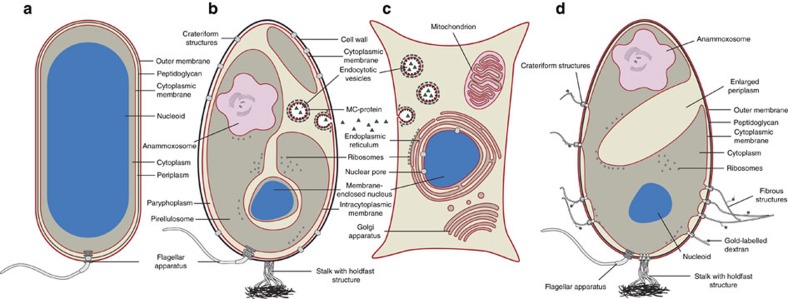
Figure 1
Cellular structures of a typical bacterium, planctomycetes and eukaryotes.
( a ) A typical Gram-negative prokaryote is surrounded by an outer membrane (OM), a peptidoglycan (PG) cell wall and the cytoplasmic membrane (CM). The DNA forms the nucleoid and occupies a major port...
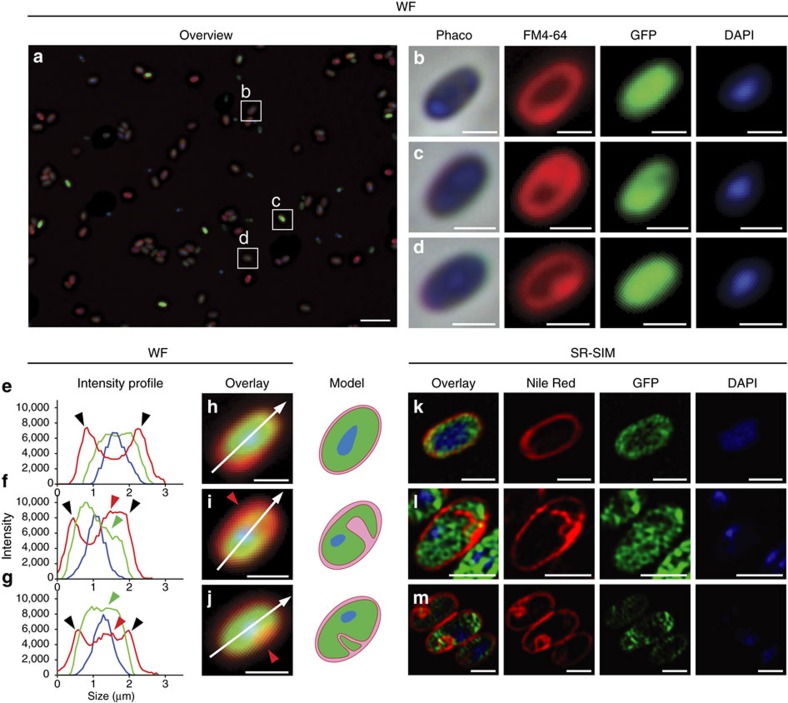
Figure 2
Planctopirus limnophila cells possess diverse enlargements of the periplasmic space.
( a u2013 m ) P. limnophila cells were engineered to produce GFP as cytoplasmic marker (green), while nucleoids and membranes were stained blue (DAPI) and red (wide field (WF): FM4u201364, super resol...
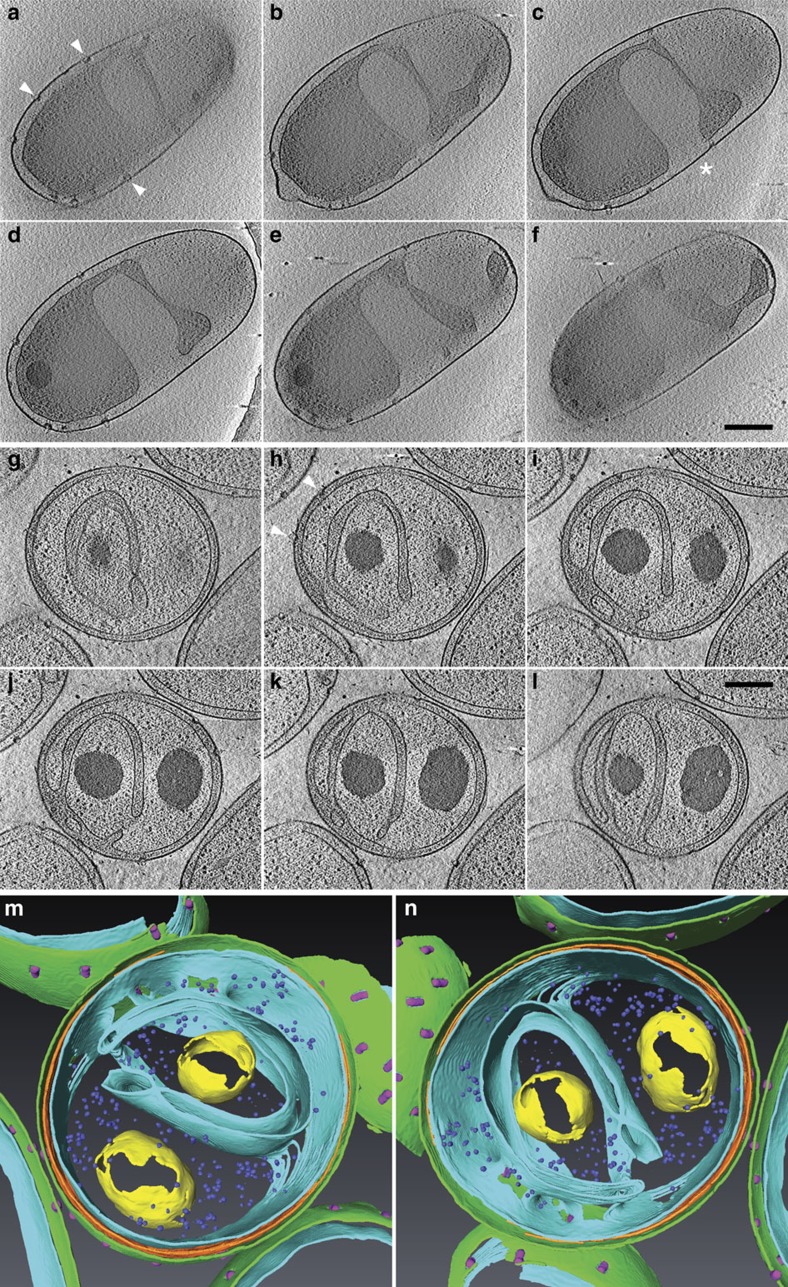
Figure 3
Cryo-electron tomography of Planctopirus limnophila cells.
( a u2013 f ) Representative slices of a whole cell tomogram with inter-slice distances of 71, 71, 64, 71 and 64u2009nm from top left to bottom right ( Supplementary Movie 1 ). The membrane is heavily...
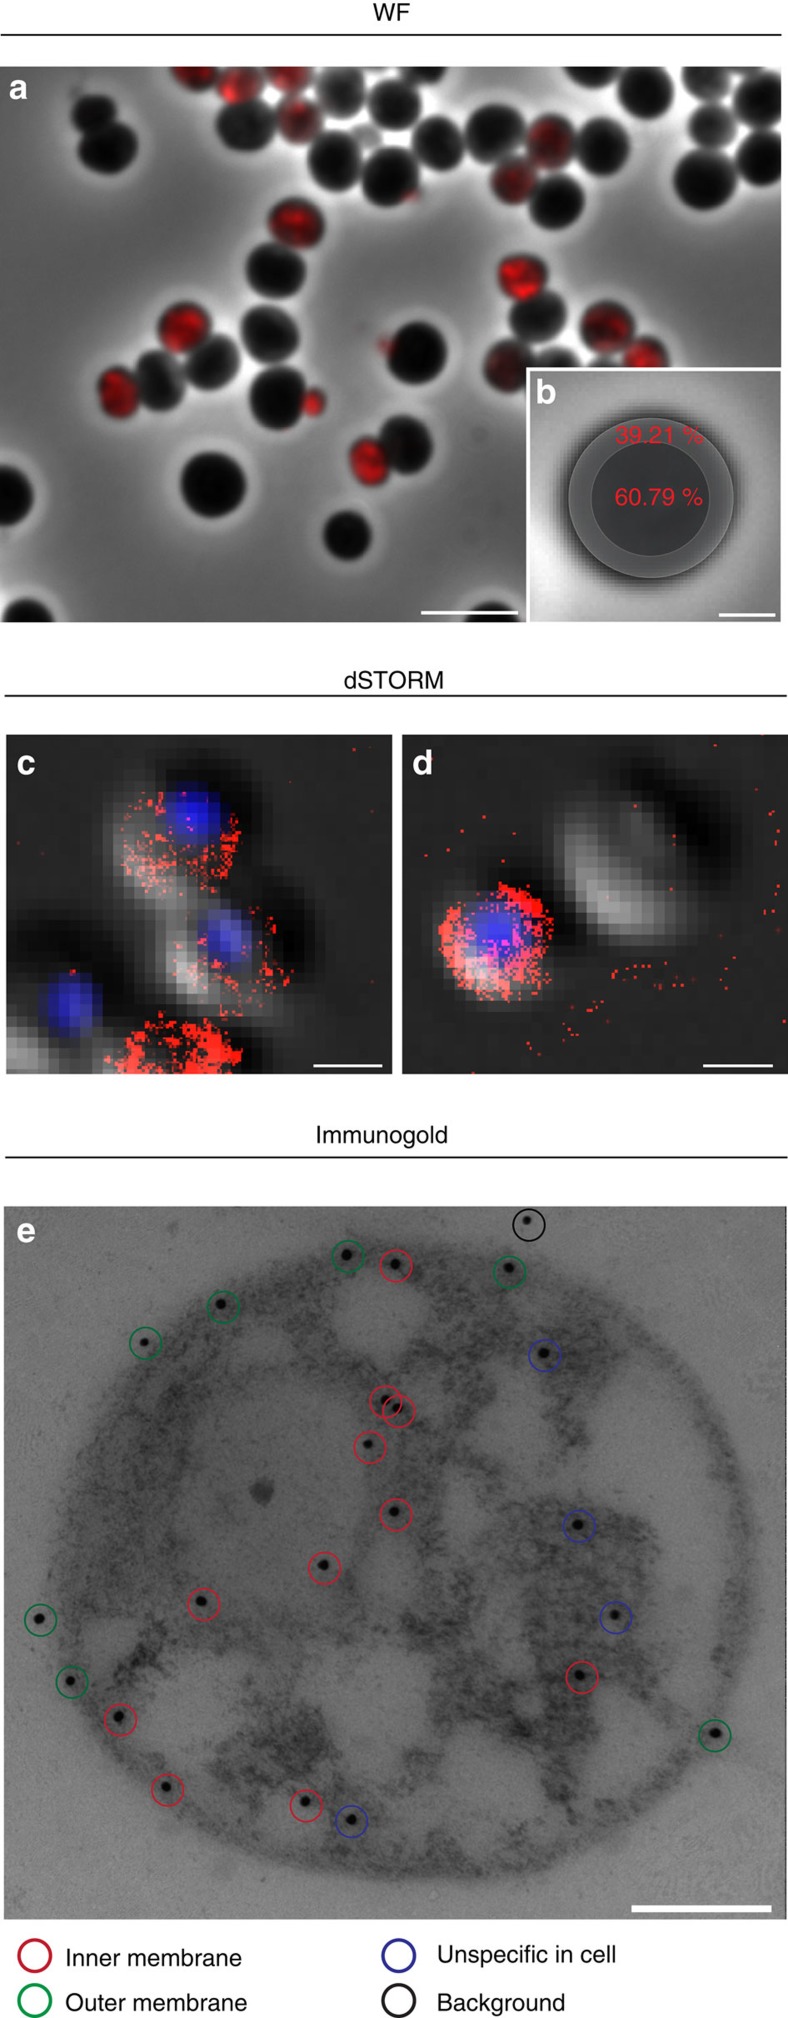
Figure 4
The innermost planctomycetal membrane is energized.
( a ) Overlay of the wide field (WF) fluorescence signal from a representative ATPase localization experiment (red, anti-Na + -F1F0-ATPase antibody) with the corresponding phase contrast (phaco) micro...
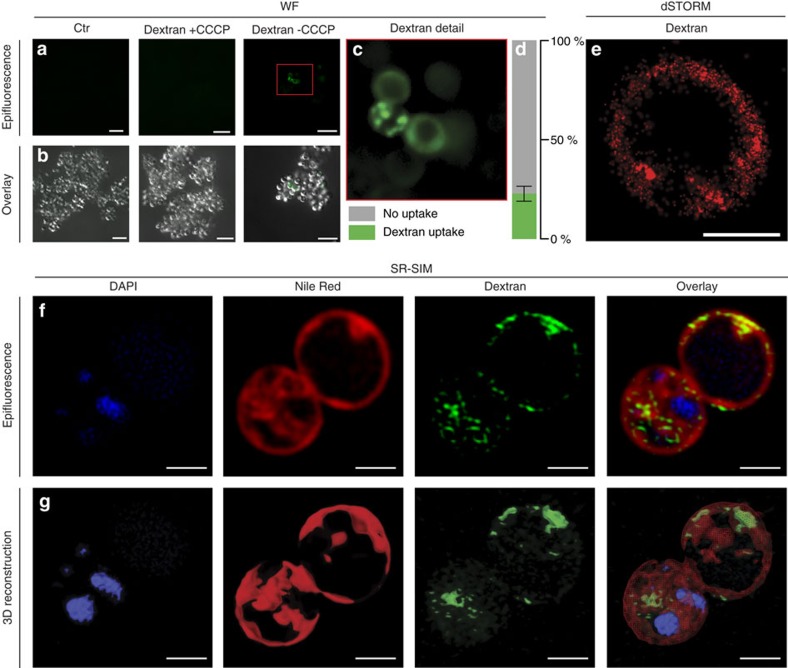
Figure 5
Gemmata obscuriglobus takes up high-molecular weight dextran polysaccharides.
( a u2013 c ) Wide field (WF) microscopy of G. obscuriglobus cells that were either untreated (Ctr) or fed with fluorescein-labelled 40u2009kDa dextran (Dextran). Prior to addition of dextran cell sam...
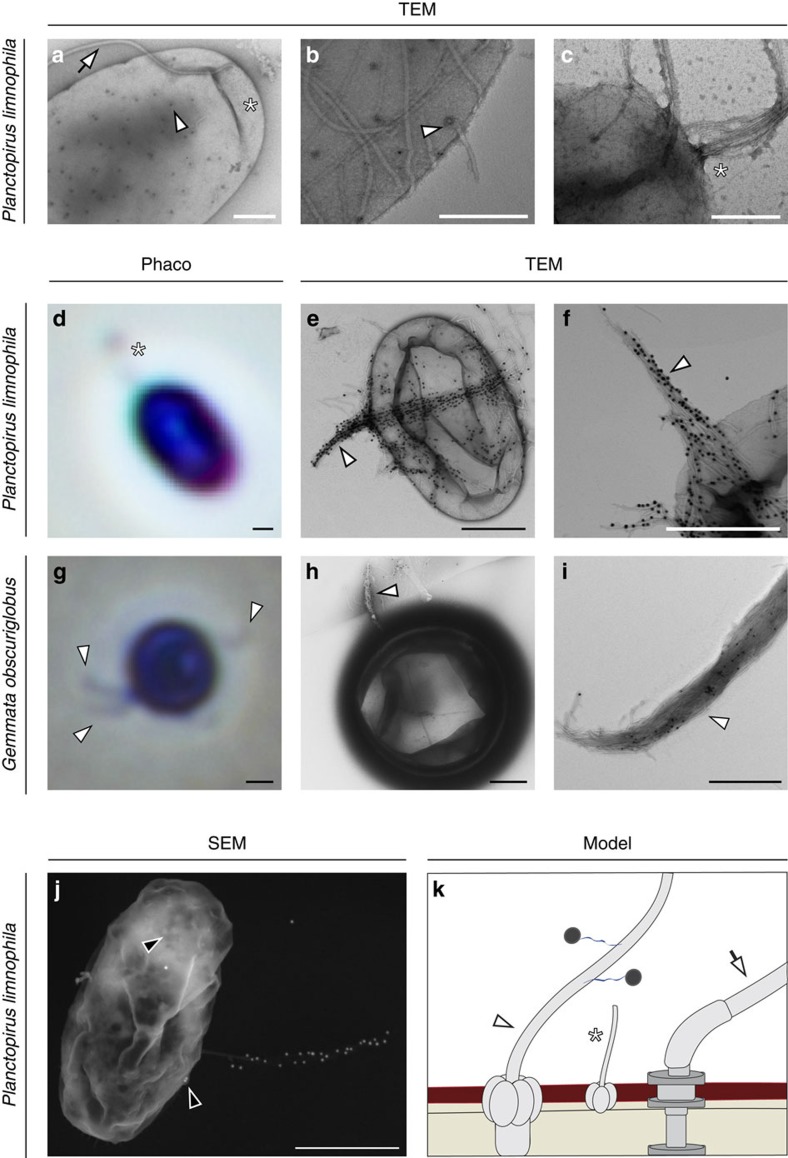
Figure 6
Planctopirus limnophila and Gemmata obscuriglobus possess fibres that bind to dextran.
( a u2013 c ) TEM analysis of P. limnophila cells revealed multiple distinct appendages. The flagellum ( a , white arrow) with a diameter of 22u2009nm is typical for bacteria. In contrast, large- ( a ...
Figure images are served from the NIH/NLM PubMed Central Open Access Subset or Europe PMC; copyright remains with the publishers and authors.
💬 Discussion
0 commentsNo comments yet. Be the first to start a discussion!
Leave a Comment