Abstract
Molecular recognition reagents are key tools for understanding biological processes and are used universally by scientists to study protein expression, localisation and interactions. Antibodies remain the most widely used of such reagents and many show excellent performance, although some are poorly characterised or have stability or batch variability issues, supporting the use of alternative binding proteins as complementary reagents for many applications. Here we report on the use of Affimer proteins as research reagents. We selected 12 diverse molecular targets for Affimer selection to exemplify their use in common molecular and cellular applications including the (a) selection against various target molecules; (b) modulation of protein function in vitro and in vivo; (c) labelling of tumour antigens in mouse models; and (d) use in affinity fluorescence and super-resolution microscopy. This work shows that Affimer proteins, as is the case for other alternative binding scaffolds, represent complementary affinity reagents to antibodies for various molecular and cell biology applications.
🔬 Techniques
🔭 Microscopes
🧬 Organisms
💻 Software
✨ Fluorophores
🧪 Sample Preparation
🔬 Cell Lines
🏭 Microscope Brands
🧪 Reagent Suppliers
📷 Detectors
💻 Software Details
📋 Protocols
💻 Code & Software
💾 Data Repositories
🏷️ Research Resource Identifiers (RRIDs)
Verified research resources used in this paper:
🏛️ Research Organizations (ROR)
Affiliated research institutions:
📋 Methods
Expression and purification of targets Human
SH2 domain coding sequences were in kanamycin-resistant pET28 SacB AP vectors (Open Biosystems), with an N-terminal histidine tag. A biotin acceptor peptide (BAP) sequence was cloned into the vector to give an N-terminal BAP-Histag-SH2 domain sequence and the modified vector DNA introduced into Rosetta 2 (DE3) cells. Single colonies were grown in 10 ml Terrific Broth (TB) supplemented with 100 µg/ml kanamycin and 34 µg/ml chloramphenicol, overnight at 37°C and 2 ml was used to inoculate 400 ml TB/100 µg/ml kanamycin and cultures grown until OD 600 ~2. After cooling to 18°C, for 1 hr IPTG was added to 0.5 mM. Cells were collected by centrifugation (800 g ; 20 min, 4°C) and resuspended in 10 ml Lysis buffer 1 (50 mM NaH 2 PO 4 ; 300 mM NaCl; 30 mM imidazole; 10% glycerol; Benzonase Nuclease (Novagen); 1% Halt Protease Inhibitor Cocktail, EDTA-free; 1% Triton-X100; 1% lysozyme) and left rocking overnight at 18°C before target proteins were purified using Amintra Ni-NTA resin (Expedeon). Proteins were eluted using elution buffer (50 mM NaH 2 PO 4 ; 500 mM NaCl; 300 mM imidazole; 10% glycerol). Expression and in vivo biotinylation of targets was confirmed by western blotting. The UL49 gene of Herpesvirus of Turkeys (HVT) was amplified by PCR using Q5 DNA polymerase (NEB, UK) and cloned using the Gibson Assembly kit (NEB) into a modified pMT-V5/6His (Invitrogen) in which the V5/6His cassette was replaced with 6His-AviTag and a SmaI site that was used to generate an N-terminal fusion to the UL49 gene product. pMT HVT UL49 was co-transfected with pCoHygro (Invitrogen) into Drosophila S2 cells using calcium phosphate precipitation and stably transformed cells were selected with hygromycin according to the manufacturer’s instructions (Invitrogen) before expression testing by western blot analysis 24 hr after induction with 500 µM copper sulphate. For purification, protein was extracted from stably transformed cells 36 hr after induction with copper sulphate at 20°C using a modified lysis buffer (25 mM Tris (pH8), 1.5% Triton-X100, 50 mM arginine (pH8), 10 mM imidazole, 7.5% glycerol, 300 mM KCl). Protein was eluted from Ni-NTA (QIAGEN) in elution buffer (25 mM Tris (pH8), 50 mM arginine (pH8), 200 mM imidazole, 7.5% glycerol, 300 mM KCl). Purified protein was subjected to in vitro biotinylation using purified BirA according to the manufacturer’s instructions (Avidity LLC). Preparation of 2,4,6-trinitrobenzene protein conjugate A 2,4,6-trinitrobenzene protein conjugate was prepared by mixing ovalbumin (fraction VI, Sigma) or Rabbit Gamma Globulin (RGG) (Sigma) at a concentration of 1 mg ml −1 with 0.05% (w/v) 2,4,6-trinitrobenzene sulfonic acid (TNBSA) (Thermo Scientific) in 0.1 M sodium bicarbonate buffer (pH 8.5). The mixture was incubated at 37°C for 2 hr and the resultant complex was then buffer exchanged into PBS and concentrated using a Vivaspin six column (MWCO: 10 kDa; Sartorius) to eliminate unconjugated TNBSA and excess buffer. The concentrated product was quantified using a Pierce Micro Bicinchoninic Acid (BCA) Assay (Thermo Scientific), in accordance to manufactures guidelines using bovine serum albumin as the comparative standard protein. Phage display Target biotinylation and selection of Affimers by phage display was performed as described previously ( Tiede et al., 2014 ) with some modifications in the second and third panning round. Biotinylated targets were bound to streptavidin-coated wells (Pierce) for 1 hr, then 10 12 cfu pre-panned phage (phage preincubated in streptavidin-coasted wells) were added for 2.5 hr with shaking. Panning wells were washed 10 times and phage eluted with 50 mM glycine–HCl (pH 2.2) for 10 min, neutralised with 1 M Tris–HCL (pH 9.1), further eluted with triethylamine 100 mM for 6 min, and neutralised with 1 M Tris–HCl (pH 7). Eluted phage were used to infect ER2738 cells for 1 hr at 37°C and 90 rpm then plated onto LB agar plates with 100 µg/ml carbenicillin and grown overnight. Colonies were scraped into 5 ml of 2TY medium, inoculated in 25 ml of 2TY medium with carbenicillin (100 µg/ml) and infected with ca. 1 × 10 9 M13K07 helper phage. After 1 hr at 90 rpm, kanamycin was added to 25 μg/ml for overnight at 25°C and 170 rpm. Phage were precipitated with 4% polyethylene glycol 8000, 0.3 M NaCl and resuspended in 1 ml of 10 mM Tris, pH 8.0, 1 mM EDTA (TE buffer). A 2 µl aliquot of phage suspension was used for the second round of selection using streptavidin magnetic beads (Invitrogen). Target labelled beads were washed and incubated with pre-panned phage for 1 hr then washed five times using a KingFisher robotic platform (ThermoFisher), incubated overnight at RT in 20% glycerol in PBS-T with at least one additional wash step and eluted and amplified as above. The final pan used neutravidin high binding capacity plates (Pierce), as previously described for panning round one with the addition of a final overnight incubation at RT in 20% glycerol in PBS-T, and phage eluted using 100 µl of 100 mM dithiothreitol. Phage eluates were recovered from wells containing target protein and control wells to determine the level of amplification in target wells. For counter selections appropriate cell lysates or homologous proteins were added to the phage at a concentration of at least 10 µg/ml for 1 hr at room temperature before transferring the phage to the panning beads or wells. Counter screens were performed for UL49 target against purified Marek’s Disease Virus type 1 (MDV-1, strain RB1B) and Duck enteritis virus (DEV strain 684), as well as cell lysate derived from Chicken Embryonic Fibroblasts (CEF). The TNBS-Ovalbumin was counter selected against ovalbumin. In the second and third pan, after washing the wells/beads post incubation with the phage library, the wells/beads were incubated over night at RT in 20% glycerol in PBS-T with at least one additional wash step prior to elution. Phage were eluted in 100 µl 50 mM glycine–HCl (pH 2.2) for 10 min, neutralised with 15 µl 1 M Tris–HCl (pH 9.1), further eluted with 100 µl triethylamine 100 mM for 6 min, and neutralized with 50 µl 1 M Tris–HCl (pH 7). Phage ELISA screening was performed, as previously described, on randomly selected clones from the final pan round as a method for selecting positive clones for further evaluation ( Tiede et al., 2014 ). Affimer protein production Selected Affimer coding regions were amplified by PCR amplification using one of two reverse primers that would generate proteins with or without a C-terminal cysteine. Following NheI/NotI digestion the coding regions were ligated into a pET11a-derived vector and subsequently expressed in BL21 (DE3) cells as previously described ( Tiede et al., 2014 ). Briefly, a single colony was used to inoculate a 5 ml overnight culture in 2TY/100 µg/mL carbenicillin. Then 50 ml LB-carb media was inoculated with 1 ml of overnight culture and grown for about 2 hr at 37°C and 230 rpm to an OD 600 between 0.6–0.8, before addition of IPTG to 0.1 mM and further grown for 6–8 hr or overnight at 25°C at 150 rpm. Cells were harvested, lysed in 1 ml Lysis buffer. The lysate was then incubated with 300 µl of washed NiNTA slurry for 1 hr, washed (50 mM NaH2PO4, 500 mM NaCl, 20 mM Imidazole, pH 7.4) and eluted in 50 mM (NaH2PO4, 500 mM NaCl, 300 mM Imidazole, 20% glycerol, pH 7.4). Biotinylation of Affimers Affimers with C-terminal cysteine were biotinylated directly after elution. For each Affimer 150 µl tris (2-carboxyethyl)phosphine (TCEP) immobilised resin (ThermoFisher Scientific) was washed and incubated with 150 µl of 40 µM Affimer solution on a rocker for 1 hr. The solution was centrifuged for 1 min at 1500 g and 120 µl of the supernatant was transferred into a fresh tube containing 6 µl of 2 mM biotin-maleimide (Sigma) and incubated for 2 hr at room temperature. Excess biotin linker was removed by using a Zeba spin desalting column (Thermo Scientific) according to the manufacturer’s protocol or by dialysis.
Show full methods section
Expression and purification of targets Human
SH2 domain coding sequences were in kanamycin-resistant pET28 SacB AP vectors (Open Biosystems), with an N-terminal histidine tag. A biotin acceptor peptide (BAP) sequence was cloned into the vector to give an N-terminal BAP-Histag-SH2 domain sequence and the modified vector DNA introduced into Rosetta 2 (DE3) cells. Single colonies were grown in 10 ml Terrific Broth (TB) supplemented with 100 µg/ml kanamycin and 34 µg/ml chloramphenicol, overnight at 37°C and 2 ml was used to inoculate 400 ml TB/100 µg/ml kanamycin and cultures grown until OD 600 ~2. After cooling to 18°C, for 1 hr IPTG was added to 0.5 mM. Cells were collected by centrifugation (800 g ; 20 min, 4°C) and resuspended in 10 ml Lysis buffer 1 (50 mM NaH 2 PO 4 ; 300 mM NaCl; 30 mM imidazole; 10% glycerol; Benzonase Nuclease (Novagen); 1% Halt Protease Inhibitor Cocktail, EDTA-free; 1% Triton-X100; 1% lysozyme) and left rocking overnight at 18°C before target proteins were purified using Amintra Ni-NTA resin (Expedeon). Proteins were eluted using elution buffer (50 mM NaH 2 PO 4 ; 500 mM NaCl; 300 mM imidazole; 10% glycerol). Expression and in vivo biotinylation of targets was confirmed by western blotting. The UL49 gene of Herpesvirus of Turkeys (HVT) was amplified by PCR using Q5 DNA polymerase (NEB, UK) and cloned using the Gibson Assembly kit (NEB) into a modified pMT-V5/6His (Invitrogen) in which the V5/6His cassette was replaced with 6His-AviTag and a SmaI site that was used to generate an N-terminal fusion to the UL49 gene product. pMT HVT UL49 was co-transfected with pCoHygro (Invitrogen) into Drosophila S2 cells using calcium phosphate precipitation and stably transformed cells were selected with hygromycin according to the manufacturer’s instructions (Invitrogen) before expression testing by western blot analysis 24 hr after induction with 500 µM copper sulphate. For purification, protein was extracted from stably transformed cells 36 hr after induction with copper sulphate at 20°C using a modified lysis buffer (25 mM Tris (pH8), 1.5% Triton-X100, 50 mM arginine (pH8), 10 mM imidazole, 7.5% glycerol, 300 mM KCl). Protein was eluted from Ni-NTA (QIAGEN) in elution buffer (25 mM Tris (pH8), 50 mM arginine (pH8), 200 mM imidazole, 7.5% glycerol, 300 mM KCl). Purified protein was subjected to in vitro biotinylation using purified BirA according to the manufacturer’s instructions (Avidity LLC). Preparation of 2,4,6-trinitrobenzene protein conjugate A 2,4,6-trinitrobenzene protein conjugate was prepared by mixing ovalbumin (fraction VI, Sigma) or Rabbit Gamma Globulin (RGG) (Sigma) at a concentration of 1 mg ml −1 with 0.05% (w/v) 2,4,6-trinitrobenzene sulfonic acid (TNBSA) (Thermo Scientific) in 0.1 M sodium bicarbonate buffer (pH 8.5). The mixture was incubated at 37°C for 2 hr and the resultant complex was then buffer exchanged into PBS and concentrated using a Vivaspin six column (MWCO: 10 kDa; Sartorius) to eliminate unconjugated TNBSA and excess buffer. The concentrated product was quantified using a Pierce Micro Bicinchoninic Acid (BCA) Assay (Thermo Scientific), in accordance to manufactures guidelines using bovine serum albumin as the comparative standard protein. Phage display Target biotinylation and selection of Affimers by phage display was performed as described previously ( Tiede et al., 2014 ) with some modifications in the second and third panning round. Biotinylated targets were bound to streptavidin-coated wells (Pierce) for 1 hr, then 10 12 cfu pre-panned phage (phage preincubated in streptavidin-coasted wells) were added for 2.5 hr with shaking. Panning wells were washed 10 times and phage eluted with 50 mM glycine–HCl (pH 2.2) for 10 min, neutralised with 1 M Tris–HCL (pH 9.1), further eluted with triethylamine 100 mM for 6 min, and neutralised with 1 M Tris–HCl (pH 7). Eluted phage were used to infect ER2738 cells for 1 hr at 37°C and 90 rpm then plated onto LB agar plates with 100 µg/ml carbenicillin and grown overnight. Colonies were scraped into 5 ml of 2TY medium, inoculated in 25 ml of 2TY medium with carbenicillin (100 µg/ml) and infected with ca. 1 × 10 9 M13K07 helper phage. After 1 hr at 90 rpm, kanamycin was added to 25 μg/ml for overnight at 25°C and 170 rpm. Phage were precipitated with 4% polyethylene glycol 8000, 0.3 M NaCl and resuspended in 1 ml of 10 mM Tris, pH 8.0, 1 mM EDTA (TE buffer). A 2 µl aliquot of phage suspension was used for the second round of selection using streptavidin magnetic beads (Invitrogen). Target labelled beads were washed and incubated with pre-panned phage for 1 hr then washed five times using a KingFisher robotic platform (ThermoFisher), incubated overnight at RT in 20% glycerol in PBS-T with at least one additional wash step and eluted and amplified as above. The final pan used neutravidin high binding capacity plates (Pierce), as previously described for panning round one with the addition of a final overnight incubation at RT in 20% glycerol in PBS-T, and phage eluted using 100 µl of 100 mM dithiothreitol. Phage eluates were recovered from wells containing target protein and control wells to determine the level of amplification in target wells. For counter selections appropriate cell lysates or homologous proteins were added to the phage at a concentration of at least 10 µg/ml for 1 hr at room temperature before transferring the phage to the panning beads or wells. Counter screens were performed for UL49 target against purified Marek’s Disease Virus type 1 (MDV-1, strain RB1B) and Duck enteritis virus (DEV strain 684), as well as cell lysate derived from Chicken Embryonic Fibroblasts (CEF). The TNBS-Ovalbumin was counter selected against ovalbumin. In the second and third pan, after washing the wells/beads post incubation with the phage library, the wells/beads were incubated over night at RT in 20% glycerol in PBS-T with at least one additional wash step prior to elution. Phage were eluted in 100 µl 50 mM glycine–HCl (pH 2.2) for 10 min, neutralised with 15 µl 1 M Tris–HCl (pH 9.1), further eluted with 100 µl triethylamine 100 mM for 6 min, and neutralized with 50 µl 1 M Tris–HCl (pH 7). Phage ELISA screening was performed, as previously described, on randomly selected clones from the final pan round as a method for selecting positive clones for further evaluation ( Tiede et al., 2014 ). Affimer protein production Selected Affimer coding regions were amplified by PCR amplification using one of two reverse primers that would generate proteins with or without a C-terminal cysteine. Following NheI/NotI digestion the coding regions were ligated into a pET11a-derived vector and subsequently expressed in BL21 (DE3) cells as previously described ( Tiede et al., 2014 ). Briefly, a single colony was used to inoculate a 5 ml overnight culture in 2TY/100 µg/mL carbenicillin. Then 50 ml LB-carb media was inoculated with 1 ml of overnight culture and grown for about 2 hr at 37°C and 230 rpm to an OD 600 between 0.6–0.8, before addition of IPTG to 0.1 mM and further grown for 6–8 hr or overnight at 25°C at 150 rpm. Cells were harvested, lysed in 1 ml Lysis buffer. The lysate was then incubated with 300 µl of washed NiNTA slurry for 1 hr, washed (50 mM NaH2PO4, 500 mM NaCl, 20 mM Imidazole, pH 7.4) and eluted in 50 mM (NaH2PO4, 500 mM NaCl, 300 mM Imidazole, 20% glycerol, pH 7.4). Biotinylation of Affimers Affimers with C-terminal cysteine were biotinylated directly after elution. For each Affimer 150 µl tris (2-carboxyethyl)phosphine (TCEP) immobilised resin (ThermoFisher Scientific) was washed and incubated with 150 µl of 40 µM Affimer solution on a rocker for 1 hr. The solution was centrifuged for 1 min at 1500 g and 120 µl of the supernatant was transferred into a fresh tube containing 6 µl of 2 mM biotin-maleimide (Sigma) and incubated for 2 hr at room temperature. Excess biotin linker was removed by using a Zeba spin desalting column (Thermo Scientific) according to the manufacturer’s protocol or by dialysis.
Immunoprecipitation and western blot analysis
Western blotting was performed on expressed BAP-tagged SH2 domains to check in vivo biotinylation of the targets. Protein samples were re-suspended in 4 X sample buffer (8% (w/v) SDS, 0.2 M Tris-HCl (pH 7) 20% glycerol, 1% bromophenol blue) and heated to 95°C for 10 min. Samples were loaded onto a 15% SDS-polyacrylamide resolving gel with a 5% stacking gel. Electrophoresed samples were then transferred onto a PVDF membrane with 0.2 µm pore size using a Trans-Blot Turbo Transfer System (Bio-Rad, Hercules, USA). Membranes were blocked in 3% BSA in Tris buffered saline (TBS) containing 0.1% Tween-20 (TBS-T) overnight at 4°C followed by incubation with High Sensitivity Streptavidin-HRP (ThermoFisher Scientific) and visualised using Luminata Forte Western HRP Substrate (Merck Millipore). Cell lysates for pull down of Grb2 were isolated from U-2 OS cells (purchased from ATCC, STR profiled and mycoplasma negative - RRID: CVCL_0042 ). Cells were washed with ice-cold 1 X PBS and lysed in lysis buffer (50 mM Tris, 150 mM NaCl, 1% (v/v) Nonidet P-40, 1 ml per 75 cm 2 flask), on ice. The pull down experiment was performed using the KingFisher automated platform. In brief, Affimers were expressed in 50 ml BL21 Star (DE3) IPTG induced overnight culture, the BL21 Star (DE3) cells were pelleted, lysed and clarified by centrifugation. Cell lysate was incubated with cobalt-based magnetic beads (ThermoFisher) on Kingfisher platform for 10 min prior to a single wash, and incubated with U-2 OS cell lysate (approximately 500 µg) for 90 min. The beads were washed a further three times on the KingFisher prior to being added to 50 µl of elution buffer. A 15 µl aliquot of eluted proteins was mixed with loading buffer prior to being heated to 95°C for 5 min and loaded on to an SDS-PAGE gel. Western blot analysis was performed using a rabbit monoclonal anti-Grb2 antibody, (Abcam; ab32037) as primary antibody and anti-rabbit-HRP antibody, goat polyclonal (Signal Technology; 7074) as secondary (n = 2, biological replicate; the number of times the experiment was independently repeated). For p85 pull down experiments NIH-3T3 cells transfected with p85-nSH2 Affimers were lysed in CellLytic M Cell Lysis Reagent (Sigma) with protease inhibitor cocktail (Sigma) and lysates cleared by centrifugation. For AKT activation western blot analysis, cells were serum-starved for 30 min prior to protein harvesting. Immunoprecipitation of p85α involved incubating 400 μg of total protein with 3 μl of anti-p85α antibody (Abcam) at 4°C with rotation overnight followed by protein G Sepharose beads (Sigma) for 4 hr. The beads were washed four times with PBS and resuspended in 2 X SDS sample buffer with β-mercaptoethanol (Sigma), heated to 95°C for 3 min and proteins were resolved in 7% SDS-polyacrylamide gels. For western blotting, 20 μg of total protein was denatured using 5 X Laemmli sample buffer with β-mercaptoethanol and resolved in 12% SDS-polyacrylamide gels. Proteins were transferred to polyvinylidene difluoride membranes (Biorad), blocked in 5% bovine serum albumin in PBS 0.1% Tween, and incubated with anti-pAKT (Ser473), anti-panAKT, anti-p110α (Cell Signaling Technology), anti-flag M2 (Sigma), anti-tubulin alpha (AbD Serotec), and anti-p85α antibodies. Bound antibody was detected using anti-mouse/rabbit horseradish peroxidase-conjugated antibody and chemiluminescence (Luminata Forte Western HRP substrate, Millipore). For detection of VEGFR2 signalling HUVECs (primary human umbilical vascular endothelial cells) were lysed in 2% (w/v) SDS containing 1 mM PMSF, in PBS). For immunoblot analysis, lysates were incubated at 95°C for 5 min and sonicated for 3 s. 25 μg of cell lysate was re-suspended in an equal volume of 2 X SDS sample buffer (1 M Tris-HCl pH 6.8, 20% (v/v) glycerol, 4% (w/v) SDS and 0.1% (w/v) bromophenol blue, 4% (v/v) mercaptoethanol) and incubated at 95°C for 5 min. Lysates were loaded onto a 10% (v/v) SDS-polyacrylamide resolving gel with a 5% (w/v) SDS-polyacrylamide stacking gel and separated at 130 V for 90 min in SDS-running buffer (192 mM glycine, 25 mM Tris, 0.1% (w/v) SDS). Proteins subjected to SDS-PAGE were transferred onto nitrocellulose membrane (0.2 μm pore size) (Schleicher and Schuell) in transfer buffer (106 mM glycine, 25 mM Tris, 0.1% (w/v) SDS, 20% (v/v) methanol) at 300 mA for 3 hr at 4°C. Membranes were incubated in 5% (w/v) skimmed milk (in TBS-T) for 30–60 min on a rocker. Membranes were rinsed in TBS-T, incubated with primary antibodies (goat anti-VEGFR2 (R&D Systems), rabbit anti-phospho-VEGFR2 (Y1175), rabbit antibodies to native and phosphorylated PLCγ1 (Y783), c-Akt (S473), p38 MAPK (T180/Y182) and eNOS (S117), rabbit anti-ERK1/2, mouse anti-phospho-ERK1/2 (T202, Y204) (Cell Signalling Technologies), mouse anti-α-tubulin (Santa Cruz Biotechnology)) overnight at 4°C and washed 3 times for 10 min in TBS-T prior to incubation with HRP-conjugated secondary antibody (PerBio Sciences, Cramlington, UK) for 1 hr at room temperature, followed by a second round of TBS-T washes and detection using a chemiluminescent solution, EZ-ECL (Geneflow, Nottingham, UK).
Immuno- and Affinity-fluorescence for TRPV1
U2-OS cells were grown in DMEM medium supplemented with 10% (v/v) fetal bovine serum (ThermoFisher Scientific), 2 mM L-glutamine, 1% penicillin-streptomycin, 10 mM sodium pyruvate in 5% CO 2 in air at 37°C. Cells were seeded on to coverslips in 24-well plates to reach a density of ~60% at the time of transfection. Cells were transfected with rat TRPV1-encoding DNA 48 hr before use in ICC experiments using FuGENE Transfection Reagent (Promega) according to manufacturers’ instructions. At 48 hr post-transfection, Affimers were incubated on live cells at a final concentration of 5 μg/ml in assay buffer (130 mM NaCl, 10 mM glucose, 5 mM KCl, 2 mM CaCl 2 , 1.2 mM MgCl 2 , 10 mM HEPES, pH 7.4) for 20 min. Cells were then washed with the same buffer three times for 5 min per wash before fixation with 4% PFA for 10 min. Fixed cells were washed three times in PBS and then permeabilised with 0.1% Triton X100 in PBS. Cells were blocked for 30 min in 1% BSA in PBS at room temperature.
Mouse monoclonal anti-6X
His antibody (Abcam: Ab18184) was incubated on cells for one hour at room temperature. Cells were then washed three times with PBS and incubated for one hour in the dark with anti-mouse 488 antibody (Life Technologies: A11001) for 1 hr. A further two washes in PBS-T, two washes in PBS and one wash in ddH 2 0 was followed by mounting on to glass slides with ProLong Diamond Antifade Mountant with DAPI (ThermoFisher Scientific). The next day, samples were imaged using an EVOS FL imaging system (ThermoFisher Scientific). For co-localisation staining with anti-TRPV1 antibody, the same protocol was followed with an additional step in which a further 1 hr incubation was conducted with anti-TRPV1 antibody (Abcam: ab10295) post-fixation. Goat anti-guinea pig 647 (Abcam: ab150187) was then applied for the detection of anti-TRPV1 antibody for one hour at room temperature in the dark.
TRPV1 modulation assay
U2-OS cells were cultured using the above conditions. Cells were seeded in to T75cm flasks so that confluence would reach ~60% by the time of transfection. 24 hr post-transfection with TRPV1 DNA, cells were trypsinised in to black-walled 96 well-plates (Greiner Bio-One) at a confluence of ~100,000 cells per well and incubated for a further 24 hr under previously described cell culture conditions. On the day of the modulation assay, cells were washed with assay buffer and loaded with 50 μL Fluo-4 AM (1 μM) (ThermoFisher Scientific: F14201 ) for 1 hr at 37°C. Cells were washed again with 200 μL assay buffer prior to the addition of Affimer at a concentration of 1 μM in 50 μL assay buffer. Following 30 min of incubation at room temperature, the increase in intracellular Ca 2+ was measured using a Flexstation 3 (Molecular Devices; Sunnyvale, CA, USA). Fluorescence was detected for 60 sec at 485 nm excitation and 525 nm emission, but the peak Ca 2+ response (approximately 5 sec after addition of the orthosteric TRPV1 agonist, capsaicin) was used for the subsequent determination of the agonist response. Initially, the effect of Affimers on Ca 2+ response was tested at a capsaicin EC 20 concentration whilst subsequent experiments tested a range of capsaicin concentrations in a so-called curve shift assay. Relative peak fluorescence units were normalised to the response observed in the absence of Affimer.
Data analysis - ordinary one-way
ANOVA with multiple comparisons was conducted for modulation assays against an EC 20 concentration of capsaicin. P values less than 0.05 (*) 0.01 (**) and 0.001 (***) and 0.0001 (****) are indicated. Characterisation of binding to TNT and DNT analogues by competition ELISA Immulon2 HB 96-well micro-titre plates (Nunc) were coated with TNBS-ovalbumin conjugate at a concentration of 10 µg ml −1 in PBS (100 µl per well) and incubated overnight at 5°C. Each well was washed three times with PBS containing 0.05 % v/v Tween 20 (PBST) prior to blocking using 2% (w/v) skimmed milk powder (Marvel) in PBST (blocking buffer) by incubating for 60 min at room temperature. Each well was then washed and free TNBS-Ovalbumin, TNT or DNT analogue was diluted in blocking buffer and added to 6 replicate wells for each Affimer at a concentration of 100 µg/ml. Each hapten was then serially diluted down the plate to a final concentration of 0.78 µg/ml in blocking buffer. Subsequently, 50 µl of biotinylated Affimers TNT3, 4 and 9 (0.5 µg/ml) and TNT15 (1.0 µg/ml) in blocking buffer was added in replicate to each of the wells containing free hapten to allow for six technical replicate dilution curves of each free hapten molecule with each Affimer to be generated (technical replicate; the number of times the experiment was repeated within one experiment). For the negative control, the Affimer was substituted for blocking buffer. Each plate was incubated at room temperature for 1 hr, washed three times with PBST and Affimer that remained bound to the TNBS-Ovalbumin conjugate was detected using a high sensitivity streptavidin-HRP conjugate (ThermoFisher Scientific), diluted 1:2000 in blocking buffer. The presence of HRP was detected using hydrogen peroxide (Sigma) and ABTS substrate (Sigma) in substrate buffer (0.1 M Citric acid, 0.2 M Na 2 HPO 4 at pH 4.37) with the response quantified based on readings at 414 nm in an automated plate reader (Anthos 2001, Anthos Labtec Instruments).
Immuno- and Affinity-histochemistry for tenascin C
SW620 (mycoplasma tested - RRID: CVCL_0547 ) xenograft mice were sacrificed; tumours were harvested and embedded in paraffin wax. Xenograft tissue was then processed for tenascin C immunohistochemistry as follows. Briefly, 4 μm paraffin sections were cut and collected on poly-lysine coated slides. Sections were dewaxed in xylene solutions and rehydrated in graded alcohol followed by distilled water. Antigen retrieval was performed by pressure-cooking in 0.01 M citric acid buffer, pH 6.0. Following antigen retrieval, tissue sections were washed in distilled water and endogenous peroxidase was blocked with Bloxall blocking reagent (10 min, SP-6000; Vector Laboratories Ltd, Peterborough, UK). After washing with TBS-T, endogenous Avidin/Biotin was blocked using Avidin/Biotin blocking kit (SP-2001 Vector Laboratories Ltd, Peterborough, UK). Tissue sections were washed in TBS-T and non-specific protein binding sites were blocked using 1 X casein (20 min, SP-5020; Vector Laboratories Ltd, Peterborough, UK) prepared in antibody diluent (Sigma, Poole, UK). Sections were then incubated overnight (4°C) in mouse monoclonal anti-TNC antibody (1:25, 4F10TT, IBL, USA) and bound antibody was detected using the mouse on mouse polymer IHC kit (ab127055, Abcam, Cambridge, UK) according to the manufacturer’s instructions. Tissue sections were counterstained with haematoxylin, dehydrated, cleared and mounted in DPX. Images were captured an Axioplan Zeiss microscope and AxioVision 4.8 software (Carl Zeiss Inc. Germany).
Tissue staining using the TNC
Affimer was performed in a similar mannerhowever, after blocking non-specific protein binding sites with casein, sections were incubated in biotinylated TNC-Affimer overnight at 4°C. Sections were then washed in TBS-T and bound Affimer was visualized using Streptavidin/HRP (1:300, 30 min, SA-5004;, Vector Laboratories Ltd, Peterborough, UK) with 3,3′-diaminobenzidine (DAB) as substrate (SK41-05; ImmPACT DAB, Vector Laboratories Ltd, Peterborough, UK). Sections were counterstained and imaged as described previously.
Immuno- and Affinity-histochemistry for VEGFR2
Wax embedded tissue sections of human pancreatic tissue were collected and processed for immunostaining in a manner similar to that described above. After dewaxing and rehydrating the tissue sections, antigen retrieval for the VEGFR-2 epitope was carried out using Tris EDTA buffer (pH 9.0). Endogenous peroxidase, Avidin/Biotin and protein were blocked as described and tissue sections were incubated overnight at 4°C in rabbit monoclonal anti VEGFR2 antibody (1:25, clone 55B11, Cell Signaling Technology, Danvers, USA) or VEGFR2 Affimers (1–11 µg/ml). Bound antibody was visualized using polyclonal goat anti-rabbit biotinylated antibody (1:200, 30 min, clone E0432, DAKO, UK) and Streptavidin/HRP with DAB as substrate. Affimers were visualized using Streptavidin/HRP with DAB as substrate. Section were counterstained and imaged as described previously (n = 3).
Cell culture and transfection
MCF7 cells (purchased from ECACC, STR profiled and mycoplasma negative - RRID: CVCL_0031 ) were grown in RPMI medium supplemented with 10% (v/v) fetal bovine serum (ThermoFisher Scientific), 2 mM L-glutamine, 1% penicillin-streptomycin, 10 mM sodium pyruvate in 5% CO 2 in air at 37°C. Mouse fibroblasts, NIH-3T3, were cultured in Dulbecco's Modified Eagle's Medium (Sigma) with 10% FCS and 2 mM L-glutamine in a humidified atmosphere at 37°C in 5% CO 2 . Affimers specific to the N-terminal SH2 domain of p85 were transfected into NIH-3T3 using TransIT 293 (Mirus, Madison, USA) according to the manufacturers’ instructions.
Human umbilical vein endothelial cells
(HUVECs) were isolated and cultured in endothelial cell growth medium (ECGM). Human umbilical cords used for isolation of primary endothelial cells were provided by written informed consent in accordance with ethical guidelines and under ethical approval (reference CA03/020) of the Leeds NHS Hospitals Local Ethics Committee (UK). HUVECs were seeded into 6-well plates and cultured (for at least 24 hr) in ECGM until ~80% confluent, washed twice in PBS and then starved in MCDB131 plus 0.2% (w/v) BSA for 2–3 hr. HUVECS were treated with 0, 50, 100 or 150 μg/ml Affimer for 30 min prior to stimulation with 25 ng/ml VEGF-A (Genentech Inc., San Francisco, USA) for 0, 5 or 15 min. Chicken Embryonic Fibroblasts (CEF) were derived from 10 day embryos and maintained in E199 medium (Sigma) supplemented with 10% Tryptose phosphate broth (BD) and 5% foetal calf serum (Sigma), at 38.5°C. Virus infections were generated by lipofectamine transfection of BAC clones of either MDV-1 (RB1B strain), HVT or DEV (2085 strain). Briefly, 2 µg of BAC DNA was diluted into 100 µl of Opti-MEM reagent, and mixed with 10 µl lipofectamine (Invitrogen) diluted in 100 µl Opti-MEM (Invitrogen). After complex formation for 30 min a further 800 µl of Opti-MEM was added and the 1 ml sample transferred onto a well of a six well plate containing CEFs that had been rinsed twice with Opti-MEM. DNA complexes were left on CEFs for 6 hr in normal culture conditions after which 2 ml of growth medium was added per well and returned to the incubator. Once virus replication was established infected cells were passaged onto fresh CEFs as required to maintain the infection.
Affinity-fluorescence and in-cell western analysis
For immunofluorescence and in-cell Western experiments primary CEFs were infected with either MDV-1 (strain RB1B), HVT, or DEV (strain 2085). In all cases virus was derived from BAC clones by transfection into CEFs, these viruses constitutively express a GFP marker under the control of the thymidine kinase promoter present within the BAC element. For in-cell Western studies, infected cells were seeded into 96 well plates and allowed to adhere overnight. Cells were then fixed with 4% paraformaldehyde in PBS, washed with PBS, permeabilsed with 0.1% TritonX100 in PBS and blocked with 0.5% BSA in PBS for 30 min at room temperature. Affimers were then added at 1.5 µg/ml or a goat polyclonal anti-GFP antibody (Sicgen) at 1:2000 dilution in blocking buffer and incubated at room temperature for 1 hr. Samples were then extensively washed with PBSa before secondary antibody in blocking buffer was added. For in-cell Western, donkey anti goat 680 was used at 1:5000 dilution, with Streptavidin 800 conjugate at 1:5000 dilution (Licor), and incubated for 1 hr at room temperature, then extensively washed with PBS. In-cell Westerns were imaged using the Licor Odyssey system using both the 700 nm and 800 nm channels following the manufacturer’s recommendations. Images were exported from the manufacturer’s proprietary software and processed using Adobe Illustrator. For immunofluorescence the same approach was followed after seeding of cells to coverslips. Coverslips were incubated with Affimers as the only primary detection reagent, with subsequent labelling with streptavidin-568 conjugate (Invitrogen) at 1:1000 dilution. After washing off excess Streptavidin-568, cells were stained with DAPI, followed by three deionised water washes before mounting on a Vectashield mounting medium (Vector Laboratories). Immunofluorescence images were captured using a Leica SP5 system and manufacturer’s software, from the 488 nm channel, 568 nm channel and the 405 nm channel using the 63 x objective and treated as for in-cell Western images.
Determination of dissociation equilibrium constants
Amine coupling chips (sensor chip CM5, GE Healthcare) were primed in 0.1 M sodium acetate pH 5.6 and functionalized with EDC/NHS35 µl at 5 µL/min. Target protein (1 mg/mL) was immobilized to one flow cell (300–600 response units), at a flow rate of 5 µL/min and the flow cell was capped with 1 M ethanolamine-HCl (35 µL at 5 µL/min). The non-functionalised flow cell (acting as a blank) was treated with EDC/NHS (35 µL at 5 µL/min) and 1 M ethanolamine-HCl (35 µL at 5 µL/min. The system was primed in PBS supplemented with 0.1% TritonX 100. Five concentrations of Affimer (5–500 nM) were tested. Each concentration was flowed over both the functionalised and the non-functionalised flow cells at 40 μL/min and the association and dissociation rate constants k a and k d , respectively were calculated using the Biacore software allowing determination of the equilibrium dissociation constant, K D as below. d [ A B ] / − d t = k a [ A ] [ B ] ∙ d [ A B ] / d t = k d [ A B ] K D = k d / k a K D values were also determined using the Octet Red interferometer (Pall Fortebio) using streptavidin coated biosensors (AMC, 18–5019) as previously described ( Kumaraswamy and Tobias, 2015 ). All experiments were carried out in HBS-EP buffer (10 mM HEPES (pH 7.4), 150 mM NaCl, 3 mM EDTA, 0.005% (v/v) Tween 20). K D values were determined by binding each biotinylated Affimer to a row of AMC biosensors at a constant concentration of 50 nM. Next a 2-fold dilution of unlabelled purified protein starting at 41 nM was bound to the Affimers. Raw offset values were plotted against concentration of purified HVT UL49 protein, determined by densitometry, and modelled to one site-specific binding equation using Graphpad Prism 6. Labelling of Affimers with rhodamine red The C-terminal cysteine residues of Affimers TNC15C and GFP32C were labeled with Rhodamine Red C 2 maleimide (Thermo Fisher Scientific). Samples of Affimer (TNC15C or GFP32C) (80–200 µM) in elution buffer (50 mM NaH 2 PO 4 , 500 mM NaCl, 300 mM imidazole, 10% glycerol, pH 7.4) were dialysed (2 X with a dilution of 1000x) into labelling buffer (PBS containing 20% glycerol and 0.05% Tween-20; pH 7.4). The samples were then treated with TCEP in H 2 O at 2.5 mM and Rhodamine Red C 2 maleimide (20 mM in DMSO; 5 equiv.) and rocked for 6 hr. Upon completion assessed by mass spectrometry, the reactions were quenched with β-mercaptoethanol (100 equiv.) and the mixture was spin concentrated (3 kDa cut-off). The concentrated mixture was passed through a buffer exchange column (PD-10, GE Healthcare), eluting 0.5 mL fractions with labelling buffer. Fractions containing protein were identified by BioRad colorimetric assay and pooled taking care not to include fractions containing free Rhodamine Red dye that elute later. The labelled Affimers were then concentrated to 250–300 μM in a spin concentrator (3 kDa cut-off). The concentrations were estimated by SDS-PAGE analysis against known amounts of BSA as standard. The identities of labelled Affimers were confirmed by mass spectrometry. Samples were used immediately or flash frozen in liquid nitrogen and stored at −80°C until required. In vivo work All procedures were carried out in accordance with the Animals (Scientific Procedures) Act 1986 under project licence approval (PPL 70/7965). Ethical review and monitoring was undertaken by the Animal Welfare and Ethics Review Committee (AWERC) at the University of Leeds. Twenty-four 6–10 week old BALB/c nude female mice (originally obtained from Charles River, UK then maintained in-house) were injected subcutaneously in the right flank with 1 × 10 7 SW620 cells (obtained from ECACC and verified by single tandem repeat analysis). After 10–14 days of tumour growth, animals were randomised to receive either the tenascin C Affimer or a control GFP Affimer conjugated with Rhodamine Red C 2 maleimide, via tail vein injection (mean tumour volume tenascin C Affimer group 316.9 ± 192.0 mm 3 vs 360.8 ± 216.6 mm 3 in control GFP Affimer group; p=0.64). Approximately 300 µM labelled Affimer in 100 μL PBS with 20% glycerol and 0.05% Tween-20 was injected intravenously into each animal. Fluorescent images of harvested tissues (tumour, liver, kidney, spleen, heart, lung and brain) were captured ex vivo using IVIS Spectrum (excitation 570 nm, emission 620 nm; Perkin Elmer, USA) Fluorescence intensity (radiant efficiency in p/s/cm 2 /sr/μW/cm 2 ) for each tissue was determined for a region of interest of defined unit area using Living Image software (v4.3.1, Perkin Elmer). Mean background fluorescence intensity was normalized to sham injected control tumours and organs.
Super-resolution microscopy methods
HER4: (a) Cell labelling for binding curves Chinese Hamster Ovary (CHO) cells (STR profiled and mycoplasma tested) were seeded at a density of 0.75 × 10 5 cells dish on uncoated 35 mm no. 1.5 glass-bottomed dishes (MatTek Corporation, USA). Cells were transfected with HER4-CYT-eGFP the next day and were serum starved overnight the second day after transfection. MCF7 were seeded and grown for two days, before being starved overnight. Cells were rinsed and cooled to 4°C for 10 min, then labelled with HER4 Affimer labelled with CF640R (Biotium) in concentrations ranging from 1 to 100 nM (CHO/HER4-CYT-eGFP) or from 10 to 500 nM (MCF7). Labelling was carried out at 4°C for 1 hr. Cells were rinsed and fixed with 3% paraformaldehyde plus 0.5% glutaraldehyde for 15 min at 4°C then 15 min at room temperature. Imaging was carried out in PBS using the standard confocal mode in a Leica TCS sp8 (see Data analysis of binding curves below). HER4: (b) Data analysis of binding curves Fluorescence images acquired in photon counting mode were analysed using Fiji (ImageJ). Membrane signals were isolated using intensity threshold segmentation followed by dilation of the resulting binary mask. For each Affimer concentration, the pixel values of the segmented membrane areas from five imaged regions were combined to produce a histogram of pixel values. The mean and standard deviation of the pixel value distributions was plotted. HER4: (c) Cell labelling for super-resolution imaging CHO cells (1 × 10 5 ) were seeded in untreated 35 mm high-precision glass bottomed-dishes (MatTek Corporation, USA) and reverse transfected with HER4-CYT-eGFP at a ratio of 4 ul ViaFect (Promega) to 1 ug DNA.Two days later cells were labelled with 100 nM HER4 Affimer5 conjugated to Alexa 647 for 1 hr at 4°C. Cells were rinsed and fixed with 3% paraformaldehyde plus 0.5% glutaraldehyde for 15 min at 4°C then 15 min at room temperature before rinsing. HER4: (d) dSTORM imaging The super-resolution dSTORM images were taken in a Zeiss Elyra PS.1 system. The fluorophore Alexa Fluor 647 was photo-switched using 642 nm and 405 nm excitation lasers simultaneously, with 100 mM dithiothreitol in PBS as the switching buffer. The power density of the 642 nm and 405 nm illumination on the sample plane were about 4.6 kW/cm 2 and 0.4 kW/cm 2 . A 100× NA 1.46 oil immersion objective lens (Zeiss alpha Plan-Apochromat) and a multi-band dichroic filter (BP 420–480+ LP 650) were used in the imaging. The final fluorescent images were projected on an Andor iXon 897 EMCCD camera. Super-resolution dSTORM images were reconstructed in ZEISS ZEN software. A 25 nm localisation precision is obtained according to the histogram of the calculated localization precision from each fluorophore. HER4: (e) Cell labelling for single-molecule tracking experiments MCF7 cells were seeded at the density of 3 × 10 5 cells/dish onto 35 mm glass bottomed-dishes. Each dish contains a high-precision no. 1.5 ± 0.170 thickness glass bottom of 14 mm in diameter (MatTek Corporation, USA). The dishes were cleaned with Piranha solution and coated with 1% BSA, according to the protocol previously described ( Zanetti-Domingues et al., 2012 ). Prior to imaging, cells were starved for 2 hr at 37°C in serum free medium supplemented with 25 mM HEPES. After starvation, cells were rinsed twice with serum free medium pre-heated at 37°C. Labelling with fluorescently labelled Affimer was carried out for 10 min at 37°C. HER4 Affimer 5 (HER4-5) was conjugated in-house with CF640R (Biotium) maleimide dye following manufacturers’ instructions. Cells were rinsed twice with serum free medium pre-heated at 37°C and promptly imaged as described below. HER4: (f) Single-molecule acquisition Single-molecule images were acquired using an Axiovert 200M microscope with a TIRF illuminator (Zeiss, UK) and incorporating a 100 x oil-immersion objective (α-Plan-Fluar, NA = 1.45; Zeiss, UK) and an EMCCD (iXon X3; Andor, UK). Samples were illuminated with a 638 nm laser (100 mW, Vortran) fed into the microscope via a polarisation maintaining triple laser combiner (Oz Optics) . Alternatively, the 640 nm lines of a Vortran Combiner or of an Andor Revolution Laser Combiner were used. A wrap-around incubator (Pecon XL S1) was used to maintain a constant temperature of 37°C. The field of view of each channel was 80 × 30 μm. Data were acquired at 20 Hz for 30 s. Images were saved in HDF5 format for subsequent processing using custom-designed software. All Single-Molecule time series data were analysed using the multidimensional analysis software described previously ( Rolfe et al., 2011 ). Tubulin 3D direct stochastic optical reconstruction microscopy (3D dSTORM) (a) Sample preparation Affinity purified monoclonal rat anti-tubulin IgG2a antibody, clone YL1/2, (BioRad Antibodies) described previously ( Kilmartin et al., 1982 ; Wehland et al., 1983 ) was directly labeled with Alexa Fluor 647. Briefly, 20 μg of antibody was incubated with PBS containing 120 mM NaHCO 3 and 0.4 μg carboxylic acid succinimidyl ester Alexa Fluor 647 (A37573, Life Technologies Inc.) for 30 min at room temperature. Unincorporated dye was removed by gel filtration using NAP-5 columns (17-0853-02, GE Healthcare) following the manufacturers protocol. Antibody:dye labelling ratios of approximately 1:1 were confirmed by measured absorbance in a spectrophotometer, with a final concentration of 0.2 μg/μl. The C-terminal cysteine of Affimer 32, raised against tubulin, was labelled immediately after purification with the maleimide derivative of Alexa Fluor 647 (Thermo Fisher Scientific). Briefly, 150 μl of immobilized TCEP disulphide-reducing gel was washed three times with PBS containing 1 mM EDTA before being resuspended in 4 μl PBS containing 50 mM EDTA. The gel was incubated with 150 μl Affimer prepared at 0.5 mg/ml in PBS for 1 hr at room temperature to reduce the cysteine ready for labelling. The reduced Affimer was centrifuged at 1000 rpm for 1 min to pellet the gel and 130 μl of supernatant containing the Affimer was mixed with 6 μl of a 2 mM Alexa-647 maleimide stock and incubated at room temperature for 2 hr. Unbound Alexa Fluor 647 was removed by passing the labelled Affimer through a Zeba Spin Desalting Column, 7K MWCO (Thermo Scientific) according to the manufacturer’s instructions. The labelled Affimer was stored at 4°C at a final concentration of 0.5 mg/ml. Coverslips (#1.5, 25 mm diameter; Scientific Laboratory Supplies, MIC3350) were cleaned as described previously ( Shroff et al., 2007 ). HeLa cells were seeded at 2 × 10 5 cells per coverslip in 30 mm diameter culture dishes in DMEM (Gibco) supplemented with 10% FCS, 1% P/S and incubated at 37°C, 5% CO 2 for 24 hr. Cells were fixed in 2% paraformaldehyde (PFA) dissolved in PEM buffer (80 mM PIPES pH 6.8, 5 mM EGTA, 2 mM MgCl 2 ) supplemented with 0.1% glutaraldehyde for 20 min at room temperature prior to being processed for immunofluorescence staining. Cells were permeabilised with 0.5% Triton X-100 for 5 min, washed three times with PBS before blocking with 5% BSA in PBS for 1 hr. Cells were incubated with either directly labelled anti-tubulin antibody (1:20) or labelled Affimer (1:2000) prepared in PBS supplemented with 0.25% BSA for 1 hr at room temperature. Coverslips were washed three times prior to imaging. Dilutions of antibody and Affimer were previously optimised to give the best performance in dSTORM. For standard confocal imaging smaller (13 mm diameter) coverslips were used, the dilution of the antibodies and Affimers was 1/500 and 1/100 respectively, and a secondary antibody (labelled with Alexa Fluor 488, Life Technologies) to the rat anti-tubulin antibody was used at 1:400. The fixation and staining procedure was the same, and coverslips were mounted in Pro-long Antifade before imaging on a Zeiss LSM880 confocal, equipped with an Airyscan. For dSTORM imaging, coverslips were mounted into the imaging chambers and placed on the microscope stage. Coverslips were then incubated with 0.01% poly-L-lysine (Sigma-Aldrich, P4707) for 10 min, followed by a suspension of 150 nm gold nanoparticles (Sigma-Aldrich, 742058, 1:10 in PBS), serving as stable reference emitters for calibration images and drift-correction. dSTORM data was acquired in the presence of fluorescence quenching buffer ( Heilemann et al., 2009 , 2008 ) (PBS (pH 8), 5 mg/ml glucose, 114 mM β-mercaptoethanol, 0.5 mg/ml glucose oxidase and 40 μg/ml catalase). (b) Image acquisition and reconstruction The 3D dSTORM system was based on an inverted microscope (Olympus, IX81) as previously described ( Lambacher et al., 2016 ), with a 60x, 1.2 NA, water-immersion objective lens (Olympus, UPLSAPO60XW), and a cylindrical lens with f = 150 mm (Thorlabs, LJ1629RM-A) for generating astigmatism. Lasers at 642 nm and 405 nm (Omicron, LuxX) provided widefield excitation and photoactivation of Alexa Fluor 647, together with a 2x beam expander before the rear illumination port of the microscope. Images were captured by a back-thinned, electron-multiplying CCD camera (EMCCD), cooled to −80°C (Andor Technology, iXON Ultra, model DU-897U-CSO-#BV), using published scripts ( York et al., 2011 ) called from the camera interface (Andor Technology, SOLIS). The acquisition workflow has been described previously ( York et al., 2011 ) (see https://github.com/AndrewGYork/palm3d for further details), including capture of calibration images of a gold nanoparticle in steps of 50 nm in z over a 4 µm range. The fluorescent dye labels in the sample were excited using a 642 nm laser emitting 100 mW, until a sufficient number were quenched ( Heilemann et al., 2009 , 2008 ) for spatially nearby emission events to be separated in time, following which we began data collection (exposure time 50 ms, EMCCD gain 150). When emission events became sparse (after some 10,000 s of frames), labels were stochastically re-activated ( van de Linde et al., 2011 ) using a 405 nm laser, with increasing power from 2 to 20 μW. Data collection finished when the number of emission events per frame became negligible. Emission events lasting for more than one frame were linked into averaged localisations, which were finally binned into a histogram for display, accounting for distortion by the cylindrical lens.
Super-resolution microscopy methods
HER4: (a) Cell labelling for binding curves Chinese Hamster Ovary (CHO) cells (STR profiled and mycoplasma tested) were seeded at a density of 0.75 × 10 5 cells dish on uncoated 35 mm no. 1.5 glass-bottomed dishes (MatTek Corporation, USA). Cells were transfected with HER4-CYT-eGFP the next day and were serum starved overnight the second day after transfection. MCF7 were seeded and grown for two days, before being starved overnight. Cells were rinsed and cooled to 4°C for 10 min, then labelled with HER4 Affimer labelled with CF640R (Biotium) in concentrations ranging from 1 to 100 nM (CHO/HER4-CYT-eGFP) or from 10 to 500 nM (MCF7). Labelling was carried out at 4°C for 1 hr. Cells were rinsed and fixed with 3% paraformaldehyde plus 0.5% glutaraldehyde for 15 min at 4°C then 15 min at room temperature. Imaging was carried out in PBS using the standard confocal mode in a Leica TCS sp8 (see Data analysis of binding curves below). HER4: (b) Data analysis of binding curves Fluorescence images acquired in photon counting mode were analysed using Fiji (ImageJ). Membrane signals were isolated using intensity threshold segmentation followed by dilation of the resulting binary mask. For each Affimer concentration, the pixel values of the segmented membrane areas from five imaged regions were combined to produce a histogram of pixel values. The mean and standard deviation of the pixel value distributions was plotted. HER4: (c) Cell labelling for super-resolution imaging CHO cells (1 × 10 5 ) were seeded in untreated 35 mm high-precision glass bottomed-dishes (MatTek Corporation, USA) and reverse transfected with HER4-CYT-eGFP at a ratio of 4 ul ViaFect (Promega) to 1 ug DNA.Two days later cells were labelled with 100 nM HER4 Affimer5 conjugated to Alexa 647 for 1 hr at 4°C. Cells were rinsed and fixed with 3% paraformaldehyde plus 0.5% glutaraldehyde for 15 min at 4°C then 15 min at room temperature before rinsing. HER4: (d) dSTORM imaging The super-resolution dSTORM images were taken in a Zeiss Elyra PS.1 system. The fluorophore Alexa Fluor 647 was photo-switched using 642 nm and 405 nm excitation lasers simultaneously, with 100 mM dithiothreitol in PBS as the switching buffer. The power density of the 642 nm and 405 nm illumination on the sample plane were about 4.6 kW/cm 2 and 0.4 kW/cm 2 . A 100× NA 1.46 oil immersion objective lens (Zeiss alpha Plan-Apochromat) and a multi-band dichroic filter (BP 420–480+ LP 650) were used in the imaging. The final fluorescent images were projected on an Andor iXon 897 EMCCD camera. Super-resolution dSTORM images were reconstructed in ZEISS ZEN software. A 25 nm localisation precision is obtained according to the histogram of the calculated localization precision from each fluorophore. HER4: (e) Cell labelling for single-molecule tracking experiments MCF7 cells were seeded at the density of 3 × 10 5 cells/dish onto 35 mm glass bottomed-dishes. Each dish contains a high-precision no. 1.5 ± 0.170 thickness glass bottom of 14 mm in diameter (MatTek Corporation, USA). The dishes were cleaned with Piranha solution and coated with 1% BSA, according to the protocol previously described ( Zanetti-Domingues et al., 2012 ). Prior to imaging, cells were starved for 2 hr at 37°C in serum free medium supplemented with 25 mM HEPES. After starvation, cells were rinsed twice with serum free medium pre-heated at 37°C. Labelling with fluorescently labelled Affimer was carried out for 10 min at 37°C. HER4 Affimer 5 (HER4-5) was conjugated in-house with CF640R (Biotium) maleimide dye following manufacturers’ instructions. Cells were rinsed twice with serum free medium pre-heated at 37°C and promptly imaged as described below. HER4: (f) Single-molecule acquisition Single-molecule images were acquired using an Axiovert 200M microscope with a TIRF illuminator (Zeiss, UK) and incorporating a 100 x oil-immersion objective (α-Plan-Fluar, NA = 1.45; Zeiss, UK) and an EMCCD (iXon X3; Andor, UK). Samples were illuminated with a 638 nm laser (100 mW, Vortran) fed into the microscope via a polarisation maintaining triple laser combiner (Oz Optics) . Alternatively, the 640 nm lines of a Vortran Combiner or of an Andor Revolution Laser Combiner were used. A wrap-around incubator (Pecon XL S1) was used to maintain a constant temperature of 37°C. The field of view of each channel was 80 × 30 μm. Data were acquired at 20 Hz for 30 s. Images were saved in HDF5 format for subsequent processing using custom-designed software. All Single-Molecule time series data were analysed using the multidimensional analysis software described previously ( Rolfe et al., 2011 ).
📊 Figures
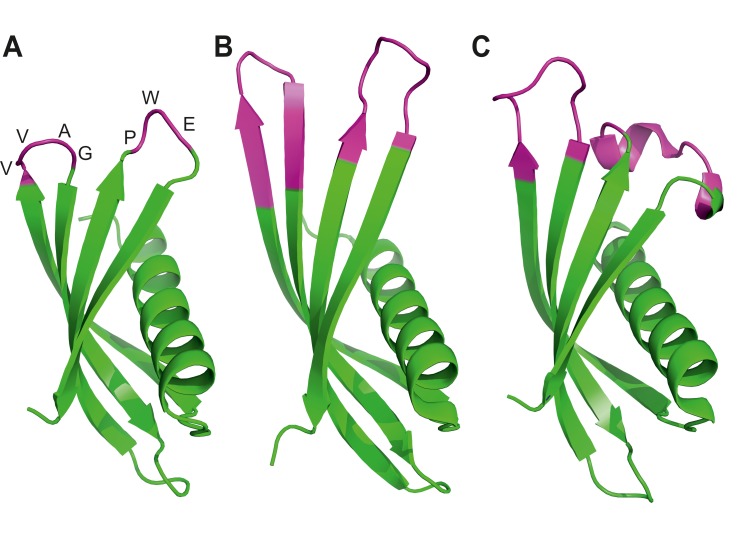
Figure 1.
Ribbon diagrams of three crystal structures for Affimer (Adhiron) reagents.
( A ) X-ray crystal structure of Affimer scaffold (PDB ID no. 4N6T) at 1.75 A resolution. The amino acids from the loops connecting the four anti-parallel beta sheets are highlighted in pink. ( B ) Cr...
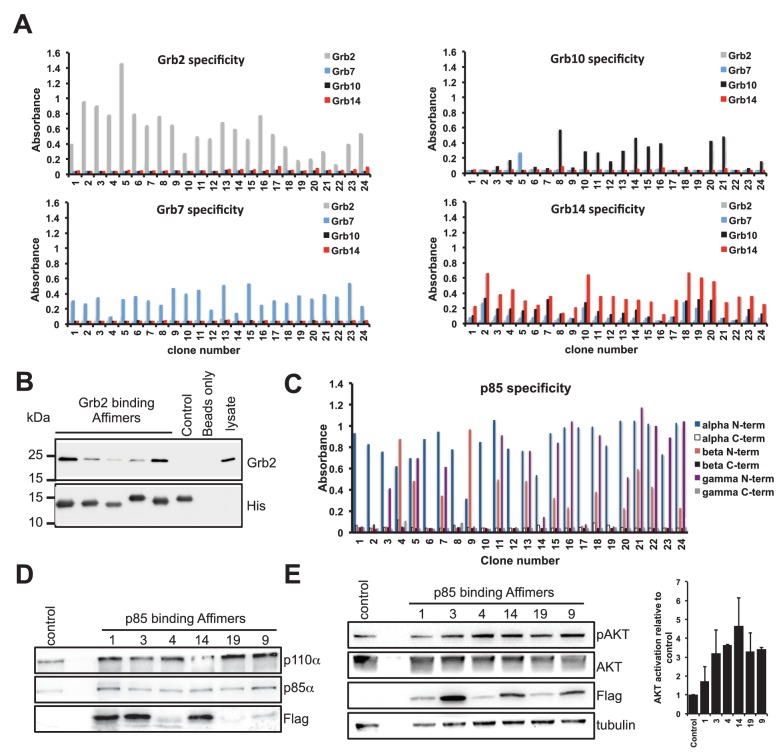
Figure 2.
Isolation and characterisation of SH2 domain binding Affimers.
( A ) Phage ELISA from 24 monoclonal Affimer reagents isolated against the respective Grb family member SH2 domains. Specificity was tested through extent of binding to the other SH2 family members. (...
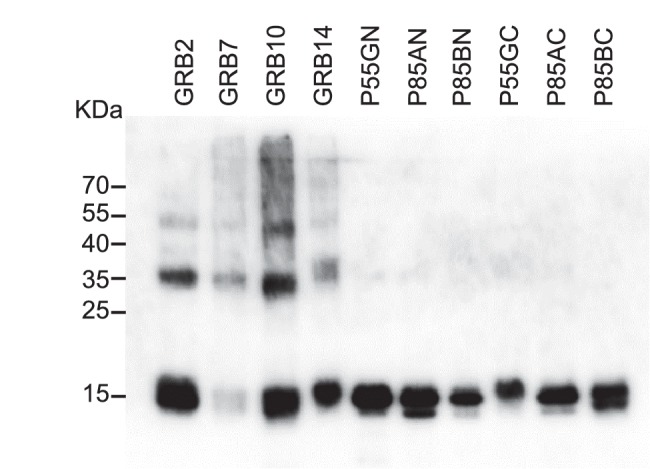
Figure 2u2014figure supplement 1.
Western blot results of Avi-Tag SH2 domain proteins using an streptavidin-HRP conjugate to detect the presence of biotin.
DOI: http://dx.doi.org/10.7554/eLife.24903.005
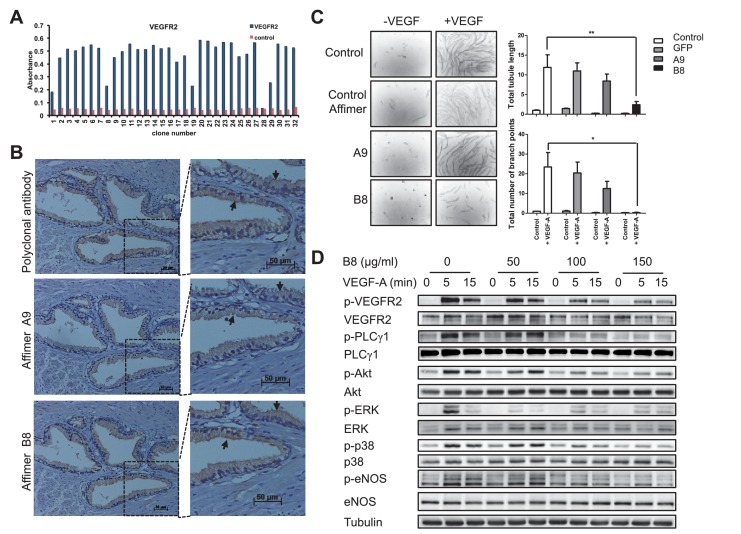
Figure 3.
Characterisation of VEGFR2 binding Affimers.
( A ) Phage ELISA for 32 monoclonal Affimer reagents isolated against VEGFR2. The negative control contained just streptavidin. ( B ) Immuno- and affinity-histochemistry of a polyclonal anti-VEGFR2 an...
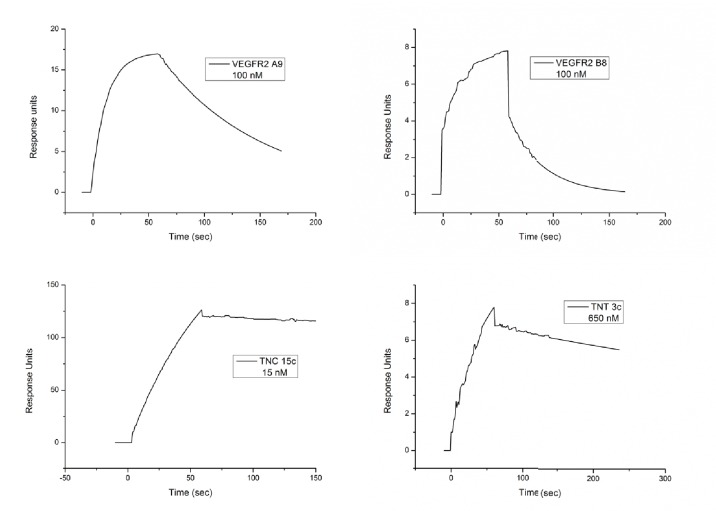
Figure 3u2014figure supplement 1.
SPR plots for the anti-VEGFR2, TNC and TNT binding Affimers.
DOI: http://dx.doi.org/10.7554/eLife.24903.007
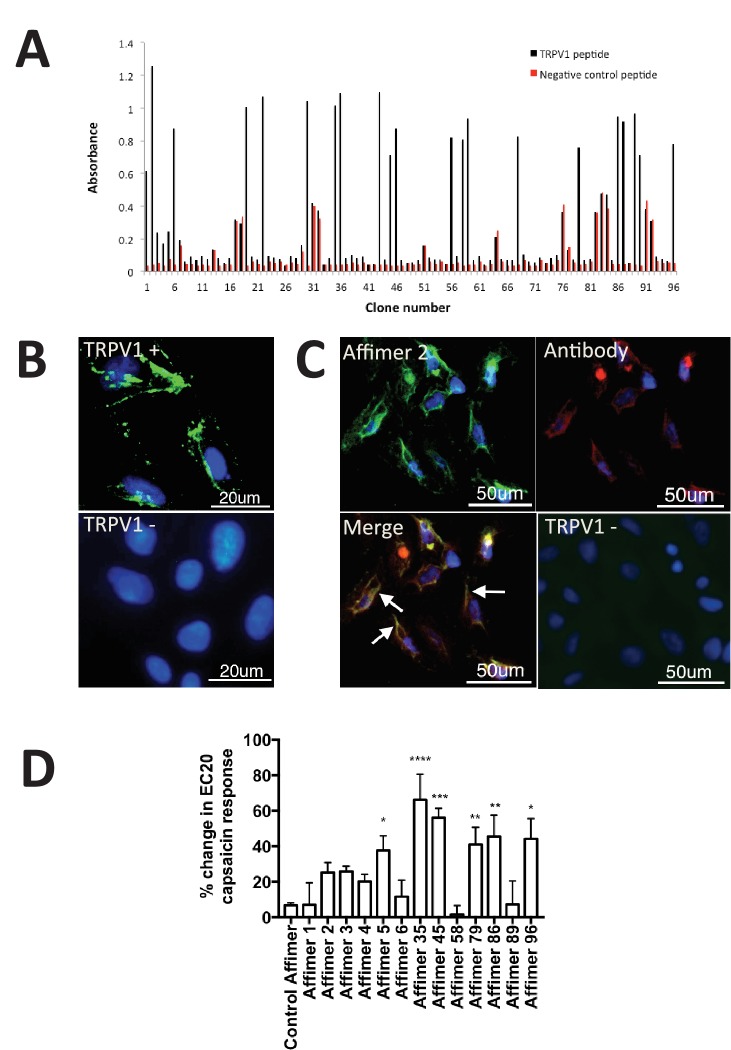
Figure 4.
Characterisation of TRPV1 binding Affimers.
( A ) Phage ELISA for 96 monoclonal Affimer reagents isolated against TRPV1 peptide. The negative control contained a different hydrophobic peptide sequence. ( B ) Affinity-cytochemistry on U2-OS cell...
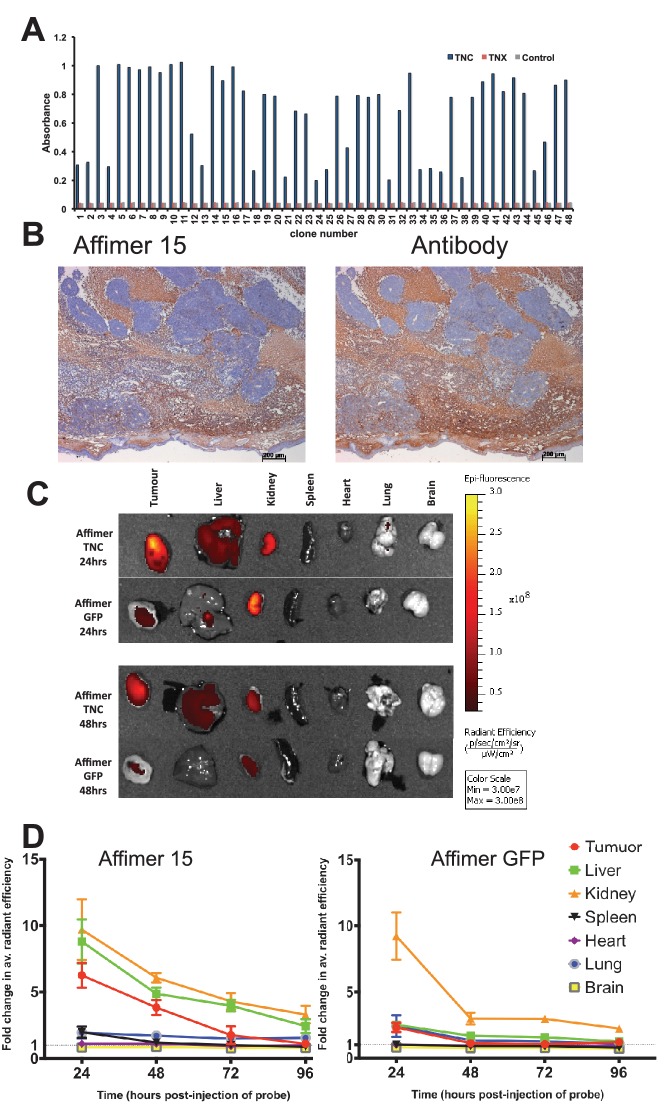
Figure 5.
Characterisation of tenascin C (TNC) binding Affimer by affinity-histochemistry and ex vivo imaging of xenografts.
( A ) Phage ELISA for 48 monoclonal Affimers against TNC. The two controls are tenascin X (TNX) and streptavidin. ( B ) Immunohistochemistry of serial sections of a mouse xenograft (SW620 cell line), ...
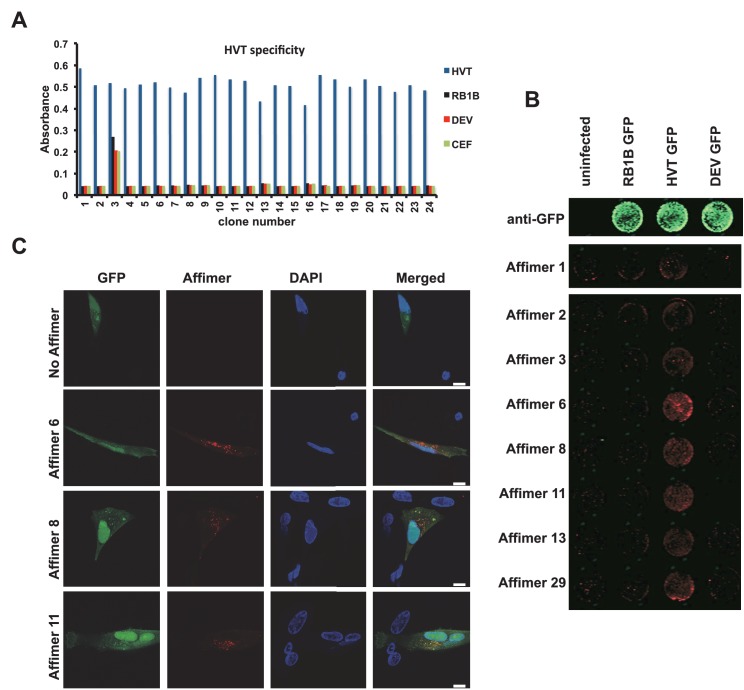
Figure 6.
Affimer detection of HVT UL49 in infected cells by in-cell Western and affinity-fluorescence.
( A ) Phage ELISA for 24 monoclonal Affimers against HVT screened against HVT, RB1B, DEV and CEF lysates to confirm specificity for HVT. ( B ) Infection of cells was confirmed using a goat anti-GFP an...
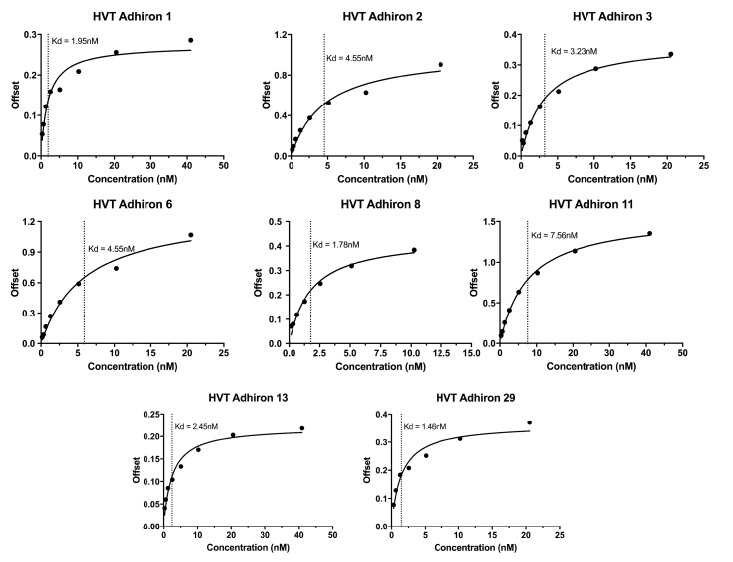
Figure 6u2014figure supplement 1.
Bilayer Interferometry plots for the HVT binding Affimers.
DOI: http://dx.doi.org/10.7554/eLife.24903.011
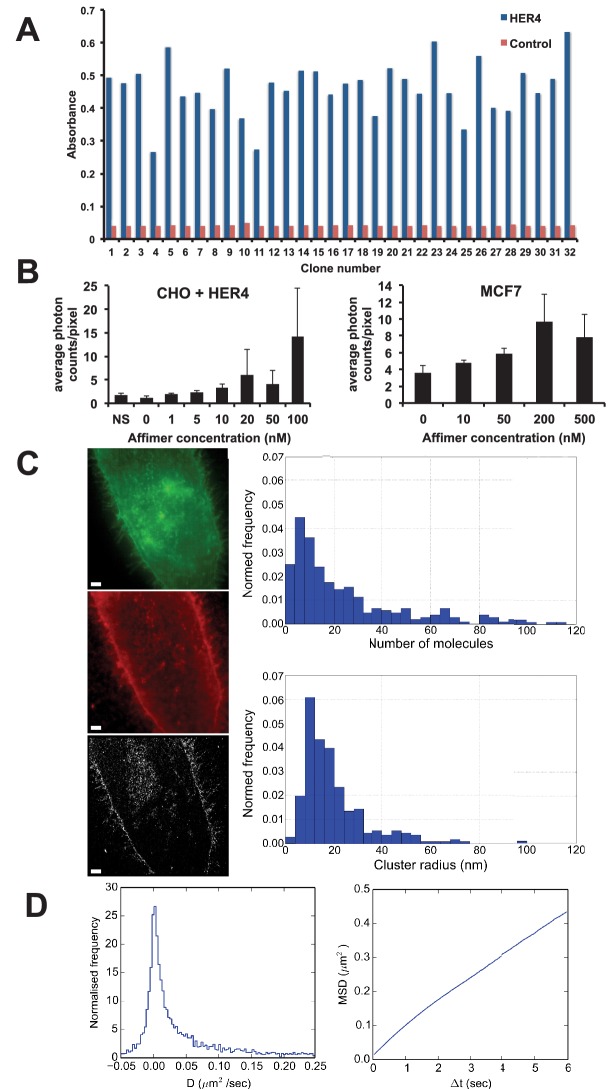
Figure 7.
Use of HER4 binding Affimers in super-resolution imaging and singleu00a0molecule tracking.
( A ) Phage ELISA for HER4 binding Affimers. ( B ) Average photon counts/pixel for HER4-binding Affimer labelled with CF640R and bound to CHO cells transfected with HER4 and to MCF7 cells expressing e...
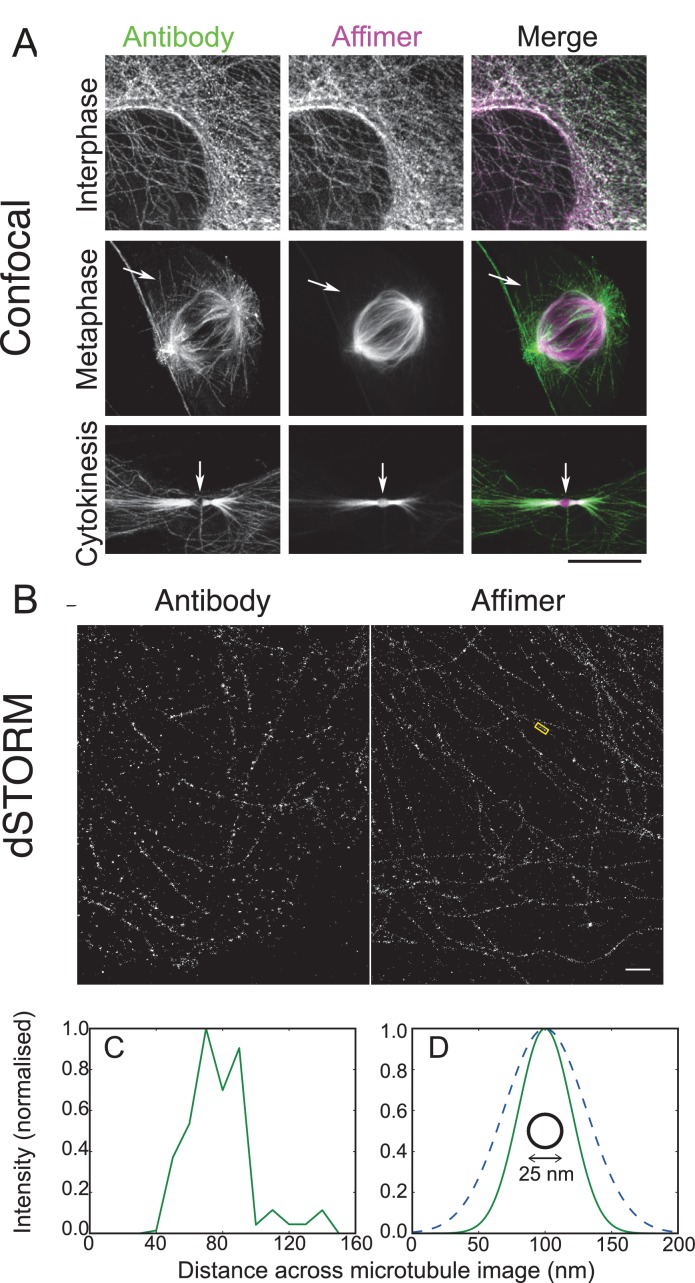
Figure 8.
Use of tubulin binding Affimer in super-resolution microscopy.
( A ) Confocal images of microtubules in HeLa cells, stained with a rat u03b1-tubulin antibody (YL1/2) which recognises tyrosinated tubulin, and an Affimer for polymerised tubulin, conjugated to Alexa...
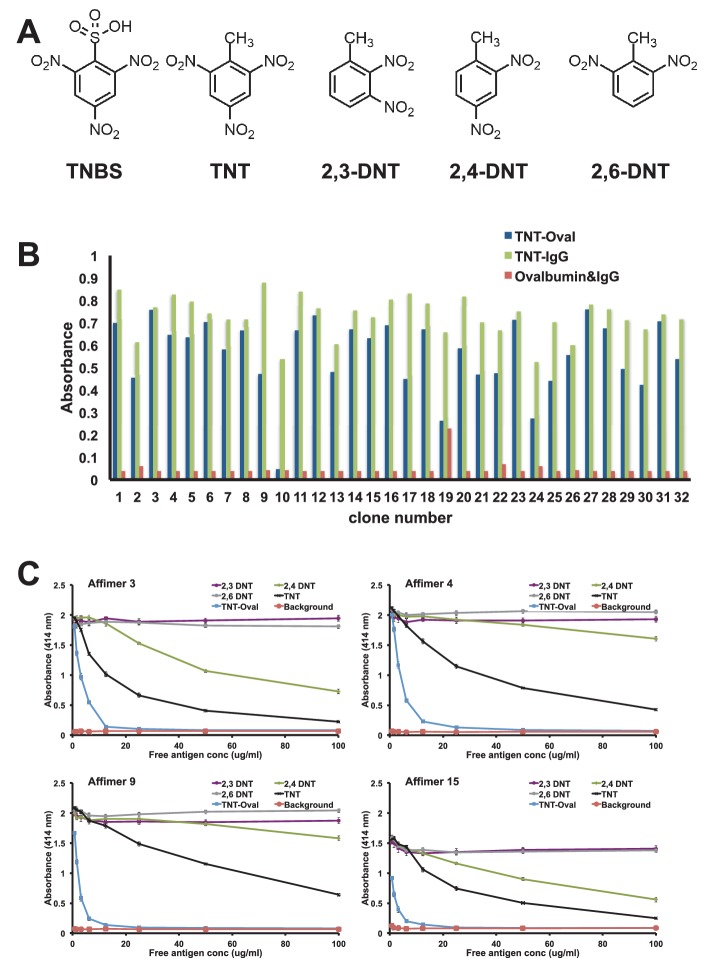
Figure 9.
Affimer selection and specificity against TNT and DNTu2019s.
( A ) Chemical structures of TNBS, TNT, 2,3-DNT, 2,4-DNT and 2,6-DNT. ( B ) Phage ELISA results from 32 monoclonal Affimer reagents isolated against TNBS bound to ovalbumin. Binding specificity was al...
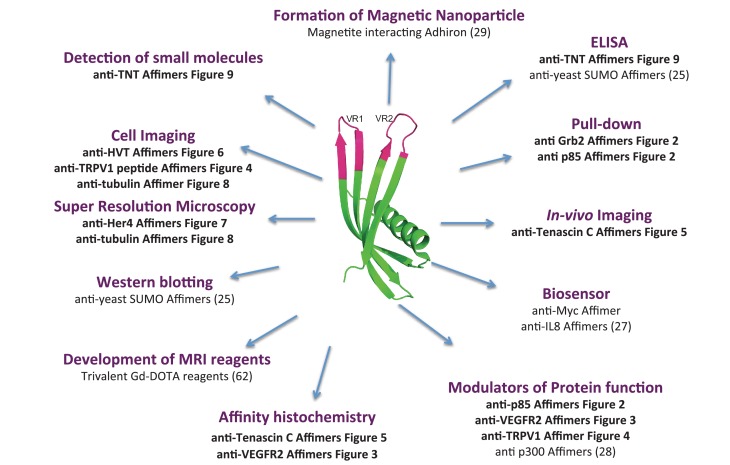
Figure 10.
Overview scheme of a range of applications that have been tested with Affimers.
DOI: http://dx.doi.org/10.7554/eLife.24903.015
Figure images are served from the NIH/NLM PubMed Central Open Access Subset or Europe PMC; copyright remains with the publishers and authors.
💬 Discussion
0 commentsNo comments yet. Be the first to start a discussion!
Leave a Comment