Abstract
Abstract Biocompatible fluorescent reporters with spectral properties spanning the entire visible spectrum are indispensable tools for imaging the biochemistry of living cells and organisms in real time. Here, we report the engineering of a fluorescent chemogenetic reporter with tunable optical and spectral properties. A collection of fluorogenic chromophores with various electronic properties enables to generate bimolecular fluorescent assemblies that cover the visible spectrum from blue to red using a single protein tag engineered and optimized by directed evolution and rational design. The ability to tune the fluorescence color and properties through simple molecular modulation provides a broad experimental versatility for imaging proteins in live cells, including neurons, and in multicellular organisms, and opens avenues for optimizing Förster resonance energy transfer (FRET) biosensors in live cells. The ability to tune the spectral properties and fluorescence performance enables furthermore to match the specifications and requirements of advanced super-resolution imaging techniques.
🔬 Techniques
🔭 Microscopes
🧬 Organisms
💻 Software
✨ Fluorophores
🧪 Sample Preparation
🔬 Cell Lines
🏭 Microscope Brands
🧪 Reagent Suppliers
📷 Detectors
🔎 Objectives
💻 Software Details
💾 Data Repositories
🏛️ Research Organizations (ROR)
Affiliated research institutions:
📋 Methods
Organic synthesis General Commercially available reagents were used as obtained. 1 H and 13 C NMR spectra were recorded at 300 K on a Bruker AM 300 spectrometer; chemical shifts are reported in ppm with protonated solvent as internal reference 1 H, CHCl 3 in CDCl 3 7.26 ppm, CHD 2 SOCD 3 in CD 3 SOCD 3 2.49 ppm, CHD 2 COCD 3 in CD 3 COCD 3 2.05 ppm; 13 C, 13 CDCl 3 in CDCl 3 77.0 ppm, 13 CD 3 SOCD 3 in CD 3 SOCD 3 39.7 ppm, 13 CD 3 COCD 3 in CD 3 COCD 3 29.9 ppm; coupling constants J are given in Hz. Mass spectra (chemical ionization and electronic impact with NH 3 or CH 4 ) were performed by the Service de Spectrométrie de Masse de Chimie ParisTech and mass spectra high resolution were performed by the Service de Spectrométrie de Masse de l’Institut de Chimie Organique et Analytique (Orléans). The preparation of HMBR (4-hydroxy-3-methylbenzylidene rhodanine), HBR-3,5DM (4-hydroxy-3,5-dimethylbenzylidene rhodanine), HBR-3,5DOM (4-hydroxy-3,5-dimethoxybenzylidene rhodanine), HBRAA-3M ((5-(4-hydroxy-3-methylbenzylidene)-4-oxo-2-thioxothiazolidin-3-yl)acetic acid) and HBRAA-3E (5-(4-hydroxy-3-ethylbenzylidene)-4-oxo-2-thioxothiazolidin-3-yl)acetic acid were previously described 13 , 20 , 21 . The starting compound oxazolidinedione was obtained according to previously described methods 42 . Synthetic schemes are presented on Supplementary Fig. 24 . HBP-3M ((4-hydroxy-3-methylbenzylidene)-2-iminothiazolidin-4-one). Solid 4-hydroxy-3-methylbenzaldehyde (130 mg, 1.0 mmol) and pseudothiohydantoin (69 mg, 0.6 mmol) were mixed and the mixture was brought to 170 °C. It first fused and then solidified. After cooling to 50–60 °C, ethanol was added and the mixture was heated at reflux. The solid partially disintegrated and formed a suspension. It was filtered and the remaining powder was dissolved in 1 M sodium hydroxide. The resulting solution was stirred for 5–10 min and was then slowly acidified with 1 M hydrochloric acid. After cooling to 0 °C, the precipitate was filtered, washed with cold water and dried over P 2 O 5 . HBP-3M was obtained as an orange powder (42%, 58 mg). 1 H NMR (300 MHz, DMSO-d6, δ): 10.03 (s, 1H), 9.28 (s,1H), 9.00 (s,1H), 7.74 (s, 1H), 7.30 (d, 1H, J = 2.0 Hz), 7.24 (dd, 1H, J = 8.3 Hz, 2.0 Hz), 6.92 (d, 1H, J = 8.3 Hz), 2.16 (s, 3H); 13 C (75 MHz, DMSO-d6, δ): 180.7, 175.4, 157.2, 132.2, 129.6, 128.9, 125.0, 124.8, 124.7, 115.3, 16.0; HRMS (ESI): m/z 235.0537 (calcd mass for C 11 H 11 N 2 O 2 S [M + H] – = 235.053). HBP-3,5DM ((4-hydroxy-3,5-dimethylbenzylidene)-2-iminothiazolidin-4-one). As HBP-3M using 4-hydroxy-3,5-dimethylbenzaldehyde (207 mg, 1.4 mmol) and pseudothiohydantoin (100 mg, 0.86 mmol). HBP-3,5DM was obtained as a dark orange powder (83%, 177 mg). 1 H NMR (300 MHz, DMSO-d6, δ): 9.27(s,1H), 8.97(s,1H), 8.93 (s, 1H),7.42 (s, 1H), 7.16(s, 2H), 2.20 (s, 6H); 13 C NMR (75 MHz, DMSO-d6, δ): 180.6, 175.4, 155.1, 130.1 (2 C), 129.7, 125.2, 124.9 (2 C), 16.7; HRMS (ESI): m/z 249.0694 (calcd mass for C 12 H 13 N 2 O 2 S [M + H] – = 249.0692). HBP-3,5DOM ((4-hydroxy-3,5-dimethoxybenzylidene)-2-iminothiazolidin-4-one). As HBP-3M using 4-hydroxy-3,5-dimethoxybenzaldehyde (251 mg, 1.4 mmol) and pseudothiohydantoin (100 mg, 0.86 mmol). HBP-3,5DOM was obtained as an orange powder (61%, 146 mg). 1 H NMR (300 MHz, DMSO-d6, δ): 9.31 (s,1H), 9.10 (s,1H), 9.03 (s,1H), 7.53 (s,1H), 6.88 (s,2H), 3.82 (s,6H); HRMS (ESI): m/z 281.0590 (calcd mass for C 12 H 13 N 2 O 4 S [M + H] - = 281.0591 (in accordance with previously described analysis 43 )). HBT-3M ((4-hydroxy-3-methylbenzylidene)thiazolidine-2,4-dione). Solid 4-hydroxy-3-methylbenzaldehyde (187 mg, 1.4 mmol) and 2,4-thiazolidinedione (100 mg, 0.85 mmol) were mixed and the mixture was brought to 170 °C. It first fused and then solidified. After cooling to 50–60 °C, ethanol was added to the solid and the suspension was stirred at reflux until complete dissolution. Then an excess of water was slowly added. The resulting precipitate was filtered, washed with water, and dried over P 2 O 5. HBT-3M was obtained as a green powder (55%, 110 mg). 1 H NMR (300 MHz, DMSO-d6, δ): 12.43 (s, 1H), 10.23 (s, 1H), 7.65 (s, 1H), 7.33(d, 1H, J = 2.0 Hz), 7.29 (dd, J = 8.3, 2.0 Hz, 1H), 6.92 (d, J = 8.3 Hz, 1H), 2.16 (s, 3H); 13 C NMR (75 MHz, DMSO-d6, δ): 168.2, 167.6, 158.2, 133.2, 132.5, 129.8, 125.2, 123.8, 118.7, 115.4, 15.9; HRMS (ESI): m/z 236.0376 (calcd mass for C 11 H 10 NO 3 S [M + H] − : 236.0376). HBT-3,5DM ((4-hydroxy-3,5-dimethylbenzylidene)thiazolidine-2,4-dione). As HBT-3M using 4-hydroxy-3,5-dimethylbenzaldehyde (205 mg, 1.4 mmol) and 2,4-thiazolidinedione (100 mg, 0.85 mmol). HBT-3,5DM was obtained as a yellow powder (75%, 154 mg). 1 H NMR (300 MHz, DMSO-d6, δ): 12.43 (s, 1H), 9.14 (s, 1H), 7.61 (s, 1H), 7.18 (s, 2H), 2.20 (s, 6H); HRMS (ESI): m/z 250.0533 (calcd mass for C 12 H 12 NO 3 S [M + H] – : 250.0532) (in accordance with previously described analysis 44 , 45 ). HBT-3,5DOM ((4-hydroxy-3,5-dimethoxybenzylidene)thiazolidine-2,4-one). As HBT-3M using 4-hydroxy-3,5-dimethoxybenzaldehyde (258 mg, 1.4 mmol) and 2,4-thiazolidinedione (100 mg, 0.85 mmol). HBT-3,5DOM was obtained as a green powder (61%, 146 mg). 1 H NMR (300 MHz, DMSO-d6, δ): 12.48 (s, 1H), 9.33 (s, 1H), 7.71 (s, 1H), 6.89 (s, 2H), 3.81 (s, 6H); 13 C (75 MHz, DMSO-d6, δ): 168.5, 167.9, 148.7, 139.1, 133.3, 123.7, 120.1, 108.4, 56.5; HRMS (ESI): m/z 282.0431 (calcd mass for C 12 H 12 NO 5 S [M + H] – : 282.0431) (in accordance with previously described analysis 44 , 46 ). HBO-3M ((4-hydroxy-3-methylbenzylidene)oxazolidine-2,4-dione). A mixture of 4-hydroxy-3-methylbenzaldehyde (100 mg, 0.74 mmol), 2,4-oxazolidinedione (148 mg, 1.5 mmol), and pyrrolidine (60 μL, 0.74 mmol) in ethanol (2 mL) was stirred at reflux for 18 h. After cooling, the mixture was diluted with water. The precipitate was collected by filtration, washed with cold water, and dried over P 2 O 5 . HBO-3M was obtained as an orange powder (48%, 78 mg). 1 H NMR (300 MHz, DMSO-d6, δ): 12.16 (s, 1H), 10.04 (s, 1H), 7.51 (d, 1H, J = 3 Hz), 7.47 (dd, 1H, J = 3, 9 Hz), 6.86 (d, 1H, J = 9 Hz), 6.58 (s, 1H), 2.14 (s, 3H); 13 C NMR (75 MHz, DMSO-d6, δ): 165.9, 157.2, 154.3, 137.8, 133.1, 129.9, 124.6, 122.4, 115.1, 109.7, 15.9; HRMS (ESI): m/z 220.060512 (calcd mass for C 11 H 10 NO 4 [M + H] – = 220.060434). HBO-3,5DM ((4-hydroxy-3,5-dimethylbenzylidene)oxazolidine-2,4-dione). As HBO-3M using 4-hydroxy-3,5-dimethylbenzaldehyde (100 mg, 0.66 mmol), 2,4-oxazolidinedione (134 mg, 1.3 mmol), pyrrolidine (55 μL, 0.66 mmol) in ethanol (2 mL). HBO-3,5DM was obtained as an orange powder (43 mg, 28%). 1 H NMR (300 MHz, DMSO-d6, δ): 12.10 (s, 1H), 8.95 (s,1H), 7.37 (s, 2H), 6.53 (s, 1H), 2.19 (s, 6H); HRMS (ESI): m/z 234.076560 (calcd mass for C 12 H 12 NO 4 [M + H] – = 234.076084). (in accordance with previously described analysis 47 ) HBIR-3M ((4-hydroxy-3-methylbenzylidene)-4-thioxothiazolidin-2-one). As HBP-3M using 4-hydroxy-3-methylbenzaldehyde (164 mg, 1.2 mmol) and isorhodanine (100 mg, 0.75 mmol). HBIR-3M was obtained as an orange powder (49%, 93 mg). 1 H NMR (300 MHz, DMSO-d6, δ): 10.53 (s, 1H), 8.01 (s, 1H), 7.43 (d, 1H, J = 2.0 Hz), 7.38 (dd, 1H, J = 8.3 Hz, 2.0 Hz), 6.96 (d, 1H, J = 8.3 Hz), 2.16 (s, 3H); 13 C NMR (75 MHz, DMSO-d6, δ): 194.9, 170.8, 159.2, 137.3, 134.1, 130.8, 125.7, 125.6, 124.4, 115.7, 15.9; HRMS (ESI): m/z 252.014671 (calcd mass for C 11 H 10 NO 2 S 2 [M + H] – = 252.014747). HBIR-3,5DM ((4-hydroxy-3,5-dimethylbenzylidene)-4-thioxothiazolidin-2-one). As HBP-3M using 4-hydroxy-3,5-dimethylbenzaldehyde (180 mg, 1.2 mmol) and isorhodanine (100 mg, 0.75 mmol). HBIR-3,5DM was obtained as a brown powder (69%, 137 mg). 1 H NMR (300 MHz, DMSO-d6, δ): 13.66 (s, 1H), 9.39 (s, 1H), 7.97 (s, 1H), 7.28 (s, 2H), 2.21 (s, 6H); 13 C NMR (75 MHz, DMSO-d6, δ): 194.9, 170.8, 157.1, 137.2, 131.8, 125.7, 125.5, 124.5, 16.6; HRMS (ESI): m/z 266.030241 (calcd mass for C 12 H 12 NO 2 S 2 [M + H] – = 266.030397). HBIR-3,5DOM ((4-hydroxy-3,5-dimethoxylbenzylidene)-4-thioxothiazolidin-2-one). As HBP-3M using 4-hydroxy-3,5-dimethoxybenzaldehyde (220 mg, 1.2 mmol) and isorhodanine (100 mg, 0.75 mmol). HBIR-3,5DOM was obtained as a brown powder (48%, 110 mg). 1 H NMR (300 MHz, DMSO-d6, δ): 13.72 (s, 1H), 9.60 (s, 1H), 8.05 (s, 1H), 6.97 (s, 2H), 3.83 (s, 6H); 13 C NMR (75 MHz, DMSO-d6, δ): 194.9, 170.8, 148.3, 139.3, 137.5, 126.5, 123.8, 108.7, 56.1; HRMS (ESI): m/z 298.020265 (calcd mass for C 12 H 12 NO 4 S 2 [M + H] – = 298.020226) (in accordance with previously described analysis) 48 . HBRAA-3,5DM 5-((4-hydroxy-3,5-dimethylbenzylidene)-4-oxo-2-thioxothiazolidin-3-yl) acetic acid. A solution of rhodanine-3-acetic acid (191 mg, 1.0 mmol) and 4-hydroxy-3,5-dimethylbenzaldehyde (150 mg, 1.0 mmol) in water (70 mL) was stirred at 90 °C for 7 days. After cooling to 4 °C and standing overnight, the precipitate was filtered through a glass filter and the crude solid was washed with water, ethanol and dried over P 2 O 5 , to give the desired product as an orange powder (160 mg, 50%). 1 H NMR (300 MHz, CD 3 SOCD 3 , δ): 9.40 (s, 1H), 7.70 (s, 1H), 7.27 (s, 2H), 4.72 (s, 2H), 2.23 (s, 6H); 13 C NMR (75 MHz, CD 3 SOCD 3 , δ): 193.6, 167.8, 166.9, 157.7, 135.3, 132.4(2C), 126.0(2C), 124.3, 117.4, 45.4, 17.1(2C); MS (ESI): m/z 322.2 (calcd mass for C 14 H 12 NO 4 S 2 [M-H] − = 322.0). Biology The presented research complies with all relevant ethical regulations. General Synthetic oligonucleotides used for cloning were purchased from Integrated DNA technology. PCR reactions were performed with Q5 polymerase (New England Biolabs) in the buffer provided. PCR products were purified using QIAquick PCR purification kit (Qiagen). The products of restriction enzyme digests were extracted and purified by preparative gel electrophoresis followed by QIAquick gel extraction kit (Qiagen). Restriction endonucleases, DNAse I, T4 ligase, Fusion polymerase, Tag ligase and Tag exonuclease were purchased from New England Biolabs and used with accompanying buffers and according to manufacturer protocols. Isothermal assemblies (Gibson assembly) were performed using homemade mix prepared according to previously described protocols 49 . Small-scale isolation of plasmid DNA was done using QIAprep miniprep kit (Qiagen) from 2 mL overnight bacterial culture supplemented with appropriate antibiotics. Large-scale isolation of plasmid DNA was done using the QIAprep maxiprep kit (Qiagen) from 150 mL of overnight bacterial culture supplemented with appropriate antibiotics. All plasmid sequences were confirmed by Sanger sequencing with appropriate sequencing primers (GATC Biotech). All the plasmids used in this study are listed in Supplementary Tables 10 and 11 . The protein and DNA sequences of FAST and pFAST are given in Supplementary Table 12 .
Show full methods section
Organic synthesis General Commercially available reagents were used as obtained. 1 H and 13 C NMR spectra were recorded at 300 K on a Bruker AM 300 spectrometer; chemical shifts are reported in ppm with protonated solvent as internal reference 1 H, CHCl 3 in CDCl 3 7.26 ppm, CHD 2 SOCD 3 in CD 3 SOCD 3 2.49 ppm, CHD 2 COCD 3 in CD 3 COCD 3 2.05 ppm; 13 C, 13 CDCl 3 in CDCl 3 77.0 ppm, 13 CD 3 SOCD 3 in CD 3 SOCD 3 39.7 ppm, 13 CD 3 COCD 3 in CD 3 COCD 3 29.9 ppm; coupling constants J are given in Hz. Mass spectra (chemical ionization and electronic impact with NH 3 or CH 4 ) were performed by the Service de Spectrométrie de Masse de Chimie ParisTech and mass spectra high resolution were performed by the Service de Spectrométrie de Masse de l’Institut de Chimie Organique et Analytique (Orléans). The preparation of HMBR (4-hydroxy-3-methylbenzylidene rhodanine), HBR-3,5DM (4-hydroxy-3,5-dimethylbenzylidene rhodanine), HBR-3,5DOM (4-hydroxy-3,5-dimethoxybenzylidene rhodanine), HBRAA-3M ((5-(4-hydroxy-3-methylbenzylidene)-4-oxo-2-thioxothiazolidin-3-yl)acetic acid) and HBRAA-3E (5-(4-hydroxy-3-ethylbenzylidene)-4-oxo-2-thioxothiazolidin-3-yl)acetic acid were previously described 13 , 20 , 21 . The starting compound oxazolidinedione was obtained according to previously described methods 42 . Synthetic schemes are presented on Supplementary Fig. 24 . HBP-3M ((4-hydroxy-3-methylbenzylidene)-2-iminothiazolidin-4-one). Solid 4-hydroxy-3-methylbenzaldehyde (130 mg, 1.0 mmol) and pseudothiohydantoin (69 mg, 0.6 mmol) were mixed and the mixture was brought to 170 °C. It first fused and then solidified. After cooling to 50–60 °C, ethanol was added and the mixture was heated at reflux. The solid partially disintegrated and formed a suspension. It was filtered and the remaining powder was dissolved in 1 M sodium hydroxide. The resulting solution was stirred for 5–10 min and was then slowly acidified with 1 M hydrochloric acid. After cooling to 0 °C, the precipitate was filtered, washed with cold water and dried over P 2 O 5 . HBP-3M was obtained as an orange powder (42%, 58 mg). 1 H NMR (300 MHz, DMSO-d6, δ): 10.03 (s, 1H), 9.28 (s,1H), 9.00 (s,1H), 7.74 (s, 1H), 7.30 (d, 1H, J = 2.0 Hz), 7.24 (dd, 1H, J = 8.3 Hz, 2.0 Hz), 6.92 (d, 1H, J = 8.3 Hz), 2.16 (s, 3H); 13 C (75 MHz, DMSO-d6, δ): 180.7, 175.4, 157.2, 132.2, 129.6, 128.9, 125.0, 124.8, 124.7, 115.3, 16.0; HRMS (ESI): m/z 235.0537 (calcd mass for C 11 H 11 N 2 O 2 S [M + H] – = 235.053). HBP-3,5DM ((4-hydroxy-3,5-dimethylbenzylidene)-2-iminothiazolidin-4-one). As HBP-3M using 4-hydroxy-3,5-dimethylbenzaldehyde (207 mg, 1.4 mmol) and pseudothiohydantoin (100 mg, 0.86 mmol). HBP-3,5DM was obtained as a dark orange powder (83%, 177 mg). 1 H NMR (300 MHz, DMSO-d6, δ): 9.27(s,1H), 8.97(s,1H), 8.93 (s, 1H),7.42 (s, 1H), 7.16(s, 2H), 2.20 (s, 6H); 13 C NMR (75 MHz, DMSO-d6, δ): 180.6, 175.4, 155.1, 130.1 (2 C), 129.7, 125.2, 124.9 (2 C), 16.7; HRMS (ESI): m/z 249.0694 (calcd mass for C 12 H 13 N 2 O 2 S [M + H] – = 249.0692). HBP-3,5DOM ((4-hydroxy-3,5-dimethoxybenzylidene)-2-iminothiazolidin-4-one). As HBP-3M using 4-hydroxy-3,5-dimethoxybenzaldehyde (251 mg, 1.4 mmol) and pseudothiohydantoin (100 mg, 0.86 mmol). HBP-3,5DOM was obtained as an orange powder (61%, 146 mg). 1 H NMR (300 MHz, DMSO-d6, δ): 9.31 (s,1H), 9.10 (s,1H), 9.03 (s,1H), 7.53 (s,1H), 6.88 (s,2H), 3.82 (s,6H); HRMS (ESI): m/z 281.0590 (calcd mass for C 12 H 13 N 2 O 4 S [M + H] - = 281.0591 (in accordance with previously described analysis 43 )). HBT-3M ((4-hydroxy-3-methylbenzylidene)thiazolidine-2,4-dione). Solid 4-hydroxy-3-methylbenzaldehyde (187 mg, 1.4 mmol) and 2,4-thiazolidinedione (100 mg, 0.85 mmol) were mixed and the mixture was brought to 170 °C. It first fused and then solidified. After cooling to 50–60 °C, ethanol was added to the solid and the suspension was stirred at reflux until complete dissolution. Then an excess of water was slowly added. The resulting precipitate was filtered, washed with water, and dried over P 2 O 5. HBT-3M was obtained as a green powder (55%, 110 mg). 1 H NMR (300 MHz, DMSO-d6, δ): 12.43 (s, 1H), 10.23 (s, 1H), 7.65 (s, 1H), 7.33(d, 1H, J = 2.0 Hz), 7.29 (dd, J = 8.3, 2.0 Hz, 1H), 6.92 (d, J = 8.3 Hz, 1H), 2.16 (s, 3H); 13 C NMR (75 MHz, DMSO-d6, δ): 168.2, 167.6, 158.2, 133.2, 132.5, 129.8, 125.2, 123.8, 118.7, 115.4, 15.9; HRMS (ESI): m/z 236.0376 (calcd mass for C 11 H 10 NO 3 S [M + H] − : 236.0376). HBT-3,5DM ((4-hydroxy-3,5-dimethylbenzylidene)thiazolidine-2,4-dione). As HBT-3M using 4-hydroxy-3,5-dimethylbenzaldehyde (205 mg, 1.4 mmol) and 2,4-thiazolidinedione (100 mg, 0.85 mmol). HBT-3,5DM was obtained as a yellow powder (75%, 154 mg). 1 H NMR (300 MHz, DMSO-d6, δ): 12.43 (s, 1H), 9.14 (s, 1H), 7.61 (s, 1H), 7.18 (s, 2H), 2.20 (s, 6H); HRMS (ESI): m/z 250.0533 (calcd mass for C 12 H 12 NO 3 S [M + H] – : 250.0532) (in accordance with previously described analysis 44 , 45 ). HBT-3,5DOM ((4-hydroxy-3,5-dimethoxybenzylidene)thiazolidine-2,4-one). As HBT-3M using 4-hydroxy-3,5-dimethoxybenzaldehyde (258 mg, 1.4 mmol) and 2,4-thiazolidinedione (100 mg, 0.85 mmol). HBT-3,5DOM was obtained as a green powder (61%, 146 mg). 1 H NMR (300 MHz, DMSO-d6, δ): 12.48 (s, 1H), 9.33 (s, 1H), 7.71 (s, 1H), 6.89 (s, 2H), 3.81 (s, 6H); 13 C (75 MHz, DMSO-d6, δ): 168.5, 167.9, 148.7, 139.1, 133.3, 123.7, 120.1, 108.4, 56.5; HRMS (ESI): m/z 282.0431 (calcd mass for C 12 H 12 NO 5 S [M + H] – : 282.0431) (in accordance with previously described analysis 44 , 46 ). HBO-3M ((4-hydroxy-3-methylbenzylidene)oxazolidine-2,4-dione). A mixture of 4-hydroxy-3-methylbenzaldehyde (100 mg, 0.74 mmol), 2,4-oxazolidinedione (148 mg, 1.5 mmol), and pyrrolidine (60 μL, 0.74 mmol) in ethanol (2 mL) was stirred at reflux for 18 h. After cooling, the mixture was diluted with water. The precipitate was collected by filtration, washed with cold water, and dried over P 2 O 5 . HBO-3M was obtained as an orange powder (48%, 78 mg). 1 H NMR (300 MHz, DMSO-d6, δ): 12.16 (s, 1H), 10.04 (s, 1H), 7.51 (d, 1H, J = 3 Hz), 7.47 (dd, 1H, J = 3, 9 Hz), 6.86 (d, 1H, J = 9 Hz), 6.58 (s, 1H), 2.14 (s, 3H); 13 C NMR (75 MHz, DMSO-d6, δ): 165.9, 157.2, 154.3, 137.8, 133.1, 129.9, 124.6, 122.4, 115.1, 109.7, 15.9; HRMS (ESI): m/z 220.060512 (calcd mass for C 11 H 10 NO 4 [M + H] – = 220.060434). HBO-3,5DM ((4-hydroxy-3,5-dimethylbenzylidene)oxazolidine-2,4-dione). As HBO-3M using 4-hydroxy-3,5-dimethylbenzaldehyde (100 mg, 0.66 mmol), 2,4-oxazolidinedione (134 mg, 1.3 mmol), pyrrolidine (55 μL, 0.66 mmol) in ethanol (2 mL). HBO-3,5DM was obtained as an orange powder (43 mg, 28%). 1 H NMR (300 MHz, DMSO-d6, δ): 12.10 (s, 1H), 8.95 (s,1H), 7.37 (s, 2H), 6.53 (s, 1H), 2.19 (s, 6H); HRMS (ESI): m/z 234.076560 (calcd mass for C 12 H 12 NO 4 [M + H] – = 234.076084). (in accordance with previously described analysis 47 ) HBIR-3M ((4-hydroxy-3-methylbenzylidene)-4-thioxothiazolidin-2-one). As HBP-3M using 4-hydroxy-3-methylbenzaldehyde (164 mg, 1.2 mmol) and isorhodanine (100 mg, 0.75 mmol). HBIR-3M was obtained as an orange powder (49%, 93 mg). 1 H NMR (300 MHz, DMSO-d6, δ): 10.53 (s, 1H), 8.01 (s, 1H), 7.43 (d, 1H, J = 2.0 Hz), 7.38 (dd, 1H, J = 8.3 Hz, 2.0 Hz), 6.96 (d, 1H, J = 8.3 Hz), 2.16 (s, 3H); 13 C NMR (75 MHz, DMSO-d6, δ): 194.9, 170.8, 159.2, 137.3, 134.1, 130.8, 125.7, 125.6, 124.4, 115.7, 15.9; HRMS (ESI): m/z 252.014671 (calcd mass for C 11 H 10 NO 2 S 2 [M + H] – = 252.014747). HBIR-3,5DM ((4-hydroxy-3,5-dimethylbenzylidene)-4-thioxothiazolidin-2-one). As HBP-3M using 4-hydroxy-3,5-dimethylbenzaldehyde (180 mg, 1.2 mmol) and isorhodanine (100 mg, 0.75 mmol). HBIR-3,5DM was obtained as a brown powder (69%, 137 mg). 1 H NMR (300 MHz, DMSO-d6, δ): 13.66 (s, 1H), 9.39 (s, 1H), 7.97 (s, 1H), 7.28 (s, 2H), 2.21 (s, 6H); 13 C NMR (75 MHz, DMSO-d6, δ): 194.9, 170.8, 157.1, 137.2, 131.8, 125.7, 125.5, 124.5, 16.6; HRMS (ESI): m/z 266.030241 (calcd mass for C 12 H 12 NO 2 S 2 [M + H] – = 266.030397). HBIR-3,5DOM ((4-hydroxy-3,5-dimethoxylbenzylidene)-4-thioxothiazolidin-2-one). As HBP-3M using 4-hydroxy-3,5-dimethoxybenzaldehyde (220 mg, 1.2 mmol) and isorhodanine (100 mg, 0.75 mmol). HBIR-3,5DOM was obtained as a brown powder (48%, 110 mg). 1 H NMR (300 MHz, DMSO-d6, δ): 13.72 (s, 1H), 9.60 (s, 1H), 8.05 (s, 1H), 6.97 (s, 2H), 3.83 (s, 6H); 13 C NMR (75 MHz, DMSO-d6, δ): 194.9, 170.8, 148.3, 139.3, 137.5, 126.5, 123.8, 108.7, 56.1; HRMS (ESI): m/z 298.020265 (calcd mass for C 12 H 12 NO 4 S 2 [M + H] – = 298.020226) (in accordance with previously described analysis) 48 . HBRAA-3,5DM 5-((4-hydroxy-3,5-dimethylbenzylidene)-4-oxo-2-thioxothiazolidin-3-yl) acetic acid. A solution of rhodanine-3-acetic acid (191 mg, 1.0 mmol) and 4-hydroxy-3,5-dimethylbenzaldehyde (150 mg, 1.0 mmol) in water (70 mL) was stirred at 90 °C for 7 days. After cooling to 4 °C and standing overnight, the precipitate was filtered through a glass filter and the crude solid was washed with water, ethanol and dried over P 2 O 5 , to give the desired product as an orange powder (160 mg, 50%). 1 H NMR (300 MHz, CD 3 SOCD 3 , δ): 9.40 (s, 1H), 7.70 (s, 1H), 7.27 (s, 2H), 4.72 (s, 2H), 2.23 (s, 6H); 13 C NMR (75 MHz, CD 3 SOCD 3 , δ): 193.6, 167.8, 166.9, 157.7, 135.3, 132.4(2C), 126.0(2C), 124.3, 117.4, 45.4, 17.1(2C); MS (ESI): m/z 322.2 (calcd mass for C 14 H 12 NO 4 S 2 [M-H] − = 322.0). Biology The presented research complies with all relevant ethical regulations. General Synthetic oligonucleotides used for cloning were purchased from Integrated DNA technology. PCR reactions were performed with Q5 polymerase (New England Biolabs) in the buffer provided. PCR products were purified using QIAquick PCR purification kit (Qiagen). The products of restriction enzyme digests were extracted and purified by preparative gel electrophoresis followed by QIAquick gel extraction kit (Qiagen). Restriction endonucleases, DNAse I, T4 ligase, Fusion polymerase, Tag ligase and Tag exonuclease were purchased from New England Biolabs and used with accompanying buffers and according to manufacturer protocols. Isothermal assemblies (Gibson assembly) were performed using homemade mix prepared according to previously described protocols 49 . Small-scale isolation of plasmid DNA was done using QIAprep miniprep kit (Qiagen) from 2 mL overnight bacterial culture supplemented with appropriate antibiotics. Large-scale isolation of plasmid DNA was done using the QIAprep maxiprep kit (Qiagen) from 150 mL of overnight bacterial culture supplemented with appropriate antibiotics. All plasmid sequences were confirmed by Sanger sequencing with appropriate sequencing primers (GATC Biotech). All the plasmids used in this study are listed in Supplementary Tables 10 and 11 . The protein and DNA sequences of FAST and pFAST are given in Supplementary Table 12 .
Yeast display Library construction
The first yeast library (called library A in this study) of FAST constructed by error-prone PCR using Genemorph II kit (Agilent) was previously described 23 . The second library (called library B in this study) was constructed by DNA shuffling according to different DNA shuffling library protocols 50 – 52 . Five gene variants (with more than 70% of sequences homology) previously screened, selected, and rationally designed from the library A were first amplified by PCR. They were randomly digested by DNAse I (20 U/mL). The digested products were purified and mixed together. Two steps of PCR amplification (one without primers and the second one with two primers to amplify the full-length genes) were then performed enabling random recombination and amplification of the full-length shuffled product. In addition, a mutation rate of 4 nt/gene and a deletion rate of 0.25 nt/gene were obtained (as shown by Sanger sequencing of 17 individual clones). The shuffled product was cloned into pCTCON2 using NheI and BamHI restriction sites. Large-scale transformation into DH10B was performed, yielding 5.5 × 10 7 transformants. The DNA was maxiprepped and transformed into yeast strain EBY100 (kind gift from K. D. Wittrup) using a large-scale, high-efficiency protocol 53 to yield 6.7 × 10 7 transformants. Selection The yeast library (about 1–5 × 10 9 cells) was grown overnight at 30 °C in 1 L SD medium (20 g/L dextrose, 6.7 g/L yeast nitrogen base, 1.92 g/L yeast synthetic dropout without tryptophan, 7.44 g/L NaH 2 PO 4 , 10.2 g/L Na 2 HPO 4 -7H 2 O, 1% penicillin–streptomycin 10,000 U/mL). The following morning yeast culture was diluted to OD 600nm 1 in 1 L of SD and grown at 30 °C until OD 600nm 2–5. Next, 5 × 10 6 cells were pelleted and resuspended in 1 L of SG medium (20 g/L galactose, 2 g/L dextrose 6.7 g/L yeast nitrogen base, 1.92 g/L yeast synthetic dropout without tryptophan, 7.44 g/L NaH 2 PO 4 , 10.2 g/L Na 2 HPO 4 -7H 2 O, 1% penicillin–streptomycin 10,000 U/mL) to grow for 36 h at 23 °C. 5 × 10 8 induced yeast cells were collected (2500 × g—2 min), washed with 10 mL PBS (0.05 M phosphate buffer, 0.150 M NaCl, pH 7.4) + BSA (bovine serum albumin 1 g/L) and incubated for 30 min at room temperature with 1:250 dilution of primary antibody chicken anti-c-myc IgY (Life technologies) in 200 μL of PBS. Cells were then centrifuged, washed with PBS-BSA, and incubated for 20 min on ice with 1:100 dilution of secondary goat-anti chicken antibody coupled to AlexaFluor 647 in 200 μL of PBS. After centrifugation and washing with 10 mL PBS + BSA, the cells were resuspended in 5 mL of PBS supplemented with appropriate fluorogen concentration. The cells were sorted on a MoFlo TM Astrios Cell sorter (Beckman Coulter) equipped with 405 nm, 488 nm, and 640 nm lasers. The fluorescence of HBO-3,5DM and HBO-3M binders were detected using the following parameters: Ex 405 nm, Em 458 ± 30 nm. For the selection using library A, the fluorescence of HBT-3,5DM and HBT-3M binders were detected using the following parameters: Ex 405 nm, Em 488 ± 5 nm. For the selection using library B, the fluorescence of HBT-3,5DM binders was detected using the following parameters: Ex 405 nm, Em 513 ± 13 nm. The fluorescence of HBP-3,5DM and HBP-3M binders were detected using the following parameters: Ex 488 nm, Em 526 ± 26 nm. Finally, the fluorescence of HBP-3,5DOM binders was detected using the following parameters: Ex 488 nm, Em 546 ± 10 nm. Sorted cells were collected in SD, grown overnight at 30 °C, and plates on SD plates (SD supplemented with 182 g/L D-sorbitol and 15 g/L agar) for ~60 h at 30 °C. The resulting lawn was collected in SD supplemented with 30% glycerol, aliquoted and frozen or directly used for the next round of selection. In total, 5–8 rounds of selection were performed for each fluorogen. After each selection, 24 clones per final rounds were isolated, screened by flow cytometry, and their plasmid DNA was isolated using miniprep kit (Qiagen), transformed in DH10B, and re-isolated for sequencing.
Cloning
Variants obtained by rational design were cloned in pCTCON2 plasmids driving EBY100 yeast surface expression using NheI and BamHI restriction sites as for library construction (vide supra) . All the plasmids used in this study are listed in Supplementary Table 10 .
Flow cytometry analysis
Flow cytometry was performed on a Gallios analyzer (Beckman Coulter) equipped with 405 nm, 488 nm, and 638 nm lasers and ten filters and channels. To prepare samples for flow cytometry, small-scale cultures were grown as for library expression (vide supra) . Briefly, 5 mL of SD were inoculated with a single colony and grown overnight at 30 °C. The following day, the cultures were diluted in 5 mL of SD to a final OD 600nm 1 and grown until OD 600nm 2–5. These cultures were used to inoculate 5 mL of either SD (non-induced cultures) or SG (induced cultures) to an OD 600nm of 0.5 and the cultures were grown for 36 h at 23 °C. The cultures were collected (2500 × g—2 min) to reach a final concentration of 1 × 10 8 cells/mL. For analysis, the monoclonal yeast cells were prepared and incubated with the set of antibodies as for library expression (vide supra). The cultures were finally resuspended in PBS supplemented with appropriate fluorogens concentrations. Data were analyzed using Kaluza Analysis software (Beckman Coulter).
Characterization of variants Cloning Plasmids driving
E. coli expression of the variants with an N-terminal His-tag under the control of a T7 promoter were constructed by replacing the sequence coding for FAST in the plasmid pAG87 13 using isothermal Gibson assembly. Site-directed mutagenesis was performed by isothermal Gibson assembly using primers with the mutations of interest. All the characterized variants are listed in Supplementary Table 11 .
Expression
The plasmids were transformed in Rosetta (DE3) pLys E. coli (New England Biolabs). Cells were grown at 37 °C in lysogen Broth (LB) medium supplemented with 50 μg/ml kanamycin and 34 μg/mL chloramphenicol to OD 600nm 0.6. Expression was induced overnight at 16 °C by adding isopropyl-β-D-1-thiogalactopyranoside (IPTG) to a final concentration of 1 mM. Cells were harvested by centrifugation (4300 × g for 20 min at 4 °C) and frozen.
Purification
The cell pellet was resuspended in lysis buffer (PBS supplemented with 2.5 mM MgCl 2 , 1 mM of protease inhibitor PhenylMethaneSulfonyl Fluoride PMSF, 0.025 mg/mL of DNAse, pH 7.4) and sonicated (5 min, 20% of amplitude) on ice. The lysate was incubated for 2–3 h on ice to allow DNA digestion by DNAse. Cellular fragments were removed by centrifugation (9000 × g for 1 h at 4 °C). The supernatant was incubated overnight at 4 °C by gentle agitation with pre-washed Ni-NTA agarose beads in PBS buffer complemented with 20 mM of imidazole. Beads were washed with 10 volumes of PBS complemented with 20 mM of imidazole and with 5 volumes of PBS complemented with 40 mM of imidazole. His-tagged proteins were eluted with 5 volumes of PBS complemented with 0.5 M of imidazole. The buffer was exchanged to PBS (0.05 M phosphate buffer, 0.150 M NaCl) using PD-10 or PD-MidiTrap G-25 desalting columns (GE Healthcare). Purity of the proteins were evaluated using SDS-PAGE electrophoresis stained with Coomassie blue.
Physico-chemical measurements
Steady state UV-Vis absorption spectra were recorded using a Cary 300 UV-Vis spectrometer (Agilent Technologies), equipped with a Versa20 Peltier-based temperature-controlled cuvette chamber (Quantum Northwest), and fluorescence spectra were recorded using an LPS 220 spectrofluorometer (PTI, Monmouth Junction, NJ), equipped with a TLC50TM Legacy/PTI Peltier-based temperature-controlled cuvette chamber (Quantum Northwest). Fluorescence quantum yield measurements were determined as previously described using either FAST:HMBR or quinine sulfate as a reference 13 , 21 , 23 , 54 . Reciprocal dilution with protein solution was used so as to keep the protein concentration constant at 40 μM while diluting the fluorogen solution. Absorption coefficients were determined by forward titration of fluorogens into a 40 μM protein solution. Thermodynamic dissociation constants were determined by titration experiments in which we measured the fluorescence of the fluorescent assembly at various fluorogen concentrations using a Spark 10 M plate reader (Tecan) and fitting data in Prism 9 to a one-site specific binding model. The thermodynamic dissociation constants ( K D ) of the dark HBIR-3M and HBIR-3,5DM chromophores were determined by determining the apparent dissociation constant of HBP-3,5DM in presence of various concentrations of dark competitors (See Supplementary Note 2 ).
Modeling
Homology modeling
The homology models of FAST and pFAST were generated according to models previously described 55 , 56 . Briefly, sequence alignments between FAST and pFAST and the ultra-high resolution structure of the Halorhodospira halophila Photoactive Yellow Protein (PYP) (Protein Data Bank (PDB) ID: 6P4I) were generated with Clustal W 57 . Alignments were manually refined to avoid gaps in predicted (FAST and pFAST) and known (PYP) secondary structure elements. Three-dimensional FAST and pFAST models were built from these alignments and from crystallographic atomic coordinates of PYP using the automated comparative modeling tool MODELER (Sali and Blundell) implemented in Discovery Studio. The best model according to DOPE score (Discrete Optimized Protein Energy) and potential energy calculated by modeler were solvated (10 Å water box and 0.145 M NaCl) and minimized using Adopted Basis NR algorithm to a final gradient of 0.001. The resulting structure were submitted to a 10 ns NAMD dynamic.
Molecular docking
Flexible ligand-rigid protein docking was performed using CDOCKER implemented in Discovery Studio 2019 58 . Random ligand conformations were generated from the initial ligand structure through high-temperature molecular dynamics. The best poses according to their ligscore2 59 were retained and clustered according to their binding mode. The most significant poses were solvated and minimized using Adopted Basis NR algorithm to a final gradient of 0.001. Experiments in mammalian cells General HeLa cells (ATCC CRM-CCL2) were cultured in Minimal Essential Media (MEM) supplemented with phenol red, Glutamax I, 1 mM of sodium pyruvate, 1% (vol/vol) of non-essential amino-acids and 10% (vol/vol) fetal calf serum (FCS), at 37 °C in a 5% CO 2 atmosphere. HEK 293 T (ATCC CRL-3216) cells were cultured in Dulbecco’s Modified Eagle Medium (DMEM) supplemented with phenol red and 10% (vol/vol) fetal calf serum at 37 °C in a 5% CO 2 atmosphere. For imaging, cells were seeded in μDish IBIDI (Biovalley) coated with poly-L-lysine. Cells were transiently transfected using Genejuice (Merck) or Lipofectamine 2000 (Thermo Fisher Scientific) according to the manufacturer’s protocols for 24–48 h prior to imaging. Live cells were washed with DPBS (Dulbecco’s Phosphate-Buffered Saline), and treated with DMEM media (without serum and phenol red) containing the fluorogens at the indicated concentration. The cells were imaged directly without washing. Fixation of cells was performed using formaldehyde solution at 3.7% for 30 min. Fixed cells were then washed three times with DPBS and treated with DPBS containing the fluorogens at the indicated concentration prior to imaging. For FLIM-FRET experiments, U2OS cells (ATCC HTB-96) were cultured in Dulbecco’s modified Eagle’s medium (DMEM) supplemented with phenol red and 10% (vol/vol) fetal calf serum and 1% (vol/vol) penicillin–streptomycin at 37 °C in a 5% CO 2 atmosphere, plated on 8-wells Labtek (Nunc) and then imaged in phenol-red-free Leibovitz’s L-15 medium (L-15, Thermo Fisher Scientific), supplemented with 20% fetal bovin serum, 1% L-glutamine, and 1% penicillin–streptomycin. For experiments using AURKA biosensor, mitotic cells were obtained after synchronization at the G2/M transition with 100 ng/mL nocodazole (Sigma-Aldrich) for 16 h. Cells were washed twice and incubated with prewarmed imaging medium containing the fluorogens at the indicated concentration for 30 min to reach metaphase.
Cloning
The plasmids allowing the mammalian expression of pFAST, tFAST and oFAST variants under the control of a CMV promoter were constructed by replacing the sequence coding for FAST 13 or iFAST 54 in the previously described plasmids pAG104 (FAST), pAG106 (lyn11-FAST), pAG109 (H2B-FAST), pAG156 (mito-FAST), pAG470 (lifeAct-iFAST) and pAG498 (MAP4-FAST) using isothermal Gibson assembly. The plasmids allowing the mammalian expression of mTurquoise2-pFAST and EGFP-pFAST tandems under the control of a CMV promoter were constructed by replacing the sequence coding for superYFP or mCherry of the previously described plasmids 35 by pFAST sequence. The plasmid allowing the mammalian expression of mTurquoise2-AURKA-pFAST biosensor under the control of a CMV promoter was constructed by replacing the sequence coding for superYFP in the previously described plasmid by pFAST sequence. All the plasmids used in this study are listed in Supplementary Table 10 .
Cell viability assay
HeLa cells were treated with MEM media containing the appropriate fluorogen (HBP-3,5DOM, HBP-3,5DM, HBP-3M, HBT-3,5DOM, HBT-3,5DM, HBT-3M, HBO-3,5DM, HBO-3M, HBIR-3,5DOM, HBIR-3,5DM, and HBIR-3M) at the indicated concentrations for the indicated times. The cell viability was evaluated by fluorescence microscopy using the LIVE/DEAD® viability/cytotoxicity assay kit (Molecular Probes, Life Technologies) following the manufacturer’s protocol.
Fluorescence microscopy
The confocal micrographs of mammalian cells were acquired on a Zeiss LSM 710 Laser Scanning Microscope equipped with a Plan Apochromat 63 ×/1.4 NA oil immersion objective and on a Leica TCS SP5 confocal laser scanning microscope equipped with a 63 ×/ 1.4 NA oil immersion objective. ZEN and Leica LAS AF softwares were used to collect the data. Zeiss LSM 880 confocal laser scanning microscope equipped with a 63 ×/1.4 NA oil immersion objective and equipped with photomultiplier modules for confocal imaging and a dedicated highly sensitive spectral detector using the Airyscan module was used to acquire improved spatial resolution images of HeLa cells. Airyscan uses a 32-channel gallium arsenide phosphide photomultiplier tube (GaAsP-PMT) area detector that collects a pinhole-plane image at every scan position. Each detector element functions as a single, very small pinhole 60 . ZEN blue and black softwares were used to collect the data and processing of Airyscan images were performed on the software. The images were analyzed with Fiji (Image J). Photobleaching measurements for HBR-3,5DOM, HBR-3,5DM, HMBR, HBP-3,5DOM, HBP-3,5DM, and HBP-3M were acquired using 405, 458, and 488 nm excitation in different illumination conditions. At 488 nm excitation, EGFP was used as a control. At 458 nm excitation, mTurquoise2 was used as a control. Samples were acquired continuously for 150 images or 500 images using different time lapse between two images. In all cases the pixel dwell was 2.55 μs. The images were analyzed with Fiji (Image J). FLIM-FRET FLIM analyses were performed with a time-gated custom-built system coupled to a Leica DMI6000 microscope (Leica) with a CSU-X1 spinning disk module (Yokogawa) and a 63 ×/1.4 NA oil immersion objective as described elsewhere 34 . To calculate fluorescence lifetime, five temporal gates with a step of 2 ns each allowed the sequential acquisition of five images covering a total delay time spanning from 0 to 10 ns. The five images were used to calculate the pixel-by-pixel mean fluorescence lifetime as described elsewhere 34 , 61 . Lifetime measurements and calculations were performed using the Inscoper software (Inscoper). Lifetime was calculated only when pixel-by-pixel fluorescence intensity in the first gate was above 3000 gray levels.
Super-resolution microscopy STimulated Emission Depletion
(STED) images were acquired on NeurImag facility with a confocal laser scanning microscope LEICA SP8 STED 3DX equipped with a 93×/1.3 NA glycerol immersion objective and with two hybrid detectors (HyDs). The specimens were imaged with a white-light laser and a pulsed 775 nm depletion laser to acquire nanoscale imaging. Typically, images of 1024 × 1024 pixels were acquired with a magnification above three resulting in a pixel size in the range of 25–45 nm. Deconvolution processing was performed on STED images using CMLE analysis with Huygens software. Iterative processes (up to 40 cycles) were used with a quality criteria ranging from 1 to 5%.
Flow cytometry analysis
Flow cytometry on HEK 293 T cells was performed on a Gallios analyzer (Beckman Coulter) equipped with 405 nm, 488 nm, and 638 nm lasers and ten filters and channels. To prepare samples, cells were first grown in cell culture flasks, then transiently co-transfected with pAG104 (cmv-FAST) and pAG753 (cmv-iRFP670) or pAG654 (cmv-pFAST) and pAG753 (cmv-iRFP670) 24 h after seeding, using Genejuice (Merck) according to the manufacturer’s protocol for 24 h. Simple positive controls were also prepared by transiently transfected cells with either pAG753 or pAG654 plasmids. After 24 h, cells were centrifuged in PBS with BSA (1 mg/ml) and resuspend in PBS-BSA supplemented with the appropriate amounts of fluorogens. For each experiments, 20,000 cells positively transfected with iRFP670 (Ex 638 nm / Em 660 ± 10 nm) were analyzed with the following parameters: Ex 488 nm, Em 525 ± 20 nm for cells expressing FAST and pFAST labeled with HMBR and HBP-3,5DM; Ex 488 nm, Em 575 ± 15 nm for cells expressing FAST and pFAST labeled with HBR-3,5DM and HBP-3,5DOM and Ex 488 nm, Em 620 ± 15 nm for cells expressing FAST and pFAST labeled with HBR-3,5DOM. Data were analyzed using Kaluza Analysis software (Beckman Coulter).
Experiments in primary hippocampal neuronal cells
All experiments involving rats were performed in accordance with the directive 2010/63/EU of the European Parliament and of the Council of 22 September 2010 on the protection of animals used for scientific purposes. Hippocampal neurons from male and female Sprague Dawley embryonic rats (E18) were prepared as described previously 62 . Cells were grown on onto poly-L-lysine-coated 18 mm coverslips (1 mg/ml) at a density of 25,000 cells /cm 2 in Neurobasal-B27 medium previously conditioned by a confluent glial feeder layer [Neurobasal medium (ThermoFisher 21103049) containing a 2% B27 supplement (ThermoFisher A3582801), and 500 μM L-glutamine (ThermoFisher 25030024)]. Neurons were transfected 2 days before imaging using Lipofectamine 2000 (ThermoFisher). After 10–21 days in vitro, neurons were incubated with the fluorogenic chromophores and imaged immediately at 37 °C. Experiments in chicken embryos JA57 chicken fertilized eggs were provided by EARL Morizeau (8 rue du Moulin, 28190 Dangers, France) and incubated at 38 °C in a Sanyo MIR-253 incubator. Embryos used in this study were between E2 (HH14) and E3 (HH14 + 24 h). The sex of the embryos was not determined. Under current European Union regulations, experiments on avian embryos between 2 and 4 days in ovo are not subject to restrictions.
Cloning
For expression of H2B-FAST and H2B-pFAST in the chick neural tube, the CMV promoters in pAG109 and pAG657 and pAG671 were converted to a CAGGS promoter 63 by replacing the NdeI/BglII fragment with a NdeI/BglII CAGGS fragment from pCAGGS-MCS2 (X. Morin, unpublished). For expression of mito-pFAST, the NdeI/EcoRI fragment of the CMV promoter in pAG671 was replaced with the NdeI/EcoRI CAGGS fragment from pCAGGS-MCS2. pCAGGS-H2B-mCerulean was created by removing an SphI fragment from Tol2-CAG::Nucbow (Addgene #158992), and pCAGGS-H2B-EYFP was obtained by removing an AgeI fragment from PB-CAG::CytBow (Addgene #158995). Construction details, complete sequences, and plasmids are available upon request. Electroporation in the chick neural tube was performed at embryonic day 2 (E2, HH stage 14), by applying five pulses of 50 ms at 25 V with 100 ms in between, using a square-wave electroporator (Nepa Gene, CUY21SC) and a pair of 5 mm gold-plated electrodes (BTX Genetrode model 512) separated by a 4 mm interval. The DNA solution was injected directly into the lumen of the neural tube via glass capillaries. Bilateral electroporation was achieved by switching the electrodes polarity and repeating the procedure after 2 h. DNA constructs were used at 0.5 μg/μl each, except pCX-mbCherry which was used at a concentration of 0.3 µg/µl. En-face culture of the embryonic neuroepithelium was performed at E3 (24 h after electroporation). After extraction from the egg and removal of extraembryonic membranes in PBS, embryos were transferred to 37 °C F12 medium and pinned down with dissection needles at the level of the hindbrain and hindlimbs in a 35 mm Sylgard dissection dish. A dissection needle was used to separate the neural tube from the somites from hindbrain to caudal end on both sides of the embryo, and the roof-plate was then slit with the needle. The neural tube and notochord were then “peeled off” from the remaining tissues and equilibrated 2 min in 1% low melting point agarose/F12 medium at 38 °C. The tissue was then transferred in a drop of agarose medium to a glass-bottom culture dish (MatTek, P35G-0-14-C) and excess medium was removed so that the neural tube would flatten with its apical surface facing the bottom of the dish, in an inverted open book conformation. After 30 s of polymerization on ice, an extra layer of agarose medium (100 µl) was added to cover the whole tissue and hardened on ice for 1 min. Then 1.9 mL of 37 °C culture medium was added (F12/Penicillin–Streptomycin/Sodium pyruvate) and the culture dish was transferred to the 37 °C chamber of a spinning disk confocal microscope. To image pFAST and FAST, intermediate dilutions (2–200 µM) of ligands HBR-3,5DOM, HBR-3,5DM, HMBR, HBP-3,5DOM, HBP-3,5DM, HBP-3M, and HBIR-3M were prepared by diluting the original 20 mM stocks in F12 medium, and appropriate volumes were added to the dish to reach the desired final concentrations. Live imaging was performed on an inverted microscope (Nikon Ti Eclipse) equipped with a heating enclosure (DigitalPixel, UK), a spinning disk head (Yokogawa CSUW1) and Borealis system (Andor) for confocal imaging, a Spectra-X LED light engine (Lumencor) for widefield fluorescence illumination and an sCMOS Camera (Orca Flash4LT, Hamamatsu) driven by MicroManager software 64 . Image stacks were obtained at 2- or 3-min intervals either with a 10× objective (CFI Plan APO LBDA, NA 0.45, Nikon; z-step = 4 μm) or a 100× oil immersion objective (APO VC, NA 1.4, Nikon; z-step = 1 μm). Reporting summary Further information on research design is available in the Nature Research Reporting Summary linked to this article.
Supplementary information Supplementary information Description of Additional Supplementary Files Supplementary Movie 1 Supplementary Movie 2 Supplementary Movie 3 Supplementary Movie 4 Supplementary Movie 5 Supplementary Movie 6 Supplementary Movie 7 Supplementary Movie 8 Reporting Summary Peer Review File
📊 Figures
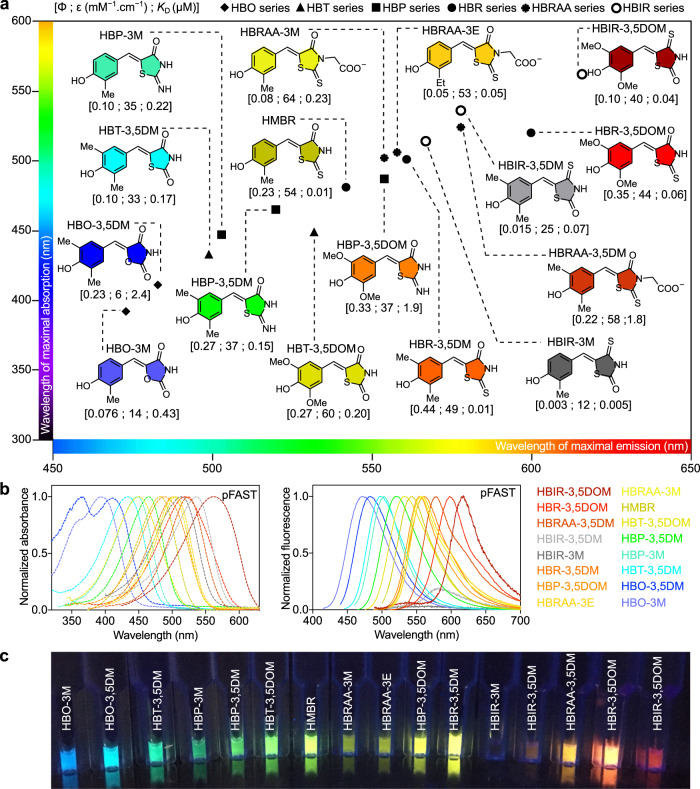
Fig. 1
The engineered protein tag pFAST is a fluorescent chemogenetic reporter with tunable color.
a Structures of the chromophores of the HBO, HBT, HBP, HBR, HBIR, and HBRAA series positioned according to the wavelengths of maximal emission and maximal absorption of their assembly with pFAST. The ...
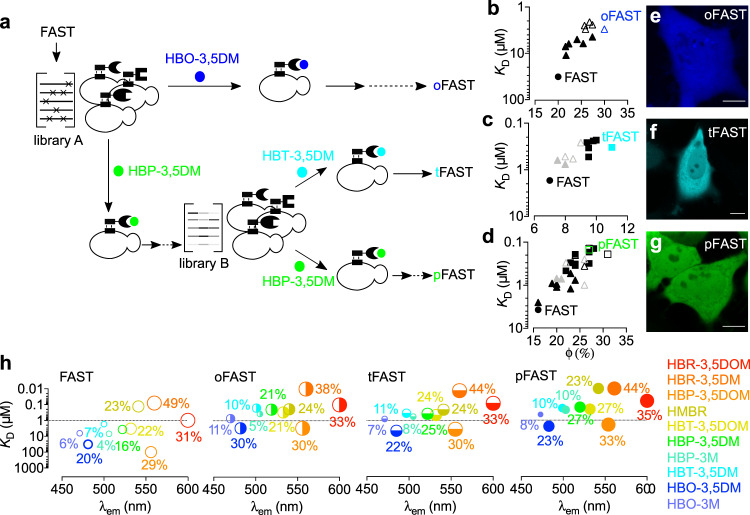
Fig. 2
Engineering of promiscuous FAST variants.
a Directed evolution allowed the generation of oFAST, tFAST, and pFAST. Yeast-displayed libraries of variants of FAST were screened in presence of the indicated fluorogenic chromophore by fluorescence...
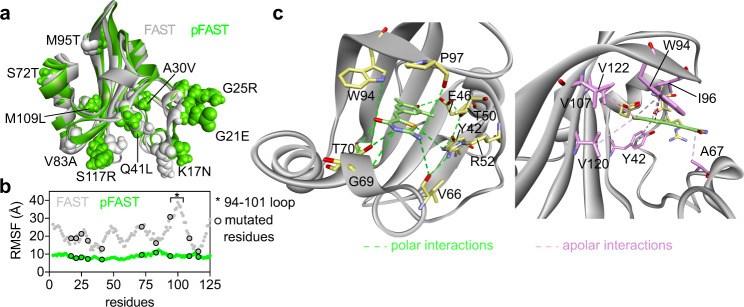
Fig. 3
Structural model of pFAST.
a Structural model of pFAST and FAST generated by homology modeling using the crystal structure of the Halorhodospira halophila Photoactive Yellow Protein PYP (PDB: 6P4I) (See also Supplementary Fig. ...
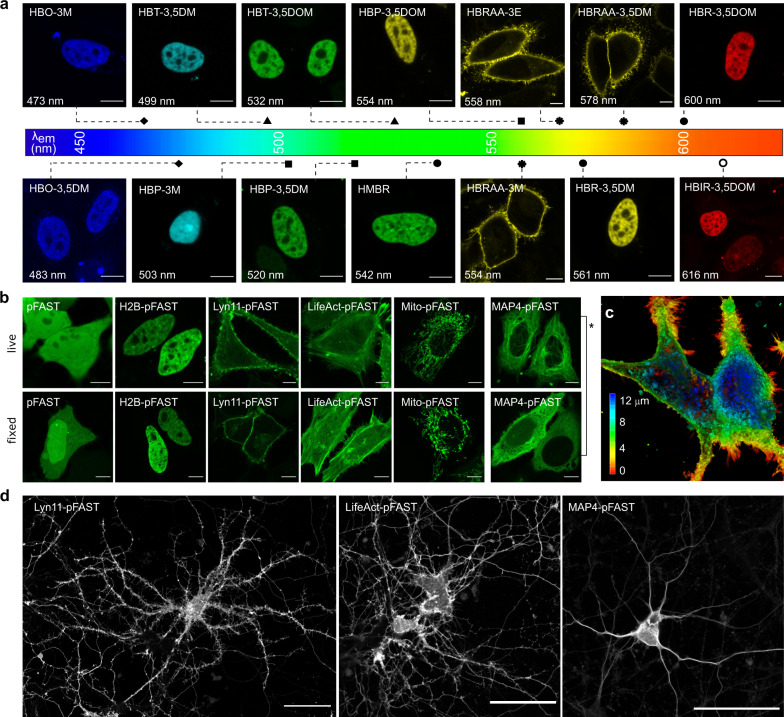
Fig. 4
Selective imaging of pFAST fusions in various cellular localizations in mammalian cells and cultured neurons.
a Confocal micrographs of HeLa cells expressing pFAST fusions (either with H2B or to a transmembrane domain) in presence of the entire set of fluorogenic chromophores. Scale bars 10u2009u03bcm. Experi...
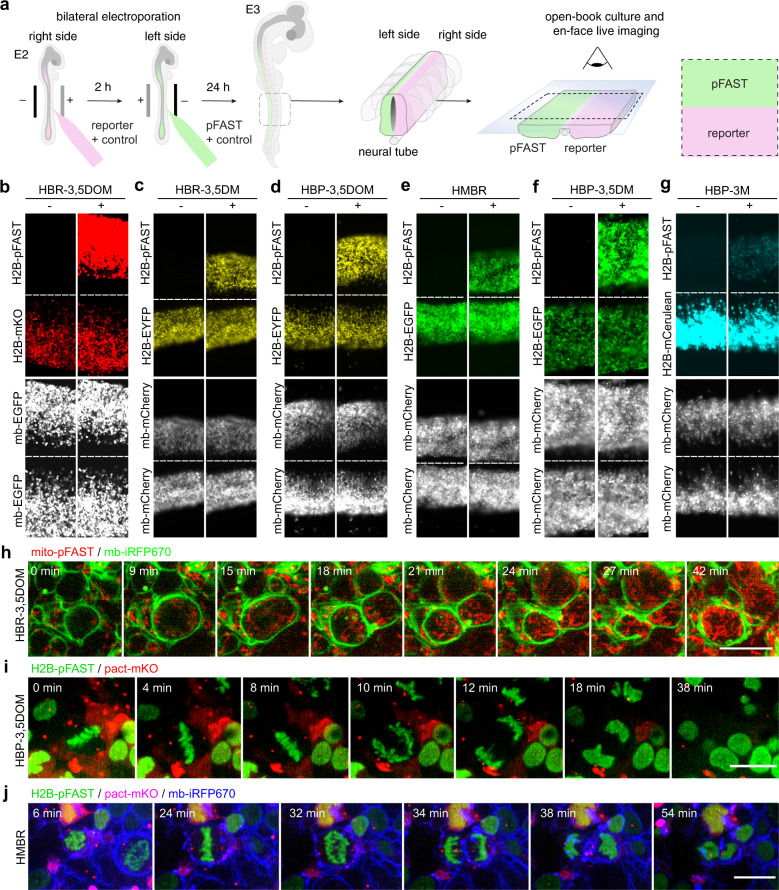
Fig. 5
Selective imaging of pFAST fusions in chicken embryo.
a u2013 g Plasmids encoding H2B-pFAST and b mKO, c , d EYFP, e , f EGFP, and g mCerulean fused to H2B were electroporated in each side of the neural tube in ovo at embryonic day 2 (E2, HH stage 13u201...
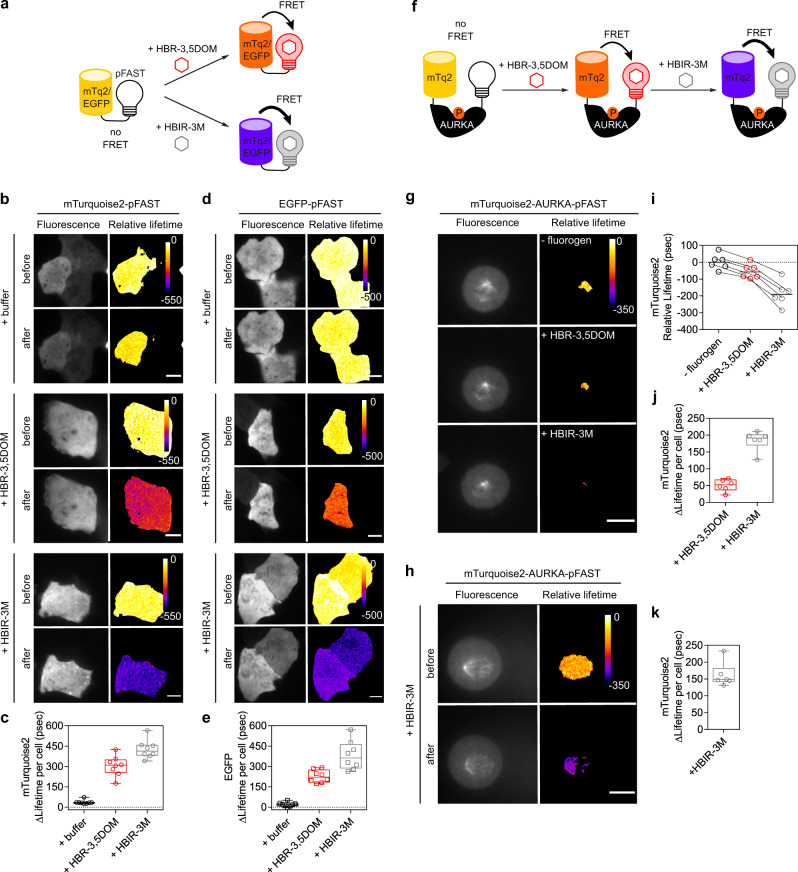
Fig. 6
Fluorescence lifetime imaging of mTurquoise2 and EGFP donors using pFAST as acceptor in FRET experiments.
a Model illustrating the FRET experiments of mTurquoise2-pFAST and EGFP-pFAST tandems before and after addition of HBR-3,5DOM or HBIR-3M chromophores. b u2013 e Representative fluorescence (left panel...
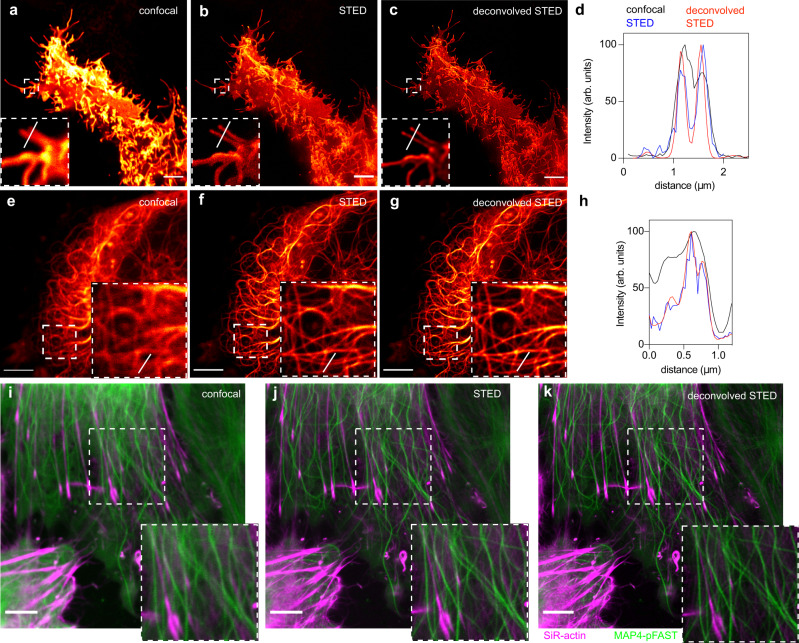
Fig. 7
STED nanoscopy of pFAST-tagged proteins in live mammalian cells.
a u2013 h Confocal and STED micrographs of live HeLa cells expressing a u2013 d Lyn11-pFAST and e u2013 h MAP4-pFAST. The graphs d , h show gain in resolution. Experiments with Lyn11-pFAST and MAP4-pF...
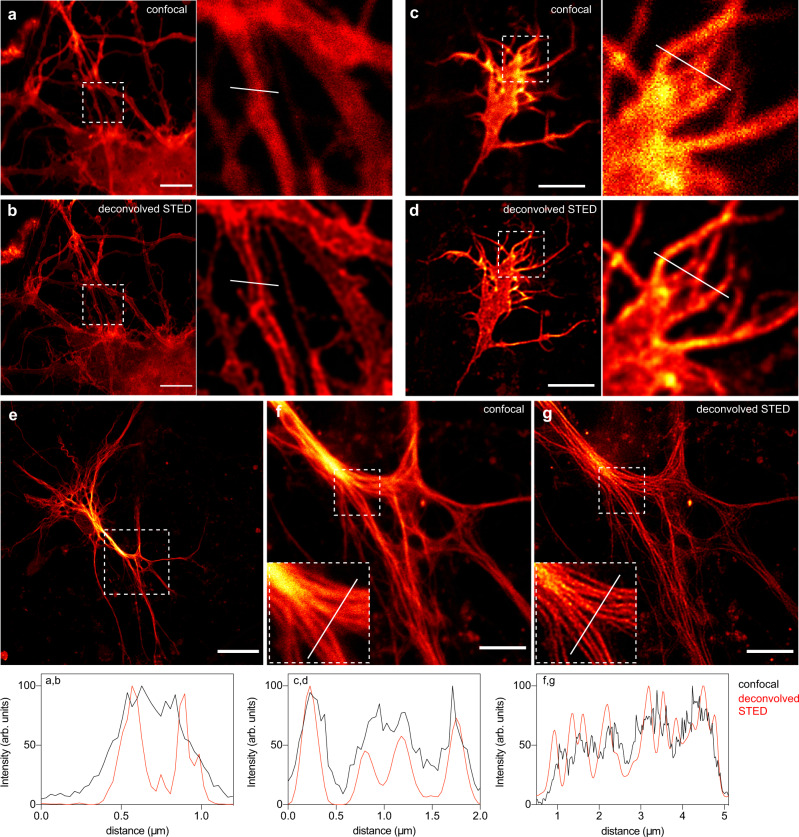
Fig. 8
STED nanoscopy of pFAST-tagged proteins in live neurons and astrocytes.
a , b Confocal and STED micrographs of live dissociated hippocampal neuron expressing LifeAct-pFAST. c , d Confocal and STED micrographs of a neurite growth cone expressing LifeAct-pFAST. e u2013 g Co...
Figure images are served from the NIH/NLM PubMed Central Open Access Subset or Europe PMC; copyright remains with the publishers and authors.
💬 Discussion
0 commentsNo comments yet. Be the first to start a discussion!
Leave a Comment