Abstract
Defective filopodia formation is linked to pathologies such as cancer, wherein actively protruding filopodia, at the invasive front, accompany cancer cell dissemination. Despite wide biological significance, delineating filopodia function in complex systems remains challenging and is particularly hindered by lack of compatible methods to quantify filopodia properties. Here, we present FiloQuant, a freely available ImageJ plugin, to detect filopodia-like protrusions in both fixed- and live-cell microscopy data. We demonstrate that FiloQuant can extract quantifiable information, including protrusion dynamics, density, and length, from multiple cell types and in a range of microenvironments. In cellular models of breast ductal carcinoma in situ, we reveal a link between filopodia formation at the cell-matrix interface, in collectively invading cells and 3D tumor spheroids, and the in vitro invasive capacity of the carcinoma. Finally, using intravital microscopy, we observe that tumor spheroids display filopodia in vivo, supporting a potential role for these protrusions during tumorigenesis.
🔬 Techniques
🔭 Microscopes
🧬 Organisms
💻 Software
✨ Fluorophores
🧪 Sample Preparation
🔬 Cell Lines
🏭 Microscope Brands
🧪 Reagent Suppliers
📷 Detectors
💻 Software Details
💾 Data Repositories
🏛️ Research Organizations (ROR)
Affiliated research institutions:
📋 Methods
FiloQuant installation The files necessary to run FiloQuant in Fiji ( https://fiji.sc/ ) are provided as software together with test images in the supplemental zip file. Alternatively, FiloQuant installation in Fiji can be easily achieved through the ImageJ update site (see supplemental FiloQuant manual). In brief, in Fiji, click on “Help → Update,” then “Manage update sites,” and “add my site.” In the field “ImageJ Wiki account,” input “FiloQuant,” then click “OK.” Close the “Manage update sites” window and, in the ImageJ Updater window, click on “Apply changes.” FiloQuant can then be found under “plugin → FiloQuant.” To run FiloQuant in ImageJ, users need to install the following dependencies: Enhanced Local Contrast (CLAHE.class; http://imagej.net/Enhance_Local_Contrast_(CLAHE) ), Skeletonize3D.jar ( http://imagej.net/Skeletonize3D ), AnalyzeSkeleton.jar ( http://imagej.net/AnalyzeSkeleton ; Arganda-Carreras et al., 2010 ), and Temporal-Color Code ( http://imagej.net/Temporal-Color_Code ).
Cell culture and transient transfection
Immortalized normal breast epithelial cells (MCF10A), T24 c-Ha-ras oncogene-transfected MCF10A cells (MCF10AT), and invasive variant MCF10 DCIS.COM (DCIS.COM) cells were cultured in a 1:1 mix of DMEM (Sigma-Aldrich) and F12 (Sigma-Aldrich) supplemented with 5% horse serum (16050-122; GIBCO BRL), 20 ng/ml human EGF (E9644; Sigma-Aldrich), 0.5 mg/ml hydrocortisone (H0888-1G; Sigma-Aldrich), 100 ng/ml cholera toxin (C8052-1MG; Sigma-Aldrich), 10 µg/ml insulin (I9278-5ML; Sigma-Aldrich), and 1% (vol/vol) penicillin/streptomycin (P0781-100ML; Sigma-Aldrich). DCIS.COM cells were cloned from a cell culture initiated from a xenograft obtained after two trocar passages of a lesion formed by MCF10AT cells ( Miller et al., 2000 ). MCF10A LifeAct and DCIS.COM LifeAct cells were generated by lentiviral transduction (see Virus production section). A2780 (ovarian carcinoma) cells were cultured in RPMI 1640 (Sigma-Aldrich) supplemented with 10% FCS. MDA-MB-231 (triple-negative human breast adenocarcinoma) cancer cells and telomerase immortalized human fibroblasts (TIFs) were grown in DMEM supplemented with 10% FCS. The 293FT packaging cell line was grown in high-glucose DMEM supplemented with 10% FCS, 0.1 mM nonessential amino acids, 1 mM sodium pyruvate, 6 mM l -glutamine, 1% (vol/vol) penicillin/streptomycin, and 0.5 mg/ml geneticin (all from Thermo Fisher Scientific). All cells were maintained at 37°C and 5% CO 2 . MDA-MB-231 and MCF10A were provided by the ATCC. A2780 cells were a gift from P. Caswell (University of Manchester, Manchester, England, UK). TIF cells were donated by J. Norman (CRUK Beatson Institute, Glasgow, Scotland, UK). MCF10AT and DCIS.COM were provided by J.F. Marshall (Barts Cancer Institute, Queen Mary University of London, London, England, UK). Primary hippocampal neurons were isolated from embryonic day 20 rat embryos. In brief, embryonic brain tissue was dissected, and neurons were recovered by enzymatic digestion with trypsin and mechanical dissociation. Cells were maintained in neurobasal medium supplemented with 2% B27 supplement, 0.5 mM l -glutamine, 0.1 mg/ml primocin, and 25 µM glutamate (all from Invitrogen). NK-92 cells were maintained in α MEM complemented with 0.2 mM myoinositol, 0.1 mM β-mercaptoethanol, 0.02 mM folic acid, 12.5% heat inactivated horse serum, 12.5% heat-inactivated FCS (all from Sigma-Aldrich), 2 mM l -glutamine, and 1× nonessential amino acids (Gibco). The growth medium was replaced every 2 d and supplemented with 100 U/ml human recombinant interleukin-2 (Roche). All cells were tested for mycoplasma contamination. Plasmids of interest were transfected using Lipofectamine 3000 and the P3000TM Enhancer Reagent (Thermo Fisher Scientific) according to the manufacturer’s instructions. Reagents, antibodies, plasmids, and compounds The anti-MAP2 antibody was acquired from Antibodies Online (ABIN372661; used at 1:1,000 for immunofluorescence). The Alexa Fluor 488 Phalloidin (A12379), used to stain filamentous actin, and DAPI (D1306) were purchased from Life Technologies. Bovine plasma FN was purchased from Merck (341631). DMSO and latrunculin B (L5288-1MG) were obtained from Sigma-Aldrich. GFR Matrigel was bought from BD Biosciences (354230). PureCol EZ Gel (fibrillar collagen I, concentration 5 mg/ml) was provided by Advanced BioMatrix. DQ collagen (type I collagen from bovine skin, fluorescein conjugate; D12060 ) was provided by Thermo Fisher Scientific. mEmerald-Lifeact-7 was a gift from M. Davidson (plasmid 54148; Addgene). psPAX2 and pMD2.G were gifts from D. Trono (École polytechnique fédérale de Lausanne, Lausanne, Switzerland; plasmids 12260 and 12259; Addgene). pCDH-LifeAct-mRFP was a gift from P. Caswell. Full-length bovine FN was labeled with Alexa Fluor 568 using an Alexa Fluor 568 Protein Labeling kit ( A10238 ; Thermo Fisher Scientific) according to the manufacturer’s instructions. Virus production LifeAct mRFP lentiviral particles were generated in the 293FT packaging cell line after transient cotransfection of pCDH-LifeAct-mRFP, psPAX2, and pMD2.G constructs, in a 7:2:1 ratio, using the calcium-phosphate precipitation method ( Graham and van der Eb, 1973 ). Virus-containing medium was collected 72 h after transfection, concentrated for 2 h at 25,000 rpm, resuspended in residual medium, and flash frozen in liquid nitrogen. Functional titer was evaluated in 293FT cells by FACS (BD LSRFortessa; Becton Dickinson). To obtain stable LifeAct expression, DCIS.COM cells were transduced with MOI 1 (viral particle to cell number ratio of 1:1) and MOI 4 (viral particle to cell number ratio of 4:1), and MCF10A cells were transduced with MOI 4 and MOI 10 of viral stock. Cells exposed to different MOIs were then pooled 3 d after transduction and sorted using a BD FACSaria II cell sorter (Becton Dickinson) with a gating strategy to obtain medium expression. Production of cell-derived matrices to monitor cell migration Cell-derived matrices were generated as previously described ( Jacquemet et al., 2013b ). In brief, TIFs were seeded at a density of 50,000 cells/ml in a 24-well plate. When confluent, cells were cultured for a further 10 d, with medium being changed every 48 h to complete medium supplemented with 50 µg/ml ascorbic acid (Sigma-Aldrich) to ensure collagen cross-linking. Mature matrices were then denuded of cells using lysis buffer (PBS containing 20 mM NH 4 OH and 0.5% [vol/vol] Triton X-100). After PBS washes, matrices were incubated with 10 µg/ml DNase I (Roche) at 37°C for 30 min. Matrices were then stored in PBS containing 1% (vol/vol) penicillin/streptomycin at 4°C before use.
Show full methods section
FiloQuant installation The files necessary to run FiloQuant in Fiji ( https://fiji.sc/ ) are provided as software together with test images in the supplemental zip file. Alternatively, FiloQuant installation in Fiji can be easily achieved through the ImageJ update site (see supplemental FiloQuant manual). In brief, in Fiji, click on “Help → Update,” then “Manage update sites,” and “add my site.” In the field “ImageJ Wiki account,” input “FiloQuant,” then click “OK.” Close the “Manage update sites” window and, in the ImageJ Updater window, click on “Apply changes.” FiloQuant can then be found under “plugin → FiloQuant.” To run FiloQuant in ImageJ, users need to install the following dependencies: Enhanced Local Contrast (CLAHE.class; http://imagej.net/Enhance_Local_Contrast_(CLAHE) ), Skeletonize3D.jar ( http://imagej.net/Skeletonize3D ), AnalyzeSkeleton.jar ( http://imagej.net/AnalyzeSkeleton ; Arganda-Carreras et al., 2010 ), and Temporal-Color Code ( http://imagej.net/Temporal-Color_Code ).
Cell culture and transient transfection
Immortalized normal breast epithelial cells (MCF10A), T24 c-Ha-ras oncogene-transfected MCF10A cells (MCF10AT), and invasive variant MCF10 DCIS.COM (DCIS.COM) cells were cultured in a 1:1 mix of DMEM (Sigma-Aldrich) and F12 (Sigma-Aldrich) supplemented with 5% horse serum (16050-122; GIBCO BRL), 20 ng/ml human EGF (E9644; Sigma-Aldrich), 0.5 mg/ml hydrocortisone (H0888-1G; Sigma-Aldrich), 100 ng/ml cholera toxin (C8052-1MG; Sigma-Aldrich), 10 µg/ml insulin (I9278-5ML; Sigma-Aldrich), and 1% (vol/vol) penicillin/streptomycin (P0781-100ML; Sigma-Aldrich). DCIS.COM cells were cloned from a cell culture initiated from a xenograft obtained after two trocar passages of a lesion formed by MCF10AT cells ( Miller et al., 2000 ). MCF10A LifeAct and DCIS.COM LifeAct cells were generated by lentiviral transduction (see Virus production section). A2780 (ovarian carcinoma) cells were cultured in RPMI 1640 (Sigma-Aldrich) supplemented with 10% FCS. MDA-MB-231 (triple-negative human breast adenocarcinoma) cancer cells and telomerase immortalized human fibroblasts (TIFs) were grown in DMEM supplemented with 10% FCS. The 293FT packaging cell line was grown in high-glucose DMEM supplemented with 10% FCS, 0.1 mM nonessential amino acids, 1 mM sodium pyruvate, 6 mM l -glutamine, 1% (vol/vol) penicillin/streptomycin, and 0.5 mg/ml geneticin (all from Thermo Fisher Scientific). All cells were maintained at 37°C and 5% CO 2 . MDA-MB-231 and MCF10A were provided by the ATCC. A2780 cells were a gift from P. Caswell (University of Manchester, Manchester, England, UK). TIF cells were donated by J. Norman (CRUK Beatson Institute, Glasgow, Scotland, UK). MCF10AT and DCIS.COM were provided by J.F. Marshall (Barts Cancer Institute, Queen Mary University of London, London, England, UK). Primary hippocampal neurons were isolated from embryonic day 20 rat embryos. In brief, embryonic brain tissue was dissected, and neurons were recovered by enzymatic digestion with trypsin and mechanical dissociation. Cells were maintained in neurobasal medium supplemented with 2% B27 supplement, 0.5 mM l -glutamine, 0.1 mg/ml primocin, and 25 µM glutamate (all from Invitrogen). NK-92 cells were maintained in α MEM complemented with 0.2 mM myoinositol, 0.1 mM β-mercaptoethanol, 0.02 mM folic acid, 12.5% heat inactivated horse serum, 12.5% heat-inactivated FCS (all from Sigma-Aldrich), 2 mM l -glutamine, and 1× nonessential amino acids (Gibco). The growth medium was replaced every 2 d and supplemented with 100 U/ml human recombinant interleukin-2 (Roche). All cells were tested for mycoplasma contamination. Plasmids of interest were transfected using Lipofectamine 3000 and the P3000TM Enhancer Reagent (Thermo Fisher Scientific) according to the manufacturer’s instructions. Reagents, antibodies, plasmids, and compounds The anti-MAP2 antibody was acquired from Antibodies Online (ABIN372661; used at 1:1,000 for immunofluorescence). The Alexa Fluor 488 Phalloidin (A12379), used to stain filamentous actin, and DAPI (D1306) were purchased from Life Technologies. Bovine plasma FN was purchased from Merck (341631). DMSO and latrunculin B (L5288-1MG) were obtained from Sigma-Aldrich. GFR Matrigel was bought from BD Biosciences (354230). PureCol EZ Gel (fibrillar collagen I, concentration 5 mg/ml) was provided by Advanced BioMatrix. DQ collagen (type I collagen from bovine skin, fluorescein conjugate; D12060 ) was provided by Thermo Fisher Scientific. mEmerald-Lifeact-7 was a gift from M. Davidson (plasmid 54148; Addgene). psPAX2 and pMD2.G were gifts from D. Trono (École polytechnique fédérale de Lausanne, Lausanne, Switzerland; plasmids 12260 and 12259; Addgene). pCDH-LifeAct-mRFP was a gift from P. Caswell. Full-length bovine FN was labeled with Alexa Fluor 568 using an Alexa Fluor 568 Protein Labeling kit ( A10238 ; Thermo Fisher Scientific) according to the manufacturer’s instructions. Virus production LifeAct mRFP lentiviral particles were generated in the 293FT packaging cell line after transient cotransfection of pCDH-LifeAct-mRFP, psPAX2, and pMD2.G constructs, in a 7:2:1 ratio, using the calcium-phosphate precipitation method ( Graham and van der Eb, 1973 ). Virus-containing medium was collected 72 h after transfection, concentrated for 2 h at 25,000 rpm, resuspended in residual medium, and flash frozen in liquid nitrogen. Functional titer was evaluated in 293FT cells by FACS (BD LSRFortessa; Becton Dickinson). To obtain stable LifeAct expression, DCIS.COM cells were transduced with MOI 1 (viral particle to cell number ratio of 1:1) and MOI 4 (viral particle to cell number ratio of 4:1), and MCF10A cells were transduced with MOI 4 and MOI 10 of viral stock. Cells exposed to different MOIs were then pooled 3 d after transduction and sorted using a BD FACSaria II cell sorter (Becton Dickinson) with a gating strategy to obtain medium expression. Production of cell-derived matrices to monitor cell migration Cell-derived matrices were generated as previously described ( Jacquemet et al., 2013b ). In brief, TIFs were seeded at a density of 50,000 cells/ml in a 24-well plate. When confluent, cells were cultured for a further 10 d, with medium being changed every 48 h to complete medium supplemented with 50 µg/ml ascorbic acid (Sigma-Aldrich) to ensure collagen cross-linking. Mature matrices were then denuded of cells using lysis buffer (PBS containing 20 mM NH 4 OH and 0.5% [vol/vol] Triton X-100). After PBS washes, matrices were incubated with 10 µg/ml DNase I (Roche) at 37°C for 30 min. Matrices were then stored in PBS containing 1% (vol/vol) penicillin/streptomycin at 4°C before use.
Circular invasion assay
A cartoon of the circular invasion assay protocol can be found in Fig. S1. In brief, 5 × 10 4 DCIS.COM or MCF10A cells were plated in one well of a culture-insert 2 well (ibidi) preinserted within a well of a µ-Slide 8 well (ibidi). After 24 h, the culture-insert 2 well was removed, and a gel of GFR Matrigel or fibrillar collagen ( PureCol EZ Gel) was casted. The gels were allowed to polymerize for 30 min at 37°C before normal media was added on top. Cells were left to invade for 3 d before fixation or live imaging (over 9 h).
Proliferation assay
To monitor cell proliferation, cells were plated at low density in a well of a six-well plate and imaged using a live-cell microscopy incubator (IncuCyte ZOOM). Growth rates were calculated using the confluency method within the IncuCyte ZOOM software.
3D spheroid formation assay
To form spheroids in 3D Matrigel, cells were seeded as single cells, in normal growth media, at very low density (∼3,000 cells per well) on GFR Matrigel–coated glass-bottom dishes (coverslip No. 0; MatTek). After 12 h, the medium was replaced by normal growth medium supplemented with 2% (vol/vol) GFR Matrigel. The GFR Matrigel medium was then changed every other day until the completion of the experiment. Zebrafish work Zebrafish maintenance Zebrafish ( Danio rerio ) housing and experimentation was performed under license no. MMM/465/712-93 according to the European Convention for the Protection of Vertebrate Animals used for Experimental and other Scientific Purposes and the Statutes 1076/85 and 62/2006 of The Animal Protection Law in Finland and EU Directive 86/609. Zebrafish were maintained and mated using standard procedures ( Westerfield, 2000 ; Nüsslein-Volhard and Dahm, 2002 ).
Zebrafish intersegmental vessel sprouting assay
Transgenic zebrafish embryos expressing GFP in the endothelium (genotype Tg(fli1:EGFP)y1; roy −/− ; mitfa −/− ; Lawson and Weinstein, 2002 ; White et al., 2008 ) were cultured at 28.5°C in E3 medium (5 mM NaCl, 0.17 mM KCl, 0.33 mM CaCl 2 , 0.33 mM MgSO 4 ) before treatment with 150 ng/ml latrunculin B or 1% DMSO from 25 h postfertilization (hpf) to 29 hpf. For live imaging of the sprouting segmental arteries, the embryos were dechorionated with forceps, anesthetized, and mounted in 0.7% low-melting point agarose on glass-bottom dishes. Agarose was overlaid with E3 medium supplemented with 160 mg/l tricaine (Sigma-Aldrich) and 150 ng/ml latrunculin B (Sigma-Aldrich) or 1% DMSO (Sigma-Aldrich). Imaging was performed at 28.5°C using a 3i SDC microscope equipped with a 63× (NA 1.15) long-distance water-immersion objective. Long-term treatment (up to 17 h) of embryos with low concentration of 150 ng/ml latrunculin B has been previously reported to have no adverse effects on embryo viability ( Phng et al., 2013 ). Consistently, no reduction in embryo viability during our short-term experiments (3-h treatment) was observed.
Zebrafish embryo xenograft assay
Zebrafish embryos of the pigment-free casper strain (roy −/− ; mitfa −/− ) were used in the experiments. One 10-cm plate of MCF10 DCIS.COM cells stably expressing LifeAct mRFP were trypsinized, washed twice in PBS, and resuspended in 30 µl of 2% polyvinylpyrrolidone (Sigma-Aldrich) diluted in PBS for injection. Before injections, 24 hpf embryos were dechorionated, anesthetized (160 mg/l tricaine; Sigma-Aldrich), and immobilized with 0.7% low-melting point agarose (Sigma-Aldrich). Tumor cells were microinjected as a suspension of single cells, using glass microinjection capillaries (TransferTip; Eppendorf), into the pericardial cavity of 24-hpf zebrafish embryos using Celltram vario microinjector (Eppendorf) and Injectman (Eppendorf) micromanipulator mounted on a SteroLumar V12 stereomicroscope (Zeiss). After injection, the embryos were released from the agarose with forceps, washed with E3 medium, and cultured at 34°C in E3 medium. For imaging, the embryos were anesthetized and mounted in low-melting point agarose on glass-bottom dishes.
Microscopy setup
The confocal microscope used was a laser scanning confocal microscope LSM780 (Zeiss) with a 63× (NA 1.2 water) objective controlled by ZEN software (2010). The SDC microscope used was a Marianas spinning disk imaging system with a Yokogawa CSU-W1 scanning unit on an inverted Zeiss Axio Observer Z1 microscope controlled by SlideBook 6 (Intelligent Imaging Innovations, Inc.). Objectives used were a 20× (NA 0.8 air, Plan Apochromat, DIC) objective (Zeiss), a 63× oil (NA 1.4 oil, Plan-Apochromat, M27 with DIC III Prism) objective (Zeiss), a 63× water (NA 1.2 water C Apo, Korr C Apochromat UV-VIS-IR, DIC) objective (Zeiss), a long-working-distance 63× water (NA 1.15 water, LD C-Apochromat, M27) objective or a 100× (NA 1.4 oil, Plan-Apochromat, M27) objective. Images were acquired using either an Orca Flash 4 sCMOS camera (chip size 2,048 × 2,048; Hamamatsu Photonics) or an Evolve 512 EMCCD camera (chip size 512 × 512; Photometrics). The total internal reflection fluorescence (TIRF) microscope used was a Zeiss Laser-TIRF 3 Imaging System equipped with a 100× (NA 1.46 oil, α Plan-Apochromat, DIC) objective. Images were acquired on an EMCCD camera (ImageEM C9100-13; chip size 512 × 512; Hamamatsu Photonics) controlled by Zen software (Zen 2012 Blue Edition Systems; Zeiss). The structured illumination microscope (SIM) used was DeltaVision OMX v4 (GE Healthcare Life Sciences) fitted with a 60× Plan-Apochromat objective lens, 1.42 NA (immersion oil RI of 1.516) used in SIM illumination mode (five phases × three rotations). Emitted light was collected on a front illuminated pco.edge sCMOS (pixel size 6.5 µm, readout speed 95 MHz; PCO AG) controlled by SoftWorx. The TIRF SIM used was an OMX SR (GE Healthcare Life Sciences) fitted with a 60× Plan-Apochromat objective lens, 1.42 NA (immersion oil RI of 1.516) used in 2D-SIM-TIRF illumination mode (three phases × three rotations within the TIRF plane per final image). Emitted light was collected on a front illuminated pco.edge sCMOS (pixel size 6.5 µm, readout speed 286 MHz; PCO AG) controlled by SoftWorx. Sample preparation for light microscopy For TIRF microscopy experiments (related to Fig. 3 B ), cells transiently expressing bovine Myo10-mCherry were plated for 2 h on glass-bottom dishes (MatTek Corporation) precoated with 10 µg/ml bovine plasma FN overnight at 4°C. If not stated otherwise, all samples were fixed in 4% (wt/vol) PFA for 10 min, washed with PBS, and permeabilized with PBS containing 0.5% (vol/vol) Triton X-100 for 3 min. Cells were then washed with PBS, blocked using a solution of 1 M glycine for 30 min, and incubated overnight at 4°C with Alexa Fluor 488 Phalloidin (1/100 in PBS) and, when indicated, with 1 µg/ml (in PBS) DAPI. After washing, samples were stored in PBS in the dark at 4°C before analysis. NK-92 natural killer cells were plated for 20 min on similar dishes precoated with 5 µg/ml anti-CD18 antibody (clone IB4, produced in-house) and 5 µg/ml anti-NKp30 (anti-human CD337, clone PG30.15; BioLegend). If not stated otherwise, all live-cell imaging experiments were performed in normal growth media supplemented with 50 mM Hepes at 37°C and in the presence of 5% CO 2 . FiloQuant and TrackMate analysis of filopodia dynamics To analyze filopodia dynamics in the circular invasion or 3D spheroid assays, filopodia were first detected and analyzed using the automated version of FiloQuant and the “stack analysis” option. In addition, filopodia further than 40 pixels away from the detected cell edge were excluded using the “maximal distance from cell edges” option. The tracking file generated by FiloQuant was then used as an input for TrackMate, an automated tracking software freely available within ImageJ ( Tinevez et al., 2017 ). TrackMate was chosen over other available ImageJ tracking plugins because of its user-friendly interface and high flexibility. In TrackMate, the LoG detector (estimated bob diameter = 0.1 µm; threshold = 10; subpixel localization enabled) and the simple LAP tracker (linking max distance = 1 µm; gap-closing max distance = 1 µm; gap-closing max frame gap = 1) were used.
Manual tracking analyses
The manual tracking analyses (related to Fig. 6, C and D ) were performed in ImageJ using the manual tracking and chemotaxis tool plugins. To measure the speed of the advancing leading edge, three separate points were tracked in each field of view. To measure the migration speed of individual cells within the monolayer, cells at the leading edge and cells behind the edges were tracked. Statistical analysis The Tukey box plots represent the median and the 25th and 75th percentiles (interquartile range); points are displayed as outliers (represented by dots) if 1.5 times above or below the interquartile range (represented by whiskers). Box plots were generated using the online tool BoxPlotR ( http://shiny.chemgrid.org/boxplotr/ ). Statistical analyses were performed when appropriate, and p-values are indicated in the figure legends. Unless otherwise indicated, the Student’s t test was used (unpaired, two tailed, and unequal variance, performed within LibreOffice Calc).
Data availability and software updates
The data supporting the findings of this study are available within the article and from the authors on request. FiloQuant code is available as supplementary files associated with this article. Updates of FiloQuant will be released through the FiloQuant ImageJ update site. Update of the FiloQuant manual will be released on the ImageJ website ( http://imagej.net/FiloQuant ). Online supplemental material Fig. S1 illustrates the principle of circular invasion assay. Fig. S2 shows FiloQuant outputs of the images displayed in Fig. 5 . Fig. S3 shows that overexpression of LifeAct-RFP does not affect filopodia formation or proliferation of DCIS.COM cells. Fig. S4 shows FiloQuant outputs of the images displayed in Fig. 7 . Video 1 displays MCF10A and DCIS.COM cells invading through fibrillar collagen I or GFR Matrigel. Video 2 demonstrates the full FiloQuant analysis of a movie of DCIS.COM cells invading through fibrillar collagen. Video 3 shows the FiloQuant analysis of a movie of MCF10A cells invading through fibrillar collagen. Video 4 shows the FiloQuant analysis of a movie of DCIS.COM cells invading through fibrillar collagen. Video 5 shows the FiloQuant analysis of a movie of MCF10A cells invading through GFR Matrigel. Video 6 shows the FiloQuant analysis of a movie of DCIS.COM cells invading through GFR Matrigel. Video 7 shows the full FiloQuant analysis of a movie monitoring a single DCIS.COM spheroid in 3D GFR Matrigel. Videos 8 and 9 show the actin dynamics of a DCIS.COM spheroid growing in the pericardial cavity of a zebrafish embryo. Software 1 is a version of FiloQuant designed to analyze a single image already opened in ImageJ. Software 2 is a version of FiloQuant designed to analyze images within a specified folder. Software 3 is a version of FiloQuant designed to automatically analyze images within a specified folder by using the same settings for all images (batch analysis). The FiloQuant manual contains detailed instructions on how to install and use FiloQuant as well as troubleshooting advice. Test images are also provided as supplemental files.
Online supplemental material Fig. S1 illustrates the principle of circular invasion assay. Fig. S2 shows FiloQuant outputs of the images displayed in Fig. 5 . Fig. S3 shows that overexpression of LifeAct-RFP does not affect filopodia formation or proliferation of DCIS.COM cells. Fig. S4 shows FiloQuant outputs of the images displayed in Fig. 7 . Video 1 displays MCF10A and DCIS.COM cells invading through fibrillar collagen I or GFR Matrigel. Video 2 demonstrates the full FiloQuant analysis of a movie of DCIS.COM cells invading through fibrillar collagen. Video 3 shows the FiloQuant analysis of a movie of MCF10A cells invading through fibrillar collagen. Video 4 shows the FiloQuant analysis of a movie of DCIS.COM cells invading through fibrillar collagen. Video 5 shows the FiloQuant analysis of a movie of MCF10A cells invading through GFR Matrigel. Video 6 shows the FiloQuant analysis of a movie of DCIS.COM cells invading through GFR Matrigel. Video 7 shows the full FiloQuant analysis of a movie monitoring a single DCIS.COM spheroid in 3D GFR Matrigel. Videos 8 and 9 show the actin dynamics of a DCIS.COM spheroid growing in the pericardial cavity of a zebrafish embryo. Software 1 is a version of FiloQuant designed to analyze a single image already opened in ImageJ. Software 2 is a version of FiloQuant designed to analyze images within a specified folder. Software 3 is a version of FiloQuant designed to automatically analyze images within a specified folder by using the same settings for all images (batch analysis). The FiloQuant manual contains detailed instructions on how to install and use FiloQuant as well as troubleshooting advice. Test images are also provided as supplemental files.
Supplementary Material Supplemental Materials (PDF) Video 1 Video 2 Video 3 Video 4 Video 5 Video 6 Video 7 Video 8 Video 9 Software, FiloQuant Manual, and Test Images (ZIP)
📊 Figures
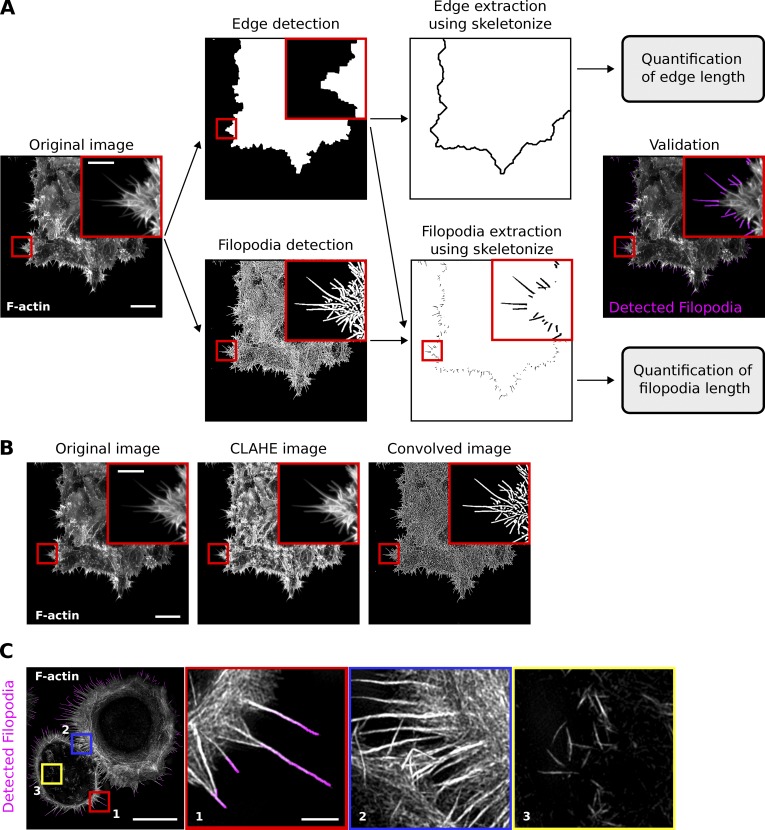
Figure 1.
FiloQuant, an ImageJ tool to rapidly quantify filopodia length and density. (A) Workflow depicting FiloQuant analysis of filopodia density and length. Representative images obtained at the different s...
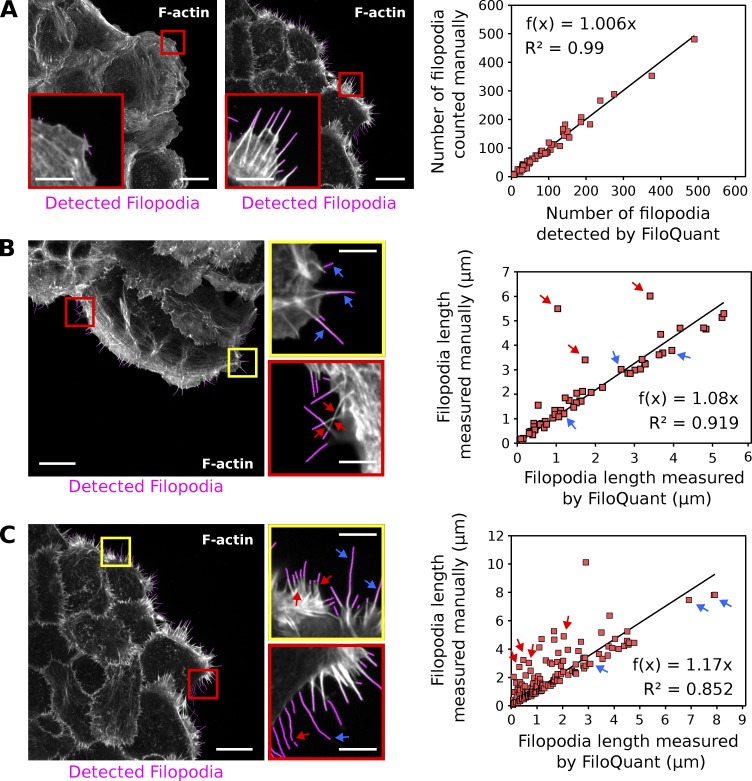
Figure 2.
FiloQuant readouts in comparison to manual analyses. (A) FiloQuant readouts of filopodia number were compared with manual analyses (only the filopodia at the colony edge were considered) in a total of...
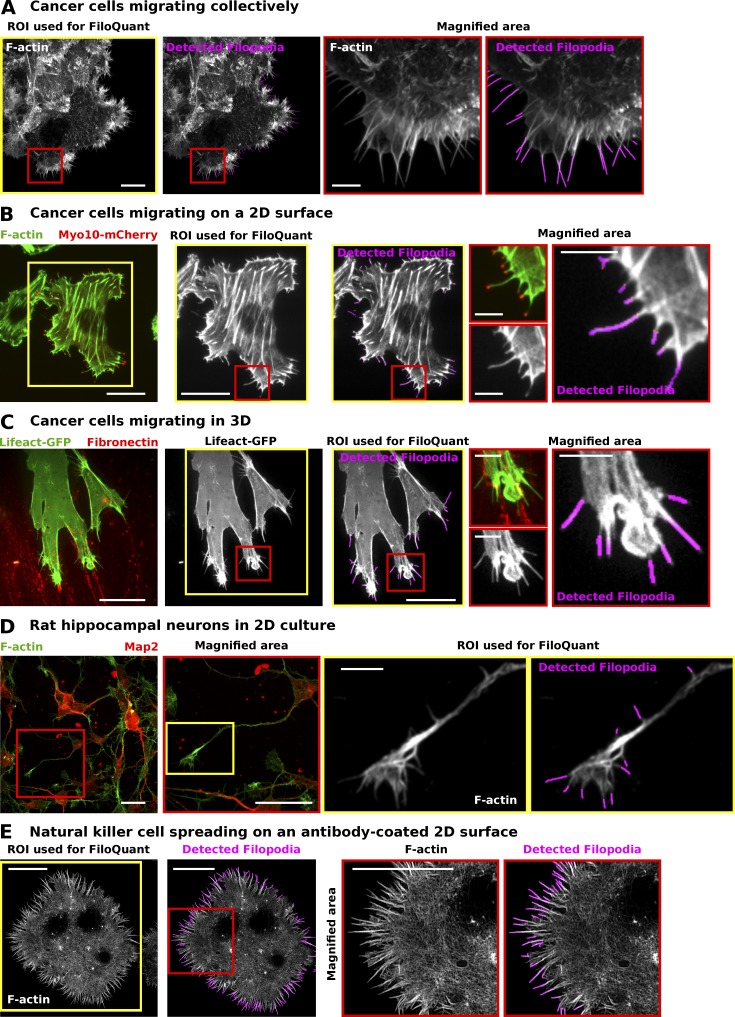
Figure 3.
FiloQuant can be used to detect filopodia under different cellular contexts and imaging modalities. (Au2013E) FiloQuant (single image analysis version; software 1) was used to detect filopodia in imag...
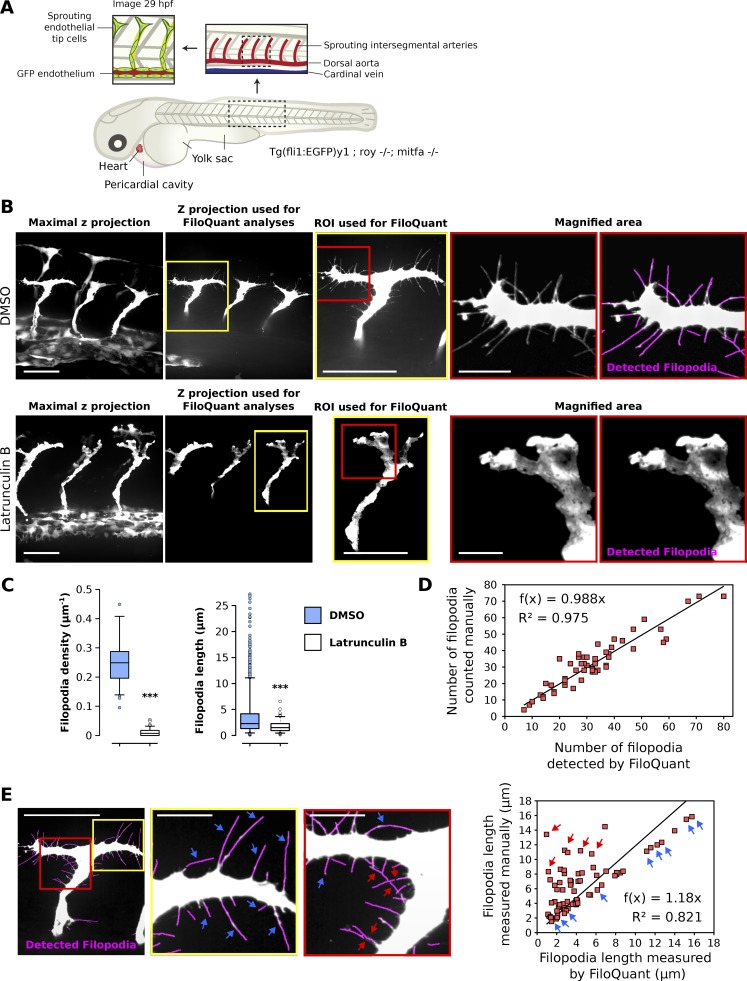
Figure 4.
Filopodia can be detected and quantified in sprouting endothelia in the developing zebrafish embryo using intravital imaging and FiloQuant. (A) Simplified cartoon of a zebrafish embryo. Insets represe...
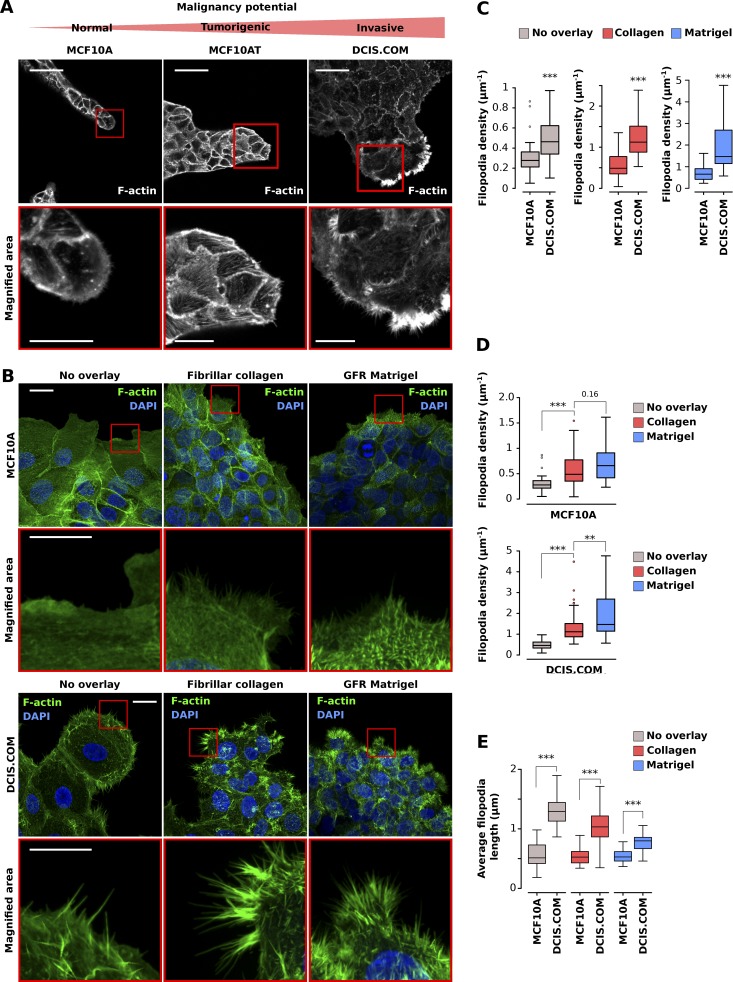
Figure 5.
Filopodia density and length in circular invasion assays correlate with reported degree of cancer cell malignancy. (A) MCF10A, MCF10AT, and DCIS.COM cells were left to migrate into GFR Matrigel for 14...
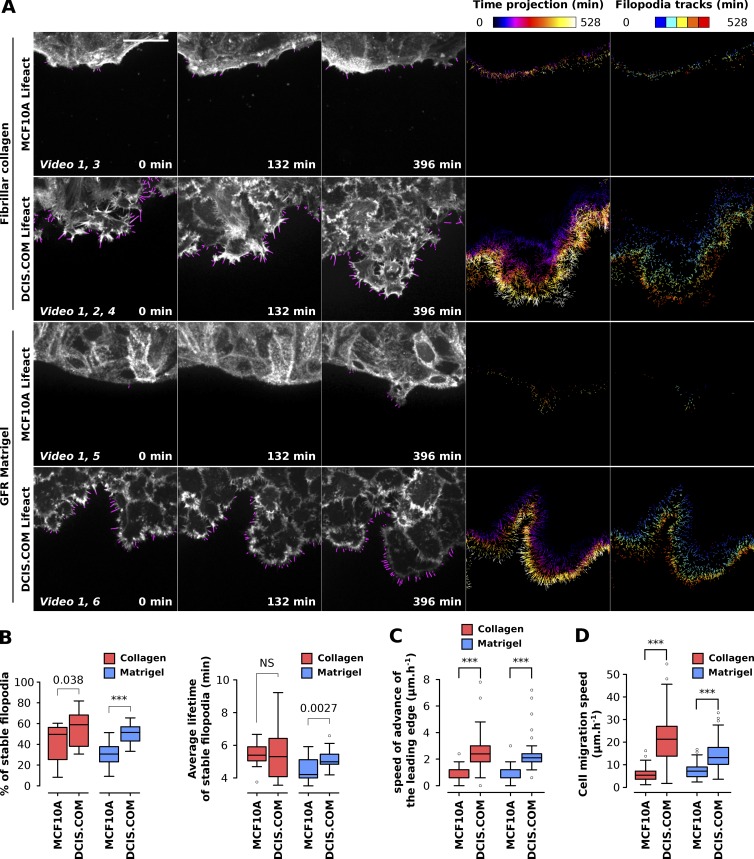
Figure 6.
Filopodia dynamics can be analyzed using FiloQuant in circular invasion assays. (A and B) MCF10A and DCIS.COM cells stably expressing LifeAct-mRFP were plated in circular invasion assays and left to i...
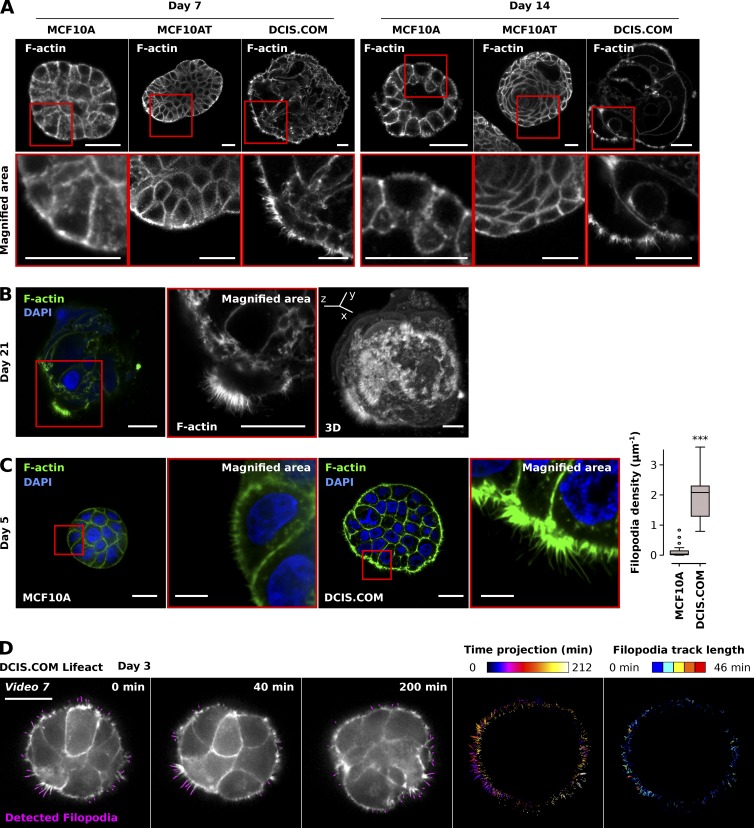
Figure 7.
Analysis of filopodia density in 3D tumor spheroids using FiloQuant. (A) MCF10A, MCF10AT, and DCIS.COM cells were seeded as single cells on GFR Matrigel and left to form spheroids over 7 or 14 d, fixe...
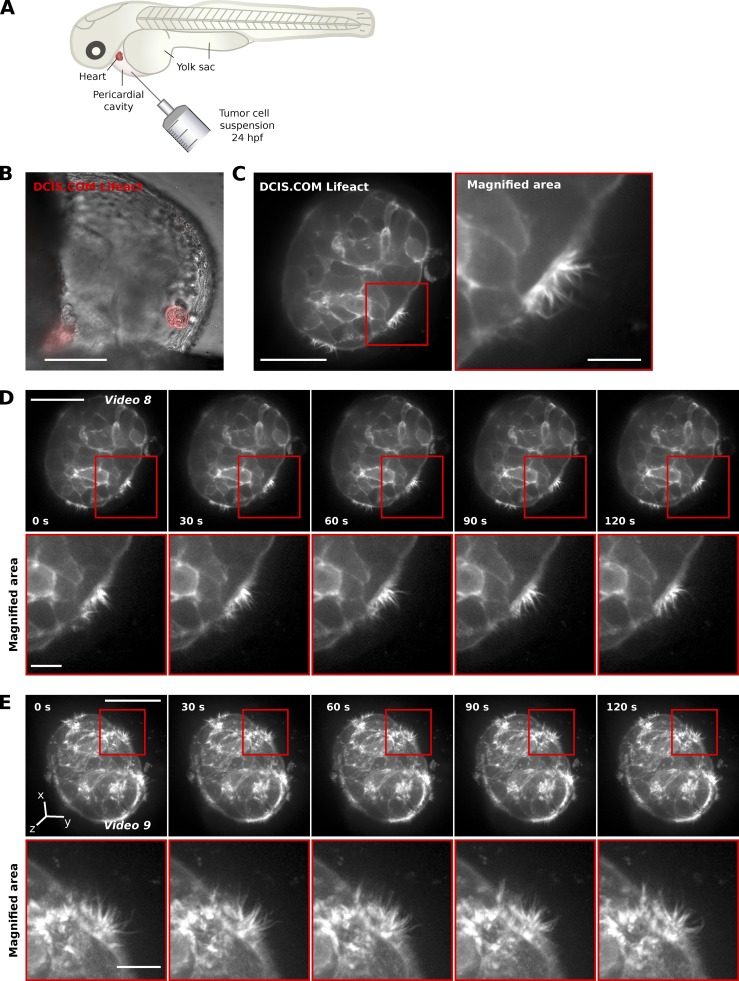
Figure 8.
Tumor spheroids generate filopodia in vivo. (Au2013C) DCIS.COM LifeAct cells were injected as single cells into the pericardial cavity of zebrafish embryos (A and B) and imaged live using an SDC micro...
Figure images are served from the NIH/NLM PubMed Central Open Access Subset or Europe PMC; copyright remains with the publishers and authors.
💬 Discussion
0 commentsNo comments yet. Be the first to start a discussion!
Leave a Comment