Abstract
AbstractMany biological questions require fluorescence microscopy with a resolution beyond the diffraction limit of light. Super-resolution methods such as Structured Illumination Microscopy (SIM), STimulated Emission Depletion (STED) microscopy and Single Molecule Localisation Microscopy (SMLM) enable an increase in image resolution beyond the classical diffraction-limit. Here, we compare the individual strengths and weaknesses of each technique by imaging a variety of different subcellular structures in fixed cells. We chose examples ranging from well separated vesicles to densely packed three dimensional filaments. We used quantitative and correlative analyses to assess the performance of SIM, STED and SMLM with the aim of establishing a rough guideline regarding the suitability for typical applications and to highlight pitfalls associated with the different techniques.
🔬 Techniques
🔭 Microscopes
🧬 Organisms
💻 Software
✨ Fluorophores
🧪 Sample Preparation
🔬 Cell Lines
🏭 Microscope Brands
🧪 Reagent Suppliers
📷 Detectors
💻 Software Details
🏛️ Research Organizations (ROR)
Affiliated research institutions:
📋 Methods
Preparation of cells for immunostaining
Drosophila macrophages were prepared from third instar larvae according to 50 . They were allowed to settle in Schneider’s insect medium (Sigma, S0146) on glass coverslips for two h at 25 °C. We used Marienfeld high precision coverslips no. 1.5H (UK distributor Cellpath) for all experiments. Cells were pre-extracted for 5 s in PBS, 0.1% NP40 (Igepal Ca-630, Sigma-Aldrich, I3021) before fixation in 1% methanol free paraformaldehyde (Polysciences, 18814) in PBS for 50 min. They were then permeabilised for 10 min in 0.1% Triton X-100 (Sigma-Aldrich, X100) in PBS and washed in PBS. Drosophila primary spermatocytes were prepared from testes according to 51 52 . Briefly, testes were fixed in 3.7% methanol containing formaldehyde (VWR, 20909.290) for 30 min, treated with 45% acetic acid for 45 seconds and 60% acetic acid for 3 min, snap frozen in liquid nitrogen and post fixed in in ethanol for 15 min. They were then permeabilised and washed as above. The Asl antibody signal obtained after this fixation was similar to Asl-GFP imaged in vivo using SIM ( Supplementary Fig. S6 ). COS7 cells were grown for 24 to 48 h on glass coverslips to 80% confluence in high glucose Dulbecco’s modified Eagle’s medium (DMEM, Life Technologies, 31966-21) supplemented with 10% (v/v) FBS (Life Technologies, 10500). They were fixed in 3% methanol free paraformaldehyde in PBS for 15 min at 37 °C and then permeabilised for 7 min in 0.1% Triton X-100 in PBS before washes in PBS. Immunostaining Drosophila macrophages and COS7 cells were blocked in PBS, 0.1% Tween 20 (Sigma, P9416), 3% BSA (Sigma, A3059) for 30 min. Primary and secondary antibody incubation in blocking solution was carried out for one hour with wash steps in PBS, 0.1% Tween 20 after each incubation. The following primary antibodies were used: monoclonal mouse anti α-tubulin 1:1000 (Sigma-Aldrich T6199, clone DM1A), polyclonal sheep anti human TGN46 1:1000 (AbD Serotec, AHP500G), monoclonal mouse anti human GM130 1:1000 (BD Biosciences, 610823), monoclonal mouse anti human Sec31A 1:1000 (BD Biosciences, 612350). Actin was detected with Phalloidin conjugated to Alexa Fluor 488 (Life Technologies, A12379) at a final concentration of 0.5 Units per 200 μL or to Alexa 647 (New England Biolabs, 8940S) at a final concentration of 4 Units per 200 μL. Phalloidin incubation was for 45 min for SMLM and for one hour for all other experiments in blocking solution. Drosophila Asterless was detected using guinea pig anti Asl 1:1000 52 . Secondary antibodies used at concentrations of 1:500 or 1:800 were as follows: Donkey anti mouse or donkey anti sheep conjugated to Alexa Fluor 488 or Alexa 647 (Life Technologies, A21202, A11015, A31571, A21448), goat anti-guinea pig conjugated to Alexa Fluor 488 (Life Technologies, A11073). For SIM, donkey anti mouse and donkey anti sheep conjugated to Alexa Fluor 594 and Alexa Fluor 488 respectively (Life Technologies, A21203, A11015) was used for double-labelling experiments. For STED, goat anti mouse and donkey anti sheep conjugated to tetramethylrhodamine (TMR) and Alexa Fluor 488 (Life Technologies, T2762, A11015) respectively was used. For SMLM double-labelling experiments, donkey anti sheep and goat anti mouse conjugated to Alexa Fluor 647 and Alexa Fluor 532 (Life Technologies, A21448, A11002) respectively was used. For SIM and STED experiments COS7 cells and Drosophila macrophages were embedded in Prolong Gold (Life Technologies, P36930 ) and the coverslips sealed after 16 to 20 h. Drosophila testes preparations were embedded in Vectashield (Vector Laboratories, H-1000) for SIM imaging and in Mowiol 4–88 (Polysciences, 17951) supplemented with 2.5% (v/v) DABCO (Sigma-Aldrich, 290734) for STED and SMLM experiments. For SMLM experiments requiring switching buffer coverslips were either imaged directly or kept in PBS overnight and imaged the following day. Microscopy For SIM, cells were imaged with a 60x, NA 1.42 oil objective on a Deltavision OMX V3 Blaze (GE) equipped with 488 nm and 592 nm lasers. Spherical aberration was minimised by choosing an immersion oil with a refractive index giving symmetrical point spread functions and image stacks of several μm thickness were taken with 0.125 μm z-steps and 15 images (three angles and five phases per angle) per z-section and a 3D structured illumination with stripe separation of 213 nm and 238 nm at 488 nm and 594 nm respectively. It should be noted that the OMX microscope used in this paper does not allow the collection of 2D SIM images. Image stacks were reconstructed in Deltavision softWoRx 6.1.1 software with a Wiener filter of 0.002 using wavelength specific experimentally determined OTF functions as described in 6 . This leads to a halving of the pixel size and a doubling of the X and Y direction pixel number (i.e. four times as many pixels), but no change in Z-steps in the image stacks. As the OMX system uses separate cameras for each colour, image alignment is critical. For two-colour experiments, reference z-stacks of 200 nm TetraSpeck beads (Life Technologies, T7280) were aligned with custom rigid body alignment routines correcting for x, y and z shifts, magnification and rotation differences between channels. The transformations were then applied to align the two-channel images. For STED, cells were imaged with a 100x, NA 1.4 oil objective on a Leica SP8 gated STED microscope. Alexa Fluor 488 labelled probes were excited with the 488 nm wavelength of a pulsed white light (WL) laser (80 MHz) and depleted with a CW 592 nm STED laser with a typical maximum power of 260–300 mW at the back aperture of the objective (corresponding to ~150 MW/cm 2 in the focal plane), while TMR labelled probes were excited with the 561 nm wavelength of a WL laser and depleted with a CW 660 nm STED laser with a typical maximum power of 240–280 mW. All images were acquired in 2D STED mode, i.e. with only lateral resolution improvement. Structures in Figs 1 , 2 , 3 , 4 , 5 were imaged at settings optimized for a maximum gain in lateral resolution. This corresponded to full depletion laser on an internal Leica GaAsP HyD hybrid detector with a time gate of 1.5 ≤ t g ≤ 6.5 ns. An exception to the above is the data for Supplementary Fig. S3 , which was imaged as a function of STED laser power but with the same time gate. The two colour STED data in Fig. 6 were imaged at 50% of maximum power both for TGN46 and GM130 but with equivalent time gates. As shown in Supplementary Fig. S3 , the resolution at this setting is about 80 nm. Deconvolution of STED data was carried out using the STED module in Huygens Professional Deconvolution software (version 14.10; Scientific Volume Imaging). This software contains a theoretical estimation of the STED PSF that is based on values that are calculated from the metadata of the acquired image. For the deconvolved images presented here we have used the calculated Huygens default deconvolution settings that were estimated from the metadata except that we used a STED immunity fraction of 5%. A simple alternative to deconvolution solely for the purpose of minimizing noise is to apply a Gaussian 2D kernel with a Gaussian width, σ, to the image data. In our case, we have used the Gaussian Blur filtering function in the Fiji compilation of ImageJ 1.47N (ImageJ version: 2.0.0-rc-19/1.49m, http://imagej.net ) 53 with a Gaussian width of 1 or 2 pixels. SMLM imaging was performed with three different setups. Using single colour SMLM with a standard mounting medium and a single laser wavelength 23 46 , centrioles were imaged on a Deltavision OMX V2 microscope (Applied Precision) equipped with a 100x, NA 1.4 oil objective (UPlanSApo, Olympus), a 488 nm laser and a customized SMLM lightpath with approx. 30 kW/cm 2 laser intensity as detailed in 54 . 4000 images were taken in wide-field illumination with an integration time of 50 ms. SMLM imaging with switching buffers to enhance single molecule photo-switching 55 was used for all other single colour experiments and performed on a home-built wide-field microscope equipped with a 100x, NA 1.4 oil objective, a TIRF lens and a 640 nm laser with 1.5–2 kW/cm 2 laser intensity (for details see Supplementary data STORM setup). For the detection of microtubules, vesicles and trans Golgi, cells were imaged with TIRF illumination to reduce out of focus fluorescence, in the following switching buffer: 27 U/mL glucose oxidase (Sigma, G2133), 402 U/mL catalase (Sigma C100), 10% (w/v) glucose, 100 mM MEA (2-mercaptoethlyamine hydrochloride, Alfa Aesar, A14377) in PBS pH 7.4. 15,000 images were taken with an integration time of 20 ms. Actin was imaged using the same switching buffer as above but with twice the enzyme concentration and at pH 7.7. 30,000 images were taken with an integration time of 30 ms. For two-colour SMLM experiments using switching buffer (10 mM MEA in PBS, pH 7.8), cells were imaged on a Leica GSD microscope equipped with a 160x, NA 1.43 oil objective, a 500 mW 532 nm laser, a 500 mW 642 nm laser and a 30 mW 405 nm laser. Alexa Fluor 647 was imaged first with wide-field illumination and an integration time of 20 ms and Alexa Fluor 532 second, also with an integration time of 20 ms and backpumping into the on-state using the 405 nm laser. 15,000 images per channel were taken with a field of view of 180×180 pixels and 100 nm pixel size. RapidSTORM 56 57 was used to reconstruct single molecule localisations of actin, vesicles, the trans-Golgi network and the two-colour data. For the position determination of the single fluorescent molecules in microtubule and centriole experiments we used fastSPDM 58 , which was adapted to the hardware configuration of the microscope setup. Drift of the microscope stage was corrected based on the SMLM position data. Super-resolution images were generated from the SMLM position data based on nearest neighbour distances to also consider the Nyquist limited resolution 54 59 . We compare these two analysis routines on the same raw data in Supplementary Fig. S5 to demonstrate how different analysis routines can produce different artefacts in the reconstructed data.
Show full methods section
Preparation of cells for immunostaining
Drosophila macrophages were prepared from third instar larvae according to 50 . They were allowed to settle in Schneider’s insect medium (Sigma, S0146) on glass coverslips for two h at 25 °C. We used Marienfeld high precision coverslips no. 1.5H (UK distributor Cellpath) for all experiments. Cells were pre-extracted for 5 s in PBS, 0.1% NP40 (Igepal Ca-630, Sigma-Aldrich, I3021) before fixation in 1% methanol free paraformaldehyde (Polysciences, 18814) in PBS for 50 min. They were then permeabilised for 10 min in 0.1% Triton X-100 (Sigma-Aldrich, X100) in PBS and washed in PBS. Drosophila primary spermatocytes were prepared from testes according to 51 52 . Briefly, testes were fixed in 3.7% methanol containing formaldehyde (VWR, 20909.290) for 30 min, treated with 45% acetic acid for 45 seconds and 60% acetic acid for 3 min, snap frozen in liquid nitrogen and post fixed in in ethanol for 15 min. They were then permeabilised and washed as above. The Asl antibody signal obtained after this fixation was similar to Asl-GFP imaged in vivo using SIM ( Supplementary Fig. S6 ). COS7 cells were grown for 24 to 48 h on glass coverslips to 80% confluence in high glucose Dulbecco’s modified Eagle’s medium (DMEM, Life Technologies, 31966-21) supplemented with 10% (v/v) FBS (Life Technologies, 10500). They were fixed in 3% methanol free paraformaldehyde in PBS for 15 min at 37 °C and then permeabilised for 7 min in 0.1% Triton X-100 in PBS before washes in PBS. Immunostaining Drosophila macrophages and COS7 cells were blocked in PBS, 0.1% Tween 20 (Sigma, P9416), 3% BSA (Sigma, A3059) for 30 min. Primary and secondary antibody incubation in blocking solution was carried out for one hour with wash steps in PBS, 0.1% Tween 20 after each incubation. The following primary antibodies were used: monoclonal mouse anti α-tubulin 1:1000 (Sigma-Aldrich T6199, clone DM1A), polyclonal sheep anti human TGN46 1:1000 (AbD Serotec, AHP500G), monoclonal mouse anti human GM130 1:1000 (BD Biosciences, 610823), monoclonal mouse anti human Sec31A 1:1000 (BD Biosciences, 612350). Actin was detected with Phalloidin conjugated to Alexa Fluor 488 (Life Technologies, A12379) at a final concentration of 0.5 Units per 200 μL or to Alexa 647 (New England Biolabs, 8940S) at a final concentration of 4 Units per 200 μL. Phalloidin incubation was for 45 min for SMLM and for one hour for all other experiments in blocking solution. Drosophila Asterless was detected using guinea pig anti Asl 1:1000 52 . Secondary antibodies used at concentrations of 1:500 or 1:800 were as follows: Donkey anti mouse or donkey anti sheep conjugated to Alexa Fluor 488 or Alexa 647 (Life Technologies, A21202, A11015, A31571, A21448), goat anti-guinea pig conjugated to Alexa Fluor 488 (Life Technologies, A11073). For SIM, donkey anti mouse and donkey anti sheep conjugated to Alexa Fluor 594 and Alexa Fluor 488 respectively (Life Technologies, A21203, A11015) was used for double-labelling experiments. For STED, goat anti mouse and donkey anti sheep conjugated to tetramethylrhodamine (TMR) and Alexa Fluor 488 (Life Technologies, T2762, A11015) respectively was used. For SMLM double-labelling experiments, donkey anti sheep and goat anti mouse conjugated to Alexa Fluor 647 and Alexa Fluor 532 (Life Technologies, A21448, A11002) respectively was used. For SIM and STED experiments COS7 cells and Drosophila macrophages were embedded in Prolong Gold (Life Technologies, P36930 ) and the coverslips sealed after 16 to 20 h. Drosophila testes preparations were embedded in Vectashield (Vector Laboratories, H-1000) for SIM imaging and in Mowiol 4–88 (Polysciences, 17951) supplemented with 2.5% (v/v) DABCO (Sigma-Aldrich, 290734) for STED and SMLM experiments. For SMLM experiments requiring switching buffer coverslips were either imaged directly or kept in PBS overnight and imaged the following day. Microscopy For SIM, cells were imaged with a 60x, NA 1.42 oil objective on a Deltavision OMX V3 Blaze (GE) equipped with 488 nm and 592 nm lasers. Spherical aberration was minimised by choosing an immersion oil with a refractive index giving symmetrical point spread functions and image stacks of several μm thickness were taken with 0.125 μm z-steps and 15 images (three angles and five phases per angle) per z-section and a 3D structured illumination with stripe separation of 213 nm and 238 nm at 488 nm and 594 nm respectively. It should be noted that the OMX microscope used in this paper does not allow the collection of 2D SIM images. Image stacks were reconstructed in Deltavision softWoRx 6.1.1 software with a Wiener filter of 0.002 using wavelength specific experimentally determined OTF functions as described in 6 . This leads to a halving of the pixel size and a doubling of the X and Y direction pixel number (i.e. four times as many pixels), but no change in Z-steps in the image stacks. As the OMX system uses separate cameras for each colour, image alignment is critical. For two-colour experiments, reference z-stacks of 200 nm TetraSpeck beads (Life Technologies, T7280) were aligned with custom rigid body alignment routines correcting for x, y and z shifts, magnification and rotation differences between channels. The transformations were then applied to align the two-channel images. For STED, cells were imaged with a 100x, NA 1.4 oil objective on a Leica SP8 gated STED microscope. Alexa Fluor 488 labelled probes were excited with the 488 nm wavelength of a pulsed white light (WL) laser (80 MHz) and depleted with a CW 592 nm STED laser with a typical maximum power of 260–300 mW at the back aperture of the objective (corresponding to ~150 MW/cm 2 in the focal plane), while TMR labelled probes were excited with the 561 nm wavelength of a WL laser and depleted with a CW 660 nm STED laser with a typical maximum power of 240–280 mW. All images were acquired in 2D STED mode, i.e. with only lateral resolution improvement. Structures in Figs 1 , 2 , 3 , 4 , 5 were imaged at settings optimized for a maximum gain in lateral resolution. This corresponded to full depletion laser on an internal Leica GaAsP HyD hybrid detector with a time gate of 1.5 ≤ t g ≤ 6.5 ns. An exception to the above is the data for Supplementary Fig. S3 , which was imaged as a function of STED laser power but with the same time gate. The two colour STED data in Fig. 6 were imaged at 50% of maximum power both for TGN46 and GM130 but with equivalent time gates. As shown in Supplementary Fig. S3 , the resolution at this setting is about 80 nm. Deconvolution of STED data was carried out using the STED module in Huygens Professional Deconvolution software (version 14.10; Scientific Volume Imaging). This software contains a theoretical estimation of the STED PSF that is based on values that are calculated from the metadata of the acquired image. For the deconvolved images presented here we have used the calculated Huygens default deconvolution settings that were estimated from the metadata except that we used a STED immunity fraction of 5%. A simple alternative to deconvolution solely for the purpose of minimizing noise is to apply a Gaussian 2D kernel with a Gaussian width, σ, to the image data. In our case, we have used the Gaussian Blur filtering function in the Fiji compilation of ImageJ 1.47N (ImageJ version: 2.0.0-rc-19/1.49m, http://imagej.net ) 53 with a Gaussian width of 1 or 2 pixels. SMLM imaging was performed with three different setups. Using single colour SMLM with a standard mounting medium and a single laser wavelength 23 46 , centrioles were imaged on a Deltavision OMX V2 microscope (Applied Precision) equipped with a 100x, NA 1.4 oil objective (UPlanSApo, Olympus), a 488 nm laser and a customized SMLM lightpath with approx. 30 kW/cm 2 laser intensity as detailed in 54 . 4000 images were taken in wide-field illumination with an integration time of 50 ms. SMLM imaging with switching buffers to enhance single molecule photo-switching 55 was used for all other single colour experiments and performed on a home-built wide-field microscope equipped with a 100x, NA 1.4 oil objective, a TIRF lens and a 640 nm laser with 1.5–2 kW/cm 2 laser intensity (for details see Supplementary data STORM setup). For the detection of microtubules, vesicles and trans Golgi, cells were imaged with TIRF illumination to reduce out of focus fluorescence, in the following switching buffer: 27 U/mL glucose oxidase (Sigma, G2133), 402 U/mL catalase (Sigma C100), 10% (w/v) glucose, 100 mM MEA (2-mercaptoethlyamine hydrochloride, Alfa Aesar, A14377) in PBS pH 7.4. 15,000 images were taken with an integration time of 20 ms. Actin was imaged using the same switching buffer as above but with twice the enzyme concentration and at pH 7.7. 30,000 images were taken with an integration time of 30 ms. For two-colour SMLM experiments using switching buffer (10 mM MEA in PBS, pH 7.8), cells were imaged on a Leica GSD microscope equipped with a 160x, NA 1.43 oil objective, a 500 mW 532 nm laser, a 500 mW 642 nm laser and a 30 mW 405 nm laser. Alexa Fluor 647 was imaged first with wide-field illumination and an integration time of 20 ms and Alexa Fluor 532 second, also with an integration time of 20 ms and backpumping into the on-state using the 405 nm laser. 15,000 images per channel were taken with a field of view of 180×180 pixels and 100 nm pixel size. RapidSTORM 56 57 was used to reconstruct single molecule localisations of actin, vesicles, the trans-Golgi network and the two-colour data. For the position determination of the single fluorescent molecules in microtubule and centriole experiments we used fastSPDM 58 , which was adapted to the hardware configuration of the microscope setup. Drift of the microscope stage was corrected based on the SMLM position data. Super-resolution images were generated from the SMLM position data based on nearest neighbour distances to also consider the Nyquist limited resolution 54 59 . We compare these two analysis routines on the same raw data in Supplementary Fig. S5 to demonstrate how different analysis routines can produce different artefacts in the reconstructed data.
Size measurements
For every super-resolution technique we plotted the profile of ten microtubules each from five cells and fitted a Gaussian curve using Fiji open source image processing software (ImageJ version: 2.0.0-rc-19/1.49m, http://imagej.net ). For the profile a line width of ca. 165 nm was chosen in order to cover a minimum width of four pixels in SIM images and more in STED and SMLM. Microtubule widths in SIM stacks were measured in the z-section where the microtubule fluoresced most strongly. The full width at half maximum (FWHM) was calculated with the following formula where σ is the standard deviation of the Gaussian: For centriole measurements, intensity line profiles with a line width of ca. 165 nm, were drawn near the end of the centriole barrel and across both centriole barrel walls using Fiji as above. A sum of two Gaussian curves was then fitted to the line profiles in Mathematica v 9.01 (Wolfram). The distance between the walls of each centriole was determined from the distance between the centre of each Gaussian curve and FWHM values were calculated separately from the standard deviations, σ1 and σ2, for each centriole wall as described for the microtubule measurements. Box and whisker plots were generated in Prism v6 (GraphPad). The box in this case extends from the 25 th to the 75 th percentile of the data and the median value is marked with a line. The whiskers extend from the smallest value to the largest value measured. Statistical significance of all measurements was also evaluated in Prism by using a two-tailed Mann-Whitney test of repeated measures. Statistical significance was considered for P values
📊 Figures
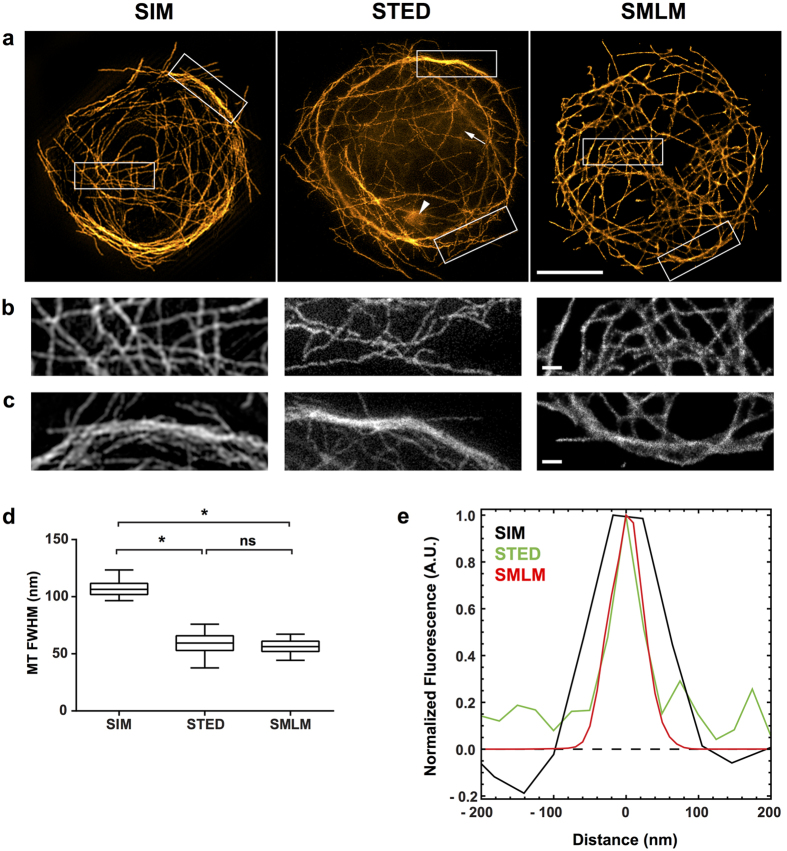
Figure 1
Microtubules in Drosophila macrophages.
Microtubules were detected with primary and secondary antibodies, the latter coupled to Alexa Fluor 488 for SIM and STED and Alexa Fluor 647 for SMLM. 100% available depletion laser power was used for...
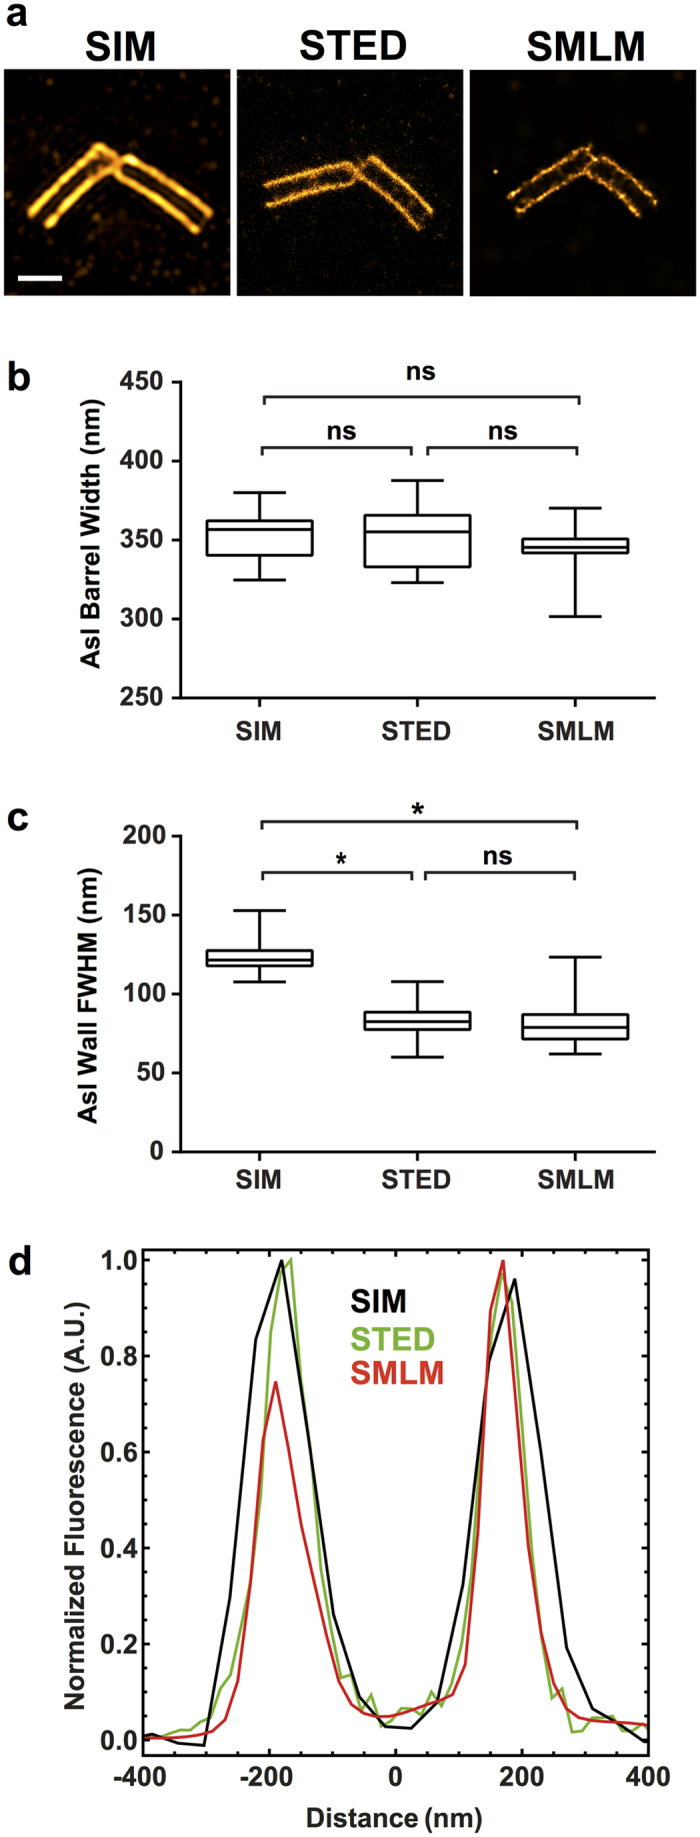
Figure 2
Centrioles in Drosophila primary spermatocytes.
Asterless (Asl) localisation in an orthogonal centriole pair was detected with primary and secondary antibodies, the latter coupled to Alexa Fluor 488 for SIM, STED and SMLM. 100% available depletion ...
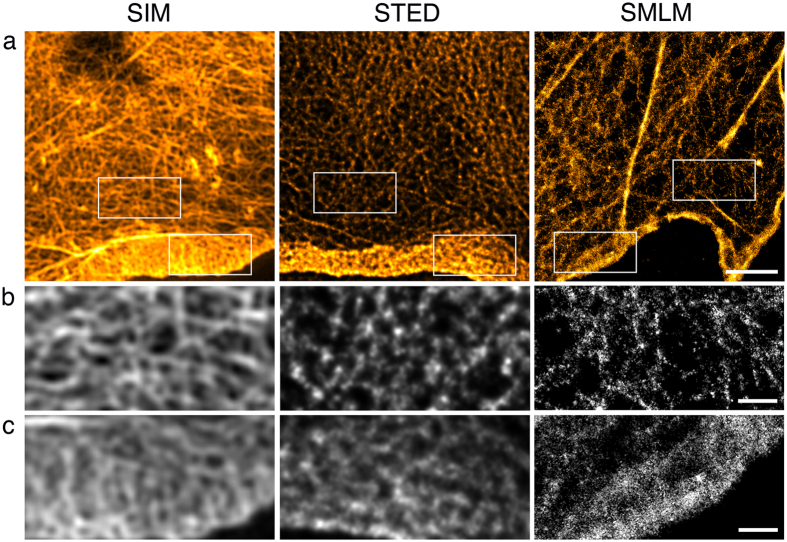
Figure 3
Actin in COS7 cells.
Actin was detected with phalloidin coupled to Alexa Fluor 488 for SIM and STED and Alexa Fluor 647 for SMLM. 100% available depletion laser power was used for STED. ( a ) Single optical section throug...
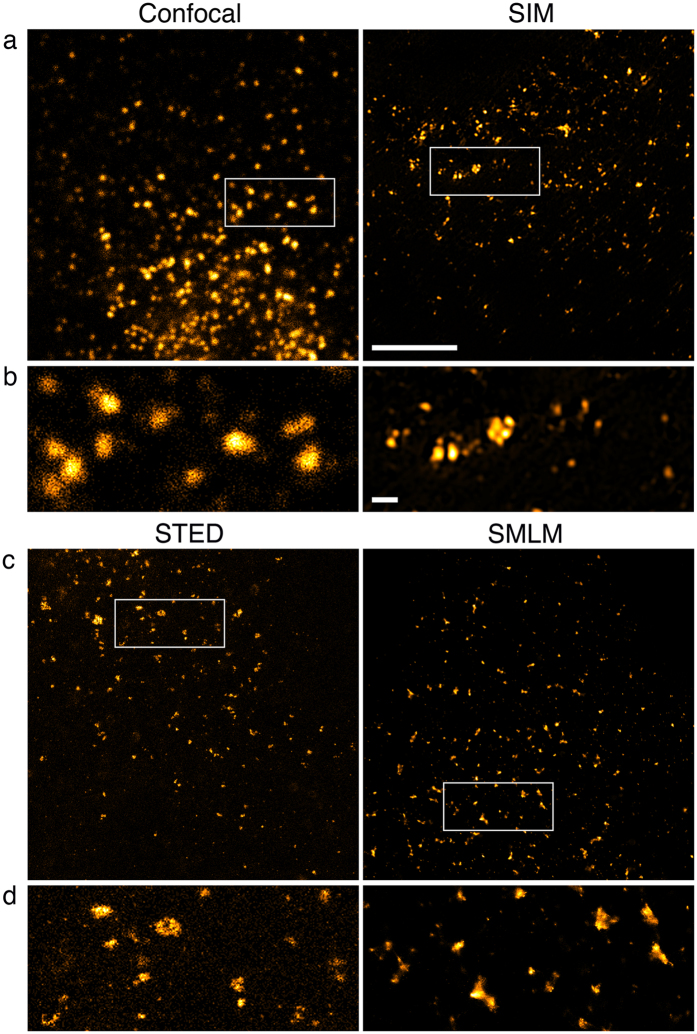
Figure 4
Transport vesicles in COS7 cells.
Sec31A was detected with primary and secondary antibodies, the latter coupled to Alexa Fluor 488 for confocal imaging, SIM and STED and Alexa Fluor 647 for SMLM. 100% available depletion laser power w...
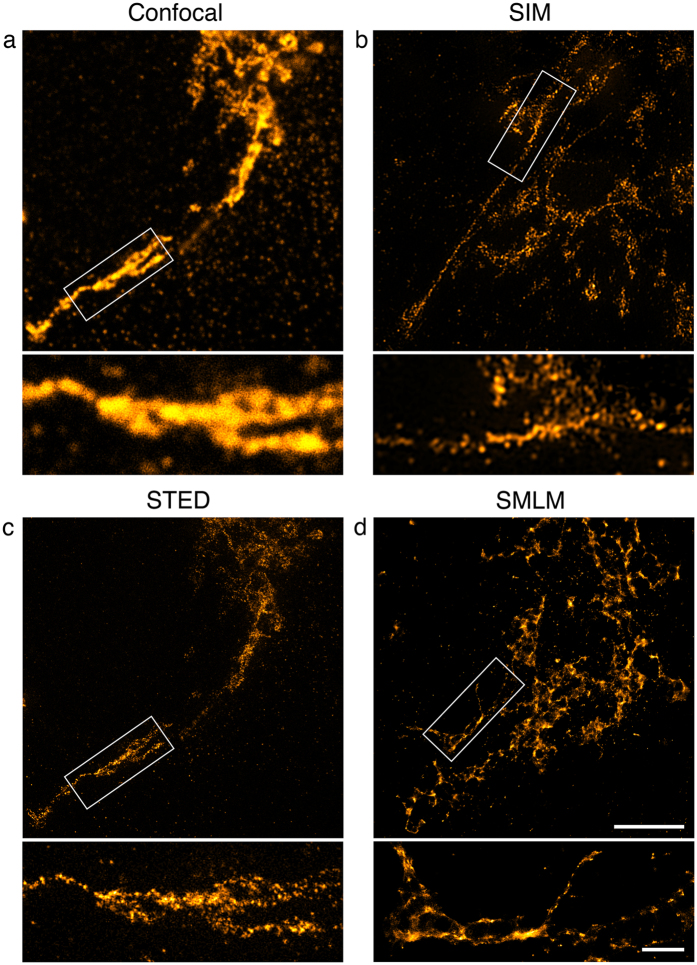
Figure 5
Trans-Golgi network in COS7 cells.
TGN46 distribution was detected with primary and secondary antibodies, the latter coupled to Alexa Fluor 488 for confocal imaging ( a ), SIM ( b ) and STED ( c ) and Alexa Fluor 647 for SMLM ( d ). 10...
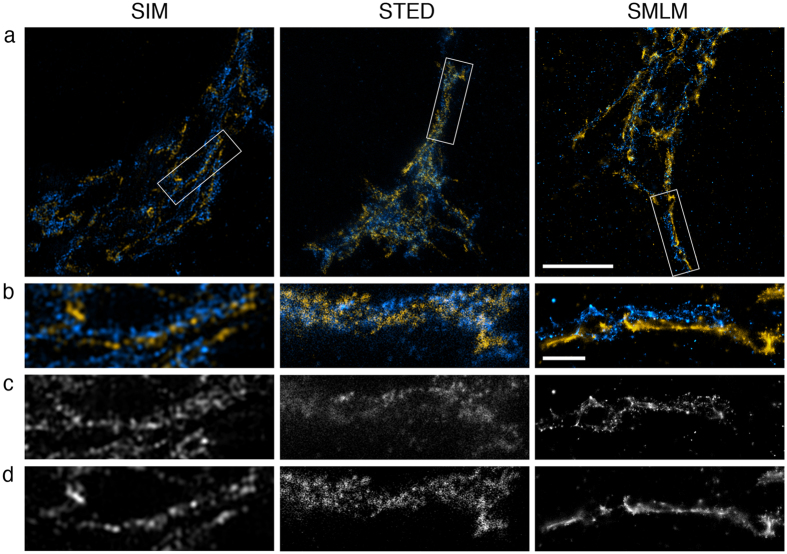
Figure 6
Trans- and cis-Golgi in COS7 cells.
TGN46 distribution (blue) was detected with primary and secondary antibodies, the latter coupled to Alexa Fluor 488 for SIM and STED and Alexa Fluor 647 for SMLM. GM130 distribution (yellow) was detec...
Figure images are served from the NIH/NLM PubMed Central Open Access Subset or Europe PMC; copyright remains with the publishers and authors.
💬 Discussion
0 commentsNo comments yet. Be the first to start a discussion!
Leave a Comment