Abstract
The ESCRT machinery mediates reverse membrane scission. By quantitative fluorescence lattice light-sheet microscopy, we have shown that ESCRT-III subunits polymerize rapidly on yeast endosomes, together with the recruitment of at least two Vps4 hexamers. During their 3-45 s lifetimes, the ESCRT-III assemblies accumulated 75-200 Snf7 and 15-50 Vps24 molecules. Productive budding events required at least two additional Vps4 hexamers. Membrane budding was associated with continuous, stochastic exchange of Vps4 and ESCRT-III components, rather than steady growth of fixed assemblies, and depended on Vps4 ATPase activity. An all-or-none step led to final release of ESCRT-III and Vps4. Tomographic electron microscopy demonstrated that acute disruption of Vps4 recruitment stalled membrane budding. We propose a model in which multiple Vps4 hexamers (four or more) draw together several ESCRT-III filaments. This process induces cargo crowding and inward membrane buckling, followed by constriction of the nascent bud neck and ultimately ILV generation by vesicle fission.
🔬 Techniques
🔭 Microscopes
🧬 Organisms
💻 Software
✨ Fluorophores
🧪 Sample Preparation
🔬 Cell Lines
🏭 Microscope Brands
🧪 Reagent Suppliers
📷 Detectors
💻 Software Details
📋 Protocols
💻 Code & Software
💾 Data Repositories
🏷️ Research Resource Identifiers (RRIDs)
Verified research resources used in this paper:
🏛️ Research Organizations (ROR)
Affiliated research institutions:
📋 Methods
Antibodies and reagents
The following antibodies were used for western blot analysis with the stated dilutions: rabbit polyclonal antiserum (1:200) specific for Vps2 (SAT 455 alpha) purified as described ( Adell et al., 2014 ); polyclonal rabbit antisera (1:5000) specific for Vps4, Snf7 and Vps24 were a gift from the Emr Lab ( Teis et al., 2008 ); mouse monoclonal antibody (1:10000) specific for PGK (phosphoglycerate kinase 1, (Invitrogen, Rockford, Illinois, USA, 459250); mouse monoclonal antibody (1:1000) specific for GFP (IgG1K, Roche Diagnostics, Germany, 11814460001, RRID: AB_390913 ); goat anti-mouse IgG–Peroxidase (Sigma, St. Louis, Missouri, USA, A4416, 1:5000, RRID: AB_258167 ); goat anti-Rabbit IgG–Peroxidase (Sigma, St. Louis, Missouri, USA, A0545, 1:5000). FM4-64 for life cell microscopy was purchased from Invitrogen (United Kingdom, T-3166); Rapamycin from LC Laboratories (Woburn, Massachusetts, USA, R-5000) and Concanavalin A from Canavalia ensiformis from Sigma (St. Louis, Missouri, USA, L7647). For Canavanine sensitivity assays we used L-Canavanine from Sigma (St. Louis, Missouri, USA, C1625). TetraSpeck Microspheres, 0.05 µm (Thermo Scientific, Eugene Oregon, USA C47281 ) were used for correlative fluorescence and electron microscopy. Goat anti-GFP (Rockland, Limerick, Pennsylvania, USA, 600-101-215, 1:500, RRID: AB_218182 ), visualized by rabbit anti-goat Fab’ NANOGOLD (Nanoprobes, Yaphank, New York, USA, 2004, 1:150) plus silver enhancement with HQ-Silver (Nanoprobes, Yaphank, New York, USA, 2012) was used for immunogold labeling. Additional Information on Antibodies and Reagents is provided in Supplementary file 3 . Strains, Plasmids and DNA manipulation Saccharomyces cerevisiae strains were grown to mid-log phase in YNB medium without methionine (unless otherwise indicated). Strains, plasmids and oligonucleotides are described in Supplementary file 3 . The mNeonGreen Advanced vector was purchased from Allele-Biotechnology (purchase license L. A. Huber, Division of Cell Biology, Medical University Innsbruck). All plasmids were generated by standard cloning techniques. The shuttle vectors used have been described ( Adell et al., 2014 ).
Show full methods section
Antibodies and reagents
The following antibodies were used for western blot analysis with the stated dilutions: rabbit polyclonal antiserum (1:200) specific for Vps2 (SAT 455 alpha) purified as described ( Adell et al., 2014 ); polyclonal rabbit antisera (1:5000) specific for Vps4, Snf7 and Vps24 were a gift from the Emr Lab ( Teis et al., 2008 ); mouse monoclonal antibody (1:10000) specific for PGK (phosphoglycerate kinase 1, (Invitrogen, Rockford, Illinois, USA, 459250); mouse monoclonal antibody (1:1000) specific for GFP (IgG1K, Roche Diagnostics, Germany, 11814460001, RRID: AB_390913 ); goat anti-mouse IgG–Peroxidase (Sigma, St. Louis, Missouri, USA, A4416, 1:5000, RRID: AB_258167 ); goat anti-Rabbit IgG–Peroxidase (Sigma, St. Louis, Missouri, USA, A0545, 1:5000). FM4-64 for life cell microscopy was purchased from Invitrogen (United Kingdom, T-3166); Rapamycin from LC Laboratories (Woburn, Massachusetts, USA, R-5000) and Concanavalin A from Canavalia ensiformis from Sigma (St. Louis, Missouri, USA, L7647). For Canavanine sensitivity assays we used L-Canavanine from Sigma (St. Louis, Missouri, USA, C1625). TetraSpeck Microspheres, 0.05 µm (Thermo Scientific, Eugene Oregon, USA C47281 ) were used for correlative fluorescence and electron microscopy. Goat anti-GFP (Rockland, Limerick, Pennsylvania, USA, 600-101-215, 1:500, RRID: AB_218182 ), visualized by rabbit anti-goat Fab’ NANOGOLD (Nanoprobes, Yaphank, New York, USA, 2004, 1:150) plus silver enhancement with HQ-Silver (Nanoprobes, Yaphank, New York, USA, 2012) was used for immunogold labeling. Additional Information on Antibodies and Reagents is provided in Supplementary file 3 . Strains, Plasmids and DNA manipulation Saccharomyces cerevisiae strains were grown to mid-log phase in YNB medium without methionine (unless otherwise indicated). Strains, plasmids and oligonucleotides are described in Supplementary file 3 . The mNeonGreen Advanced vector was purchased from Allele-Biotechnology (purchase license L. A. Huber, Division of Cell Biology, Medical University Innsbruck). All plasmids were generated by standard cloning techniques. The shuttle vectors used have been described ( Adell et al., 2014 ).
Preparation of yeast whole cell protein extracts
Log phase yeast cells were pelleted, resuspended in ice-cold water with 10% trichloroacetic acid (TCA), incubated on ice for at least 30 min and washed twice with acetone. The precipitate was resolubilized in boiling buffer (50 mM Tris-HCl, pH 7, 5; 1 mM EDTA, 1% SDS), solubilized with glass beads and boiled at 95°C. Urea sample buffer (150 mM Tris-HCl, pH 6, 8, 6 M Urea, 6% SDS, bromophenol blue, 10% β-mercaptoethanol) was added and the cleared cell lysate analyzed by SDS-PAGE. Subcellular fractionation Subcellular fractionation of proteins into membrane-associated pellet and soluble cytoplasmic fractions was performed from mid-log cells as described ( Babst et al., 1997 ). In vivo DSP crosslinking ( Figure 4—figure supplement 10 ) and cell lysis of yeast cells expressing Vps4-eGFP was performed as described ( Copic et al., 2007 ).
Canavanine sensitivity assay
Yeast cells were grown over night to log phase OD 600 ~0.6 and serial dilutions were spotted on agar plates with YPD complete medium, 1x YNB selective medium and 1x YNB + 1µg/ml L-Canavanine as described ( Teis et al., 2010 ). Inducible in vivo heterodimerization by rapamycin (‘anchor-away’) Pma1 was chosen as an anchor because it is about 200x more abundant when compared to Vps4 ( Ghaemmaghami et al., 2003 ) and has been used as a well characterized anchor many times before (e.g. Haruki et al., 2008 ). Moreover Pma1 is a stable cell surface protein with a half-life of ∼11 hr ( Benito et al., 1991 ), ( Shih et al., 2000 ). Heterodimerization of FKBP12 with FRB fused to Vps4 was achieved in yeast cells grown to mid-log phase and then treated with 1 µg/ml rapamycin (rapamycin stock = 50 mg/ml in 100% EtOH) . Vps4-(eGFP)-FRB was efficiently anchored way in less than one minute and remained inactivated for the duration of the experiments (ranging from 30 s to 2 hr). When Vps4-GFP-FRB was co-expressed with Vps4-mCherry in the same cell, Vps4-mCherry remained in the cytoplasm and on endosomes. It was not co-recruited by Vps4-eGFP-FRB to Pma1-FKBP1 at the plasma membrane. This result suggested that once Vps4-eGFP-FRB was anchored to Pma1-FKB12 it could no longer form functional complexes ( Figure 5—figure supplement 1 ). Under these conditions Vps4-eGFP-FRB was only visible at the PM, did not accumulate on endosomes and was not transported into the vacuole via the MVB. When Vps4-eGFP-FRB was co-expressed with untagged Vps4, MVB sorting remained active ( Figure 5a ) after anchoring away Vps4-eGFP-FRB. Vps4-GFP-FRB remained anchored to Pma1-FKBP12, it remained at the PM and was not detected on endosomes and it was not transported to the vacuole for the duration of the experiment – unlike Mup1-mCherry that was efficiently delivered to the vacuole in the same cells.
Epifluorescence microscopy
Live cell epifluorescence microscopy was carried out using a Zeiss Axio Imager M1 equipped with a SPOT Xplorer CCD camera, standard fluorescent filters and AxioVision software. Exposure time was 500 msec for all fluorescent channels (eGFP, mCherry, mRuby2, FM4-64) and 50 msec for phase contrast images. Membrane labeling by FM4-64 dye (Invitrogen) was done in midlog (OD 600 = 0.6) cells ( Teis et al., 2008 ; Vida and Emr, 1995 ). Cells were incubated with FM4-64 dye for 5 min at 26°C, washed twice with YNB, re-suspended in selection medium, incubated for one hour at 26°C and then imaged ( Vida and Emr, 1995 ; Teis et al., 2008 ). The brightness and contrast of the images in the figure were adjusted using Photoshop CS5 (version 12.0.4 × 64; Adobe).
Fluorescence recovery after photobleaching
Live cell confocal microscopy was performed using a TSC SP5 confocal laser-scanning microscope (Leica) and a 63x Leica Objective (HC-PL-APO-CORR-CS2, NA = 1,20), with cells grown to midlog (OD 600 = 0.4–0.6) labeled with FM4-64 5 min before imaging. Cells were mounted on concavalin A coated cover slides. FRAP was carried in perivacuolar regions of interest containing Vps4-eGFP and FM4-64; bleaching was achieved by 10 ms exposure of an Argon laser beam (digital power 40%, intensity 40%) emitting at 488 nm (point-bleaching setting, Leica-FRAP Wizard). Vps4-eGFP was imaged with 488 nm (10% intensity, HyD 100% gain), FM4-64 was imaged with 561 nm (3% intensity, HyD detector 100% gain). The time-series were acquired with an imaging speed of 1400 Hz. For analysis, fluorescence intensity was corrected for background and bleaching, and normalized to the fluorescence intensity from the first frame. The rate of recovery after photobleaching and the fitted time constants were determined using a single-exponential fitting custom-made MATLAB script.
Correlated light and electron microscopy
Correlative light and electron microscopy was performed as described with minor modifications ( Kukulski et al., 2011 ; Suresh et al., 2015 ). Briefly, Vps4-eGFP expressing cells were grown in SD-Met media and Vps4-mNeonGreen expressing cells in SC-Trp at 30°C. Yeast cells were harvested by filtration and then subjected to high-pressure rapid freezing. Samples were freeze-substituted and then embedded in Lowicryl HM20. 200–300 nm thick sections were collected on copper grids with a continuous carbon film. TetraSpeck beads of 50 nm diameter used as markers for the correlation procedure were deposited on the sample surface. The grids were imaged on an Olympus IX81 inverted microscope equipped with 100×, N/A 1.45 objective and an Orca-ER camera (Hamamatsu). Three channels were acquired for each field of view (blue with excitation filter 377/50 nm and emission filter 473/30 nm; green with excitation filter 470/22 nm and emission filter 520/35 nm; red with excitation filter 556/20 nm and emission filter 624/40 nm). Before electron tomography 15 nm fiducial gold conjugates were applied to the section surface as fiducial markers for tomogram alignment, and samples were contrasted with Reynolds lead citrate. Electron tomography was performed using Tecnai F30 (FEI) transmission electron microscope at the EMBL Electron Microscopy Core Facility, operated at 300 KV, equipped with a FEI Eagle 4K CCD camera and dual tilt holder. Data were collected using the SerialEM software ( Mastronarde, 2005 ). Two tomograms were recorded for each area of interest: a dual-axis high-magnification tomogram with pixel size 1.202 nm, tilt range −60° to +60°, and 1° tilt angle increment and a low magnification tomogram with a pixel size of 2.59 nm, tilt range −60° to +60°, and a 2° tilt angle increment.
Sample preparation for tomography and immuno-gold labeling
High-pressure freezing and freeze-substitution was performed as described ( Adell et al., 2014 ; Schmiedinger et al., 2013 ). For tomography, samples were subsequently embedded in epoxy resin and 100–300 nm sections analyzed after post-staining. Electron tomography from 300 nm sections (coated with 10 nm fiducial gold conjugates) was performed on a Tecnai T20-G2 (FEI) operated at 200kV using dual-tilt series. Images were recorded at binning 2 with a 4 × 4 k Eagle digital camera (FEI) from 55° to −55° with 1° increments using Inspect3D automated tomography software (FEI). For immunoelectron microscopy, freeze-substituted samples were rehydrated ( van Donselaar et al., 2007 ), and processed for indirect immunogold labeling ( Schmiedinger et al., 2013 ) of 100 nm-thick, thawed cryosections.
Tomographic reconstructions and analysis
Tomogram reconstruction, 3D modeling and analysis were performed using the IMOD software package ( Kremer et al., 1996 ). The analysis for correlating light and electron microscopy was performed as described using a Matlab-7.4 script ( Kukulski et al., 2012b ). Real time 3D LLSM Yeast cells expressing fluorescently tagged ESCRT-III, Vps4 and cargo proteins were grown to log phase in selective SC media. Cells were concentrated by centrifugation and 2 × 10 7 cells re-suspended in 10 μl selective SC media and spotted on top of concanavalin A-coated 5 mm round glass coverslips. After 5 min, coverslips were placed in the sample bath of our LLSM ( Aguet et al., 2016 ) containing selective SC media. The samples were imaged as a time series in 3D using a dithered multi-Bessel lattice light-sheet by stepping the sample stage at 500 nm intervals in the s-axis equivalent to ~261 nm translation in the z-axis ( Figure 3a ); thus, each 3D image took 850 ms to acquire (including a 100 ms pause between imaging volumes) for a total of 60 time points. Each 3D stack corresponded to a pre-deskewed volume of ~50 µm x 50 µm x 15 µm (512 × 512×30 pixels). The inner and outer NAs of excitation were 0.505 and 0.6, respectively. Yeast cells only expressing Vps4-eGFP, Vps4 E233Q -eGFP, or Vps4-eGFP in the pep12∆ background, were excited with a 488 nm laser (~120 mW operating power with an illumination of ~300 µW at the back aperture) to acquire 28–56 imaging planes, each exposed for ~14.8–21 ms and recorded using an Andor iXon 897 EMCCD camera. Same conditions were used to image cells expressing Snf7-eGFP in the pep12∆ background. Cells expressing combinations of Snf7-eGFP and Vps24-eGFP with either Vps4-mCherry or Vps4 E233Q -mCherry were sequentially excited with a 488 nm laser (~240 mW power and ~600 µW at back aperture) and a 561 nm laser (~500 mW power and ~400 µW at back aperture) for each optical plane. Images for each channel were recorded with two Andor iXon 897 EMCCD cameras using exposures of ~11.8 ms per channel. These imaging conditions provided with the sensitivity sufficient to detect the fluorescence signal with a signal-to-noise ratio of 3–5 from 3 eGFP molecules located within a diffraction-limited spot. Under these imaging conditions used for cells expressing the Vps4 E233Q mutants, the dynamic range of the EMCCD became saturated for the fluorescence signal elicited by ESCRT-III subunits or Vps4 associated with the E compartment ( Figure 3 , Figure 3—figure supplement 1 ). Analysis of ESCRT-III and Vps4 recruitment dynamics 3D image preprocessing Approximately 300–1000 yeast cells were analyzed per experimental condition. The 3D stacks were first cropped so as to only include data illuminated by the non-diffracting region of the light-sheet, then flat-field corrected to normalize for illumination, and finally deskewed using a geometric image transform function as described ( Aguet et al., 2016 ). The diffraction-limited spots were then detected and tracked in three dimensions using the same automated algorithms developed to follow the formation of clathrin-coated structures in the entire volume of a cell ( Aguet et al., 2016 ). The MATLAB implementations of LLSM volume deskewing, point-source detection and 3D tracking software are available for download at https://github.com/francois-a/llsmtools ( Aguet et al., 2016 ). Valid tracks used for further analysis encompassed those that did not merge or split during the duration of the object, whose lifetimes were fully included in the time series, whose fluorescence intensity where above the local background and sensitivity threshold and whose positions were farther than 1.5 µm from any edge of the imaged volume. Persistent tracks also used for analysis corresponded to those with lifetimes longer than the time series. Single molecule eGFP fluorescence calibration The LLSM was calibrated for three-molecule eGFP detection using bacterially produced eGFP adsorbed to a glass coverslip and imaged with the LLSM ( Figure 4—figure supplement 10e ). The microscope was adjusted to detect the fluorescence of single eGFP molecules, thus allowing us to generate a calibration curve obtained with different exposures and with the same laser power conditions used to image the cells. A custom-made MATLAB (MathWorks) script automatically detected the 3D-fitted asymmetric Gaussian fluorescence intensity associated with a diffraction-limited spot; a T-test was used to identify valid spots whose 3D-fitted fluorescence signal was statistically higher than their local background before bleaching. The fluorescence intensity distribution was then fitted to a mixture-model Gaussian function ( Aguet et al., 2013 ), where the first Gaussian population corresponded to signal elicited by a single-eGFP molecule. The eGFP fluorescence signals detected in the yeast cells were then converted to number of eGFP molecules and the traces include the propagated error (square root of the squared sums of uncertainties from the 3D fitted fluorescence signal and from the single-eGFP calibration curve). The spinning disc confocal microscope was calibrated for single-molecule eGFP as described above but using a 2D Gaussian fluorescence intensity-fitting algorithm ( Cocucci et al., 2012 ) ( Aguet et al., 2013 ). Fluctuation dynamics, lifetimes, number of molecule and visualization Imaging of diffraction limited fluorescent beads illuminated so as to generate the signal equivalent to ~50 eGFPs showed constant fluorescence signal with a standard deviation of ~3; this indicates that the large signal fluctuations determined in the yeast cells were not due to the instrument but instead were biological fluctuations due to change in the number of fluorescence molecules recruited to a single spot. The same conclusion was reached by demonstrating absence of fluorescence intensity fluctuations in time series of Mup1-eGFP cargo internalized into the diffraction-limited peripheral endosomes in yeast cells imaged with the same conditions of illumination and acquisition used to trace ESCRT-III and Vps4 dynamics. Correlation dynamics ( Figure 4a ), lifetimes ( Figure 4b ) and maximum number of molecules accumulated within a trace ( Figure 4c,d and Figure 4—figure supplement 1a ) were obtained using custom-made MATLAB routines. The plots in Figure 4a show the cross-correlation of fluorescence data and the corresponding derivative obtained in the eGFP and mCherry channels for traces lasting 11 s or more. The plots in Figure 4b–d and Figure 4—figure supplement 1 show probability density distributions and cumulative distributions; the last bin in Figure 4c and Figure 4—figure supplement 1 show the 95th – 100th percentile of values. The local temporal fluctuations in the number of molecules associated with perivacuolar objects were determined using the findpeaks function included in a custom-made MATLAB script. 3D volume rendered images ( Figure 3f , Figure 3—figure supplement 1 ) and movies were generated using Amira 6.1–6.3 (FEI, Thermo Fisher Scientific). When indicated, movies were deconvolved using the Lucy–Richardson algorithm (deconvlucy function in MATLAB) by providing measured background and an experimentally measured PSF for 15 iterations. Statistical analysis Statistical Analyses were performed using two-sample Kolmogorov-Smirnov test ( Figure 4b–d , Figure 3—figure supplement 1 ), and Student’s T-test ( Figure 4—figure supplement 10b,d ), two-sample permutation test for means or medians ( Figure 4b,c , Figure 5—figure supplement 1c ).
Additional files 10.7554/eLife.31652.030 Supplementary file 1.
Statistics of the Vps4-eGFP and Vps4-mNeonGreen
CLEM dataset 10.7554/eLife.31652.031 Supplementary file 2. Summary of the quantitative data for Snf7-eGFP, Vps24-eGFP and Vps4-eGFP in WT cells and in the respective mutants. 10.7554/eLife.31652.032 Supplementary file 3. This table contains information on yeast strains, plasmids, DNA primer, Antibodies, chemical reagents and software used in this work. 10.7554/eLife.31652.033 Transparent reporting form Major datasets The following dataset was generated: Adell M Migliano S Upadhyayula S Bykov Y Sprenger S Pakdel M Vogel G Jih G Skillern W Behrouzi R Babst M Hess M Briggs J Kirchhausen T Teis D 2017 Data from: Recruitment dynamics of ESCRT-III and Vps4 to endosomes and implications for reverse membrane budding http://dx.doi.org/10.5061/dryad.gn250 Available at Dryad Digital Repository under a CC0 Public Domain Dedication
📊 Figures
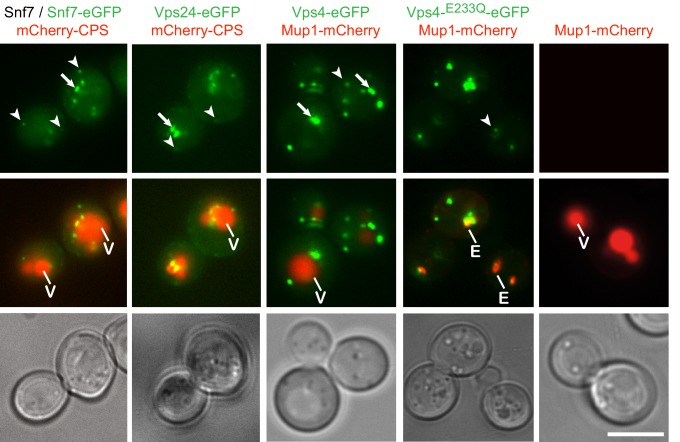
Figure 1.
Fluorophore tagged ESCRT-III subunits and Vps4 do not interfere with endosomal traffic to the vacuole.
Epifluorescence and phase contrast microscopy of live yeast cells expressing Snf7-eGFP mixed with untagged Snf7, Vps24-eGFP, Vps4-eGFP, Vps4 E233Q -eGFP or control cells, together with fluorescently t...
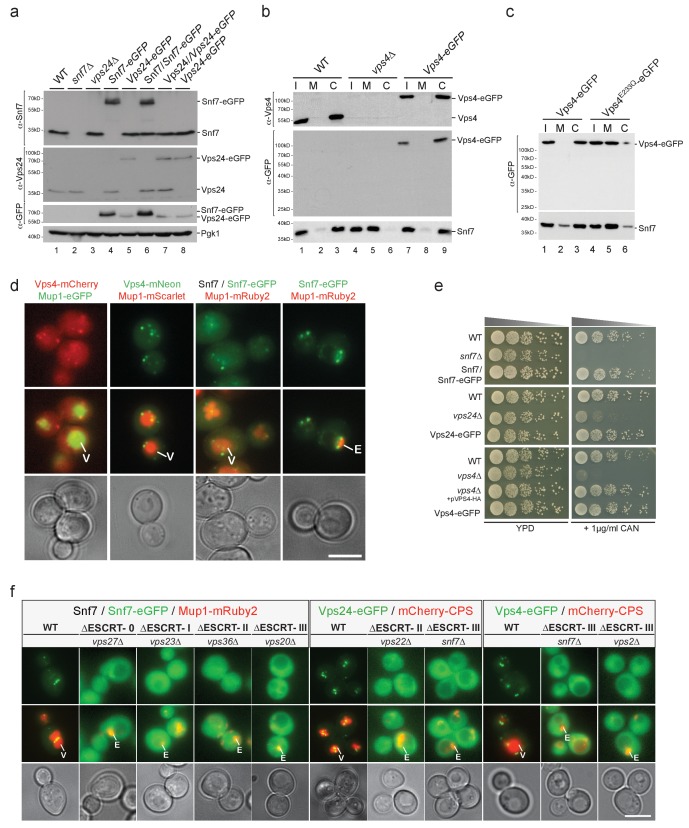
Figure 1u2014figure supplement 1.
Effect of fluorophore tagging of ESCRT-III subunits and Vps4 on the endosomal traffic of cargo to the vacuole.
( au2013c ) SDS-PAGE and western blot analysis using the indicated antibodies from total cell lysates ( a ) or equal volumes of subcellular fractions ( b, c ).u00a0Input (I), membrane fraction (M) and...
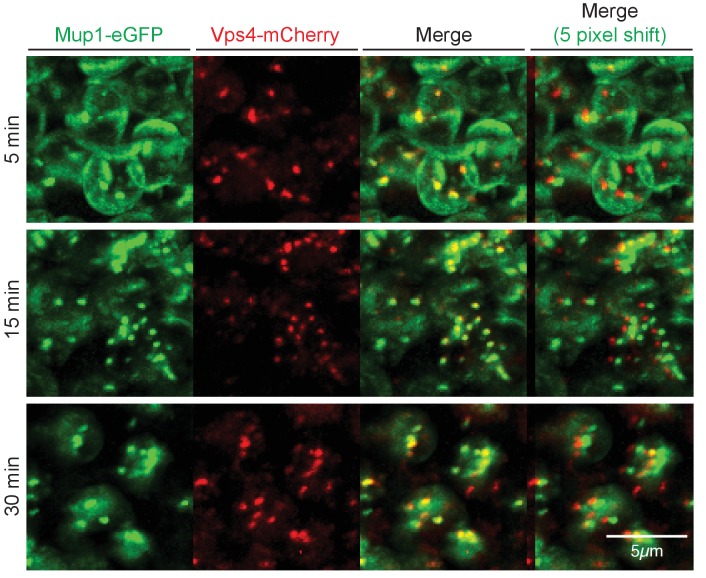
Figure 1u2014figure supplement 2.
Internalized cargo traffics through Vps4-containing carriers.
( a ) Representative z-projection images acquired using LLSM from the complete cell volume of yeast cells expressing the cargo Mup1-eGFP and Vps4-mCherry.u00a0The cells were, visualized 5, 15 or 30 mi...
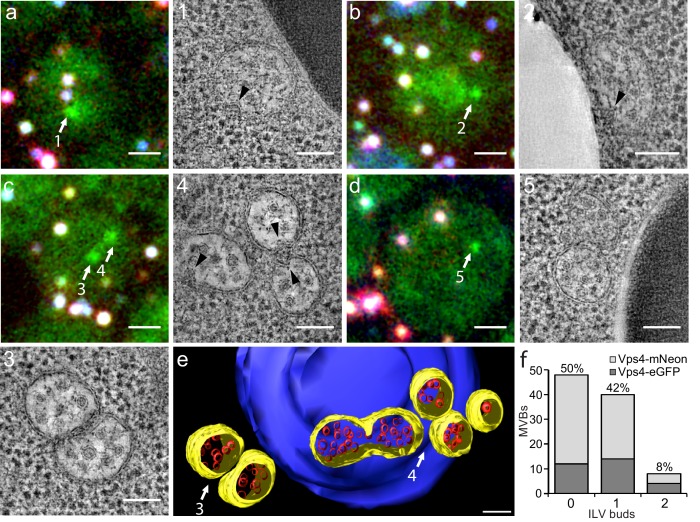
Figure 2.
Correlative light microscopy and electron tomography of perivacuolar MVBs.
Yeast cells expressing Vps4-eGFP or Vps4-mNeonGreen were cryo-fixed and sections subjected to correlative light microscopy and electron tomography. ( au2013d ) Representative images from epifluorescen...
Video 1.
Dynamics of Vps4-eGFP recruitment to endosomes of yeast cells visualized using LLSM.
Related to Figure 3f .u00a0The movie starts by showing the acquisition of sequential raw, non-deskewed imaging planes acquired every 20 ms using 3D LLSM from live cells expressing Vps4-eGFP. Then it s...
Video 2.
Dynamics of Vps4-eGFP recruitment to endosomes of yeast cells visualized using LLSM.
Related to Figure 3 .u00a0Cells expressing Vps4-eGFP were imaged for 51 s. The movie shows a deconvolved and rendered 3D view and orthogonal deconvolved side views. The fluorescent objects were traced...
Video 3.
Dynamics of Snf7-eGFP recruitment to endosomes of yeast cells visualized using LLSM.
Related to Figure 3 .u00a0Cells expressing a mixture of Snf7 and Snf7-eGFP together with Vps4-mCherry were imaged for 51 s. For simplicity, the movie only shows the fluorescence for Snf7-eGFP, althoug...
Video 4.
Dynamics of Vps24-eGFP recruitment to endosomes of yeast cells visualized using LLSM.
Related to Figure 3 .u00a0Cells expressing Vps24-eGFP together with Vps4-mCherry were imaged for 51 s. For simplicity, the movie only shows the fluorescence for Vps24-eGFP, although all the fluorescen...
Video 5.
Dynamics of Vps4 E233Q -eGFP recruitment to endosomes of yeast cells visualized using LLSM.
Related to Figure 3 .u00a0The 51 s 3D time series acquired using LLSM of yeast cells expressing Vps4 E233Q -eGFP. The movie shows a deconvolved and rendered 3D view and orthogonal deconvolved side vie...
Video 6.
Effect of the Vps4 E233Q mutant on the dynamics of Snf7-eGFP recruitment to endosomes of yeast cells visualized using LLSM.
Related to Figure 3 .u00a0Cells expressing a mixture of Snf7 and Snf7-eGFP together with Vps4 E233Q -mCherry were imaged for 51 s. Although all the fluorescence signals of Snf7-eGFP and Vps4 E233Q -mC...
Video 7.
Effect of the Vps4 E233Q mutant on the dynamics of Vps24-eGFP recruitment to endosomes of yeast cells visualized using LLSM.
Related to Figure 3 .u00a0Cells expressing Vps24-eGFP together with Vps4 E233Q -mCherry were imaged for 51 s. Although all the fluorescence signals of Vps24-eGFP and Vps4 E233Q -mCherry colocalized ( ...
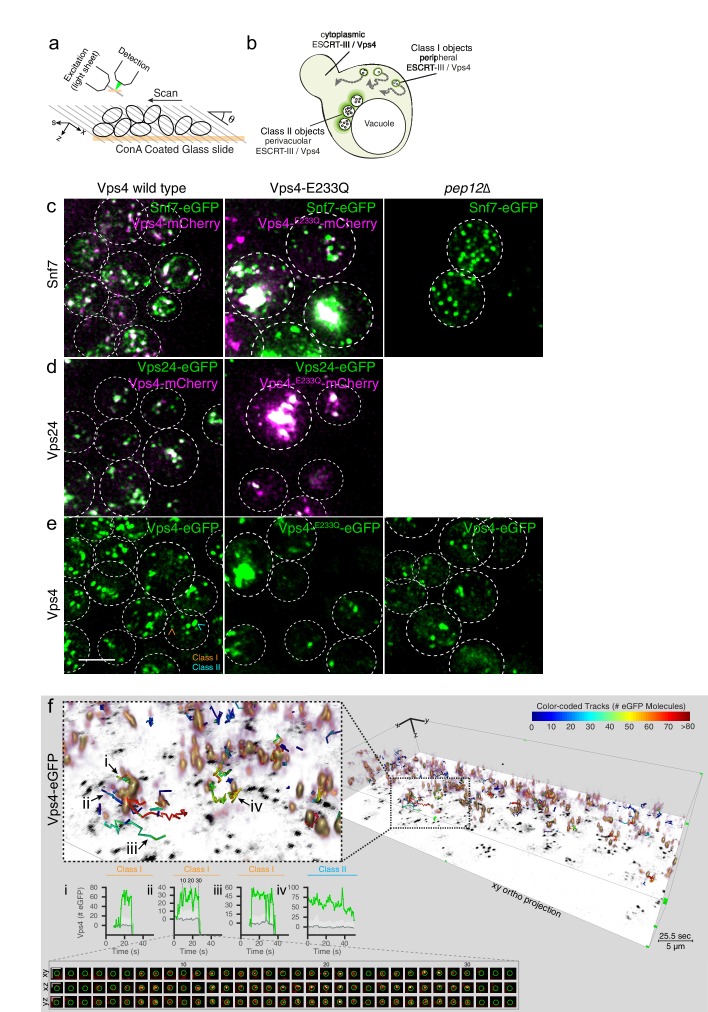
Figure 3.
3D Visualization of ESCRT-III and Vps4 recruitment dynamics by LLSM.
( a ) Schematic representation of the LLSM setup used to obtain time series of 51 s duration from the full cell volume of about 30u201350 yeast cells.u00a0Image stacks, containing 28u201330 sequential...
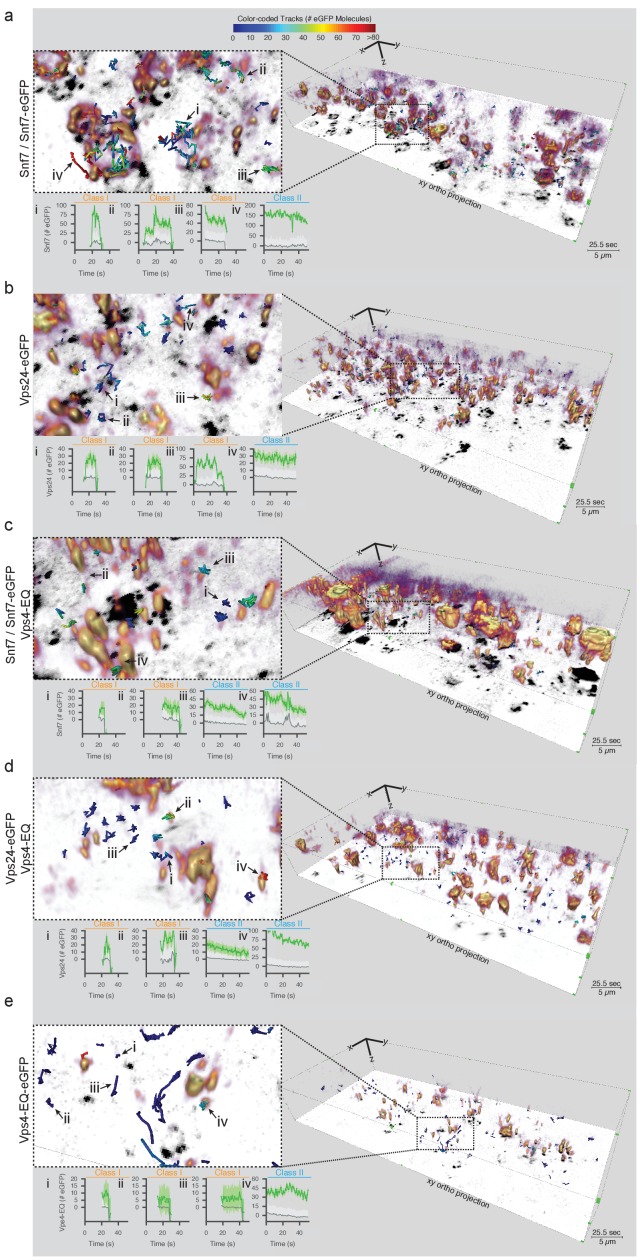
Figure 3u2014figure supplement 1.
Visualization of ESCRT-III and Vps4 E233Q recruitment dynamics by LLSM.
( au2013e ) Representative views obtained after 3D deconvolution and volume rendering of LLSM images from a single time point (25.5 s) of yeast cells expressing a mixture of Snf7 and Snf7-eGFP orVps24...
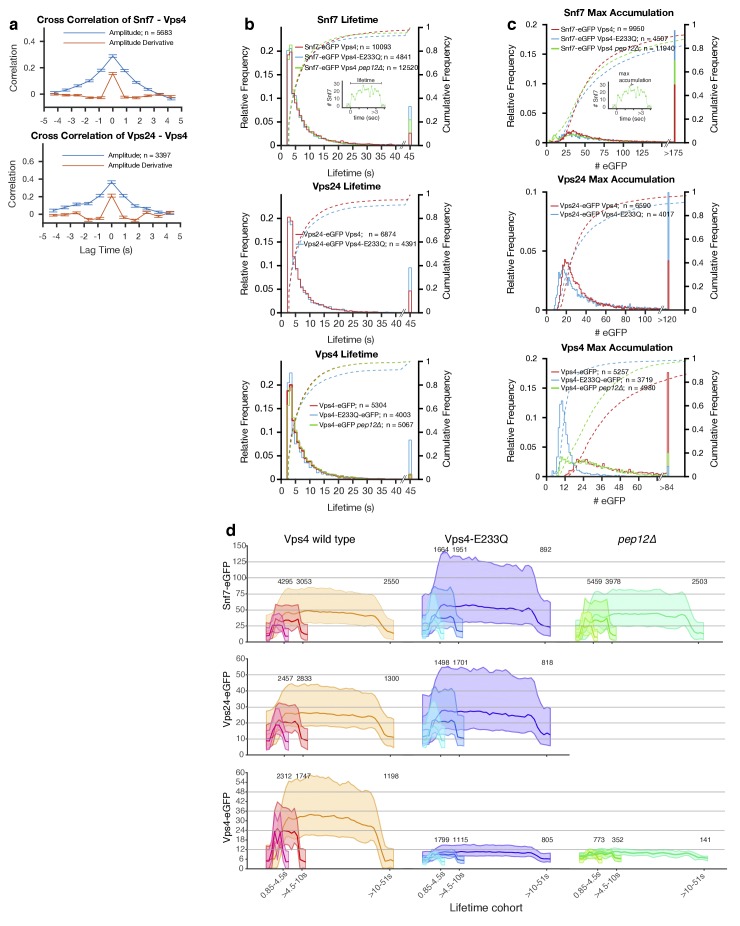
Figure 4.
Analysis of ESCRT-III and Vps4 recruitment to peripheral endosomes.
Quantitative analysis of time series acquired with the LLSM over the full volume of 300u20131000 yeast cells expressing a mixture of Snf7 and Snf7-eGFP with either Vps4-mCherry or Vps4 E233Q -mCherry ...
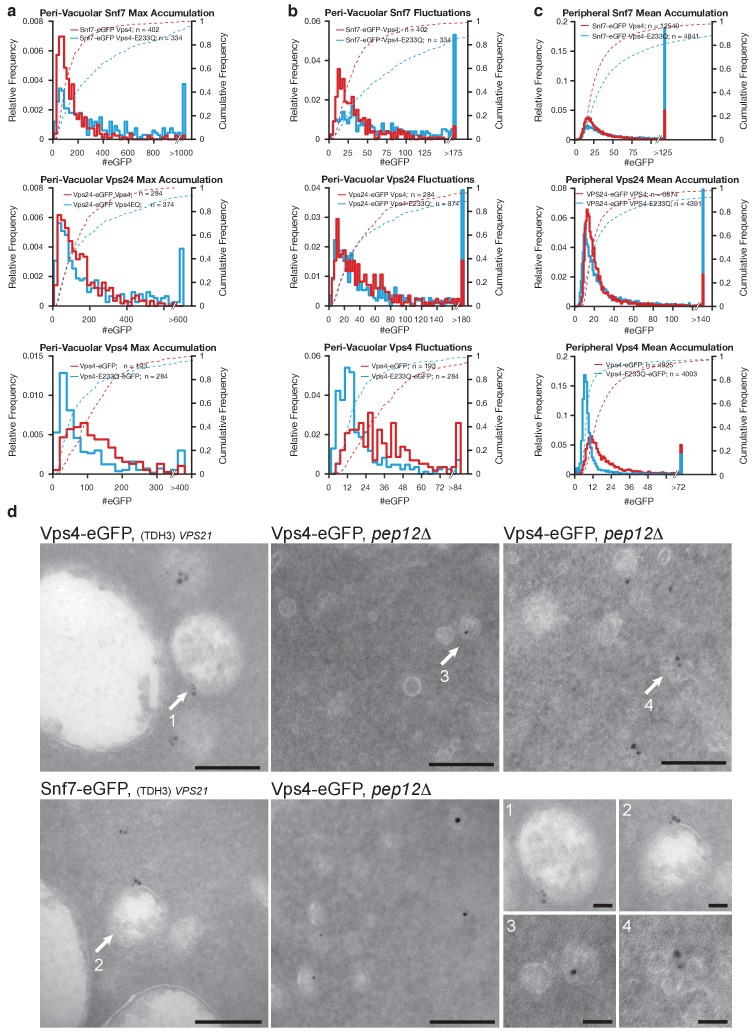
Figure 4u2014figure supplement 1.
Analysis of ESCRT-III and Vps4 recruitment associated with perivacuolar endosomes.
Analysis of diffraction-limited perivacuolar traces in yeast cells expressing Snf7 and Snf7-eGFP together with Vps4-mCherry or Vps4 E233Q -mCherry, Vps24-eGFP together with Vps4-mCherry or Vps4 E233Q ...
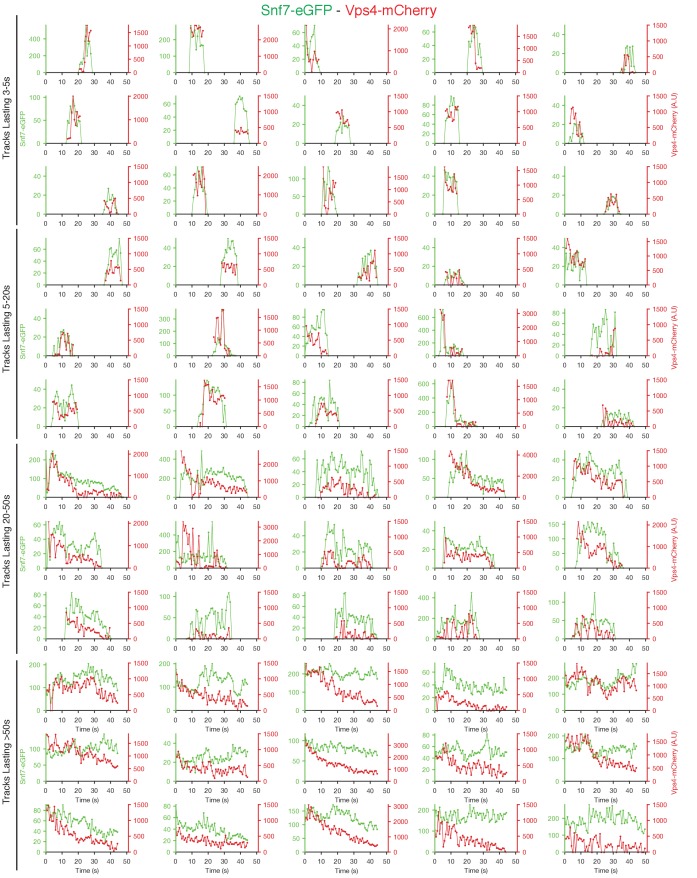
Figure 4u2014figure supplement 2.
Traces of Snf7-eGFP and Vps4-mCherry obtained by LLSM.
Plots showing representative examples of fluorescence traces clustered as cohorts of increasing lifetimes obtained by LLSM of cells expressing Snf7-eGFP and Vps4-mCherry. Vps4-mCherry traces are only ...
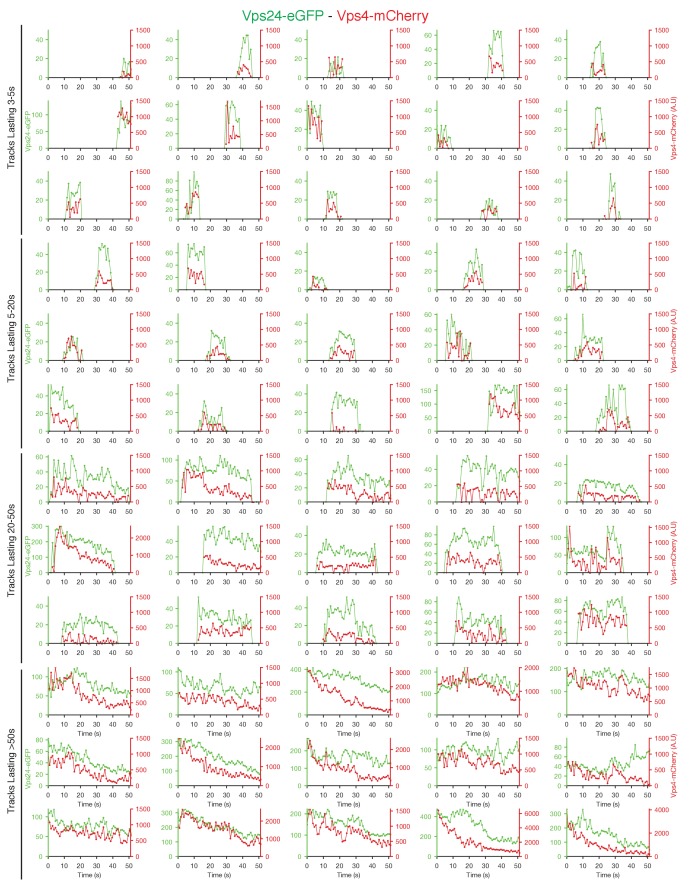
Figure 4u2014figure supplement 3.
Traces of Vps24-eGFP and Vps4-mCherry obtained by LLSM.
Plots showing representative examples of fluorescence traces clustered as cohorts of increasing lifetimes obtained using LLSM of cells expressing Vps24-eGFP and Vps4-mCherry. Vps4 - mCherry traces are...
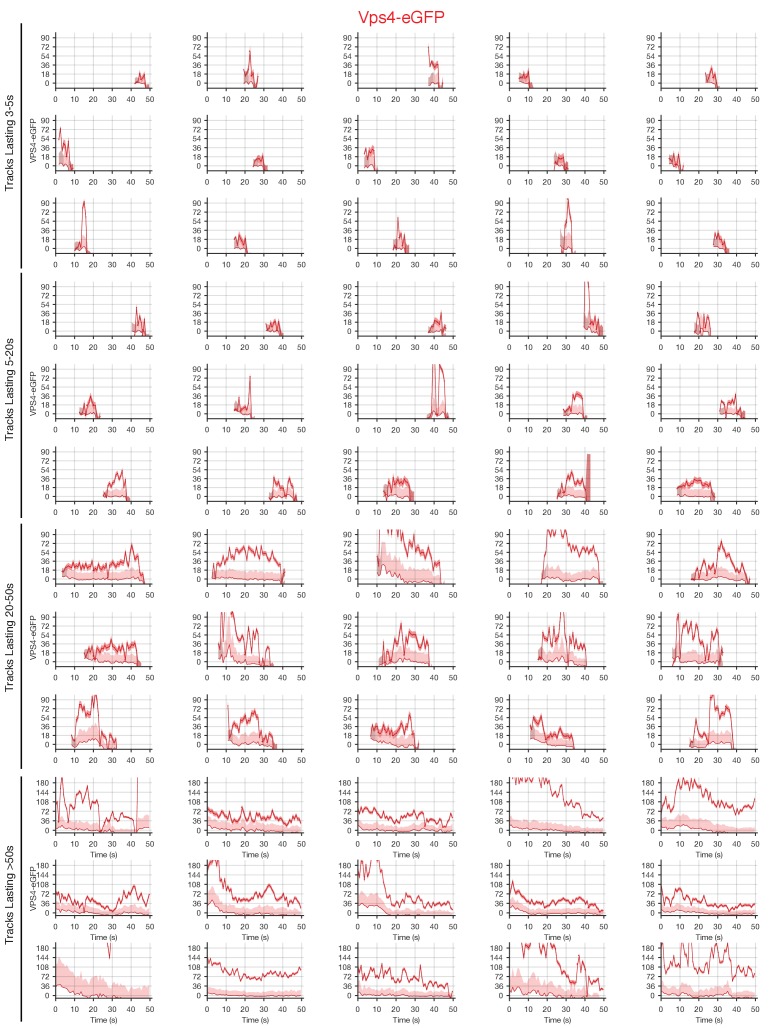
Figure 4u2014figure supplement 4.
Traces of Vps4-eGFP obtained by LLSM.
Plots showing random examples of fluorescence traces clustered as cohorts of increasing lifetimes obtained by LLSM of cells expressing Vps4-eGFP. Traces include the 95% confidence interval of the meas...
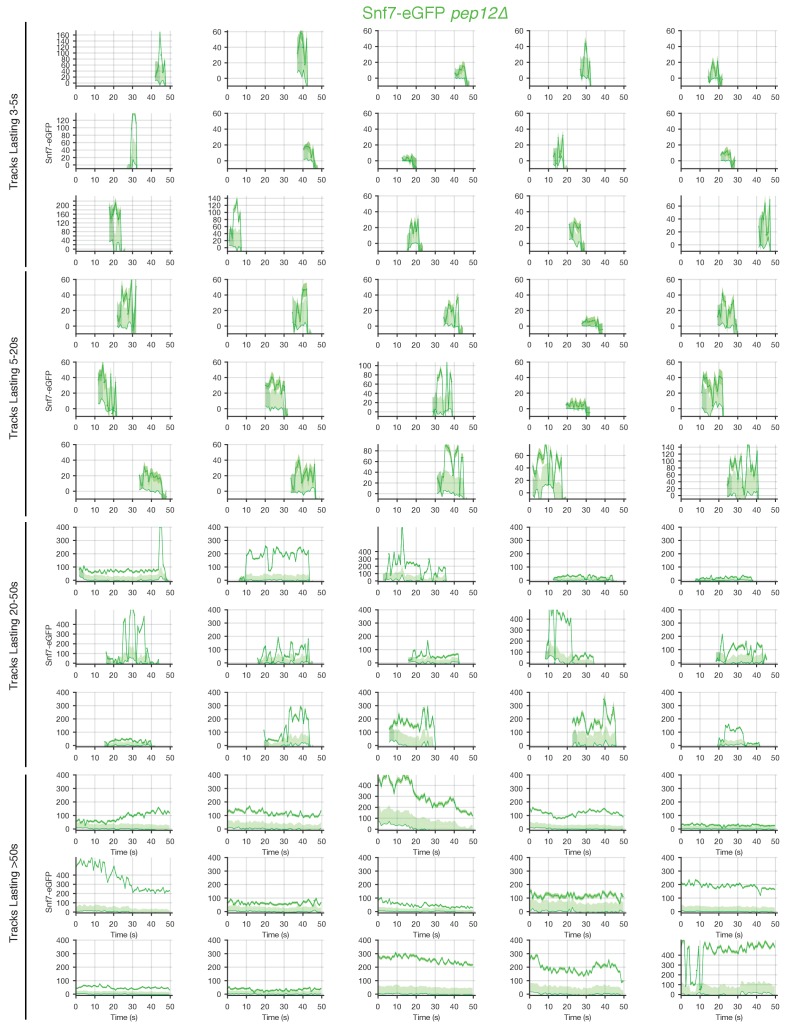
Figure 4u2014figure supplement 5.
Traces of Snf7-eGFP in pep12u0394 mutants obtained by LLSM.
Plots showing representative examples of fluorescence traces clustered as cohorts of increasing lifetimes obtained by LLSM of cells expressing Snf7-eGFP in pep12u0394 mutants.
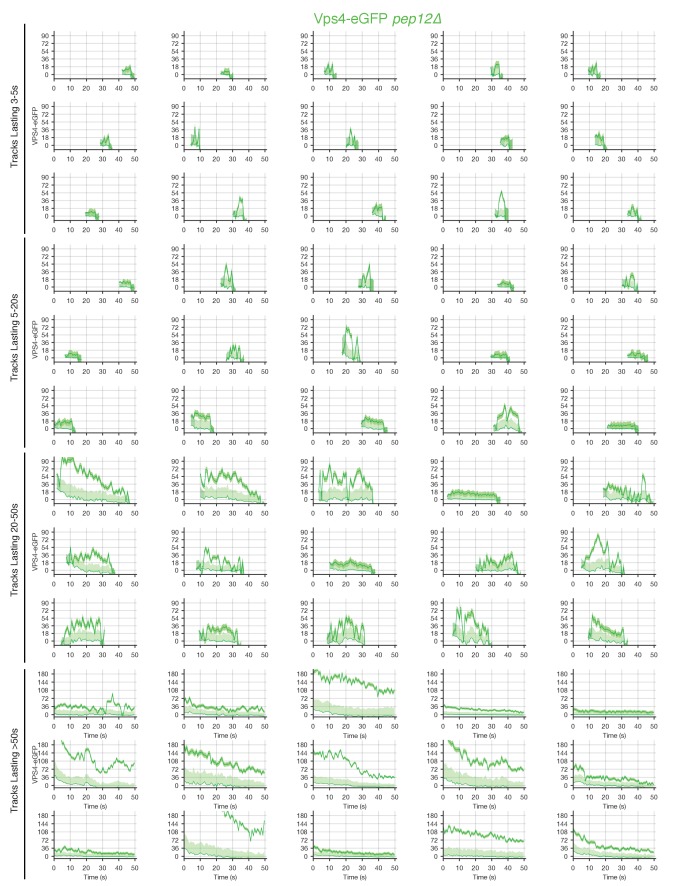
Figure 4u2014figure supplement 6.
Traces of Vps4-eGFP in pep12u0394 mutants obtained by LLSM.
Plots showing random examples of fluorescence traces clustered as cohorts of increasing lifetimes obtained by LLSM of pep12u0394 mutants expressing Vps4-eGFP. Traces include the 95% confidence interva...
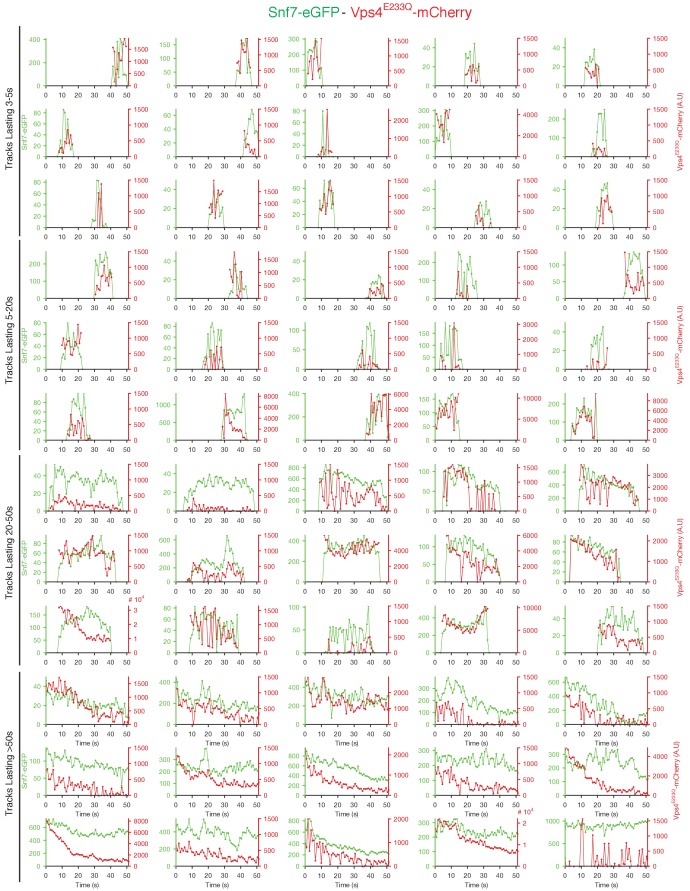
Figure 4u2014figure supplement 7.
Traces of Snf7-eGFP and Vps4 E233Q -mCherry obtained by LLSM.
Plots showing representative examples of fluorescence traces clustered as cohorts of increasing lifetimes obtained by LLSM of cells expressing Snf7-eGFP and Vps4 E233Q -mCherry. Vps4 E233Q -mCherry tr...
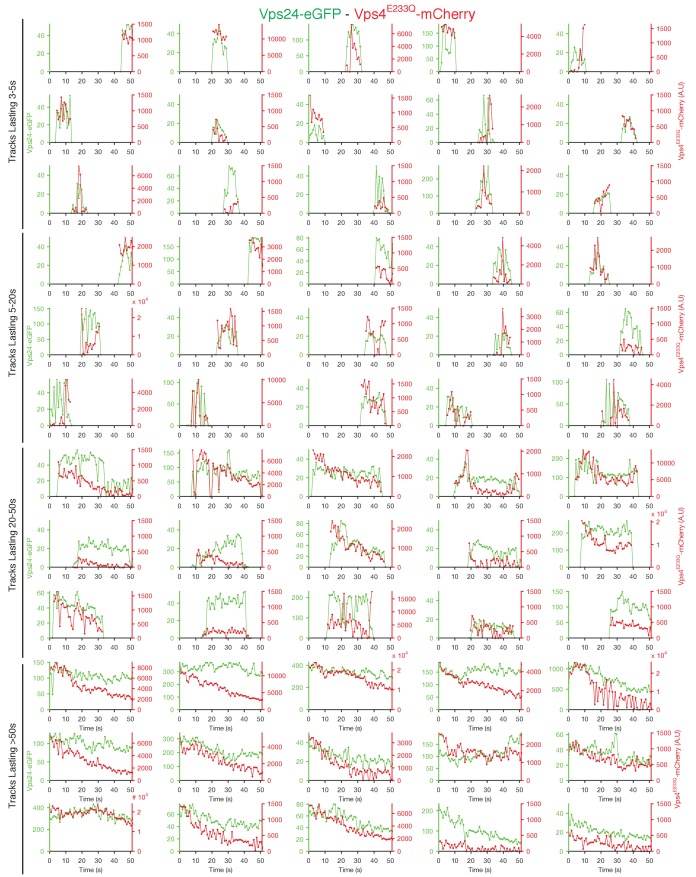
Figure 4u2014figure supplement 8.
Traces of Vps24-eGFP and Vps4 E233Q -mCherry obtained by LLSM.
Plots showing representative examples of fluorescence traces clustered as cohorts of increasing lifetimes obtained using LLSM of cells expressing Vps24-eGFP and Vps4 E233Q -mCherry. Vps4 E233Q -mCherr...
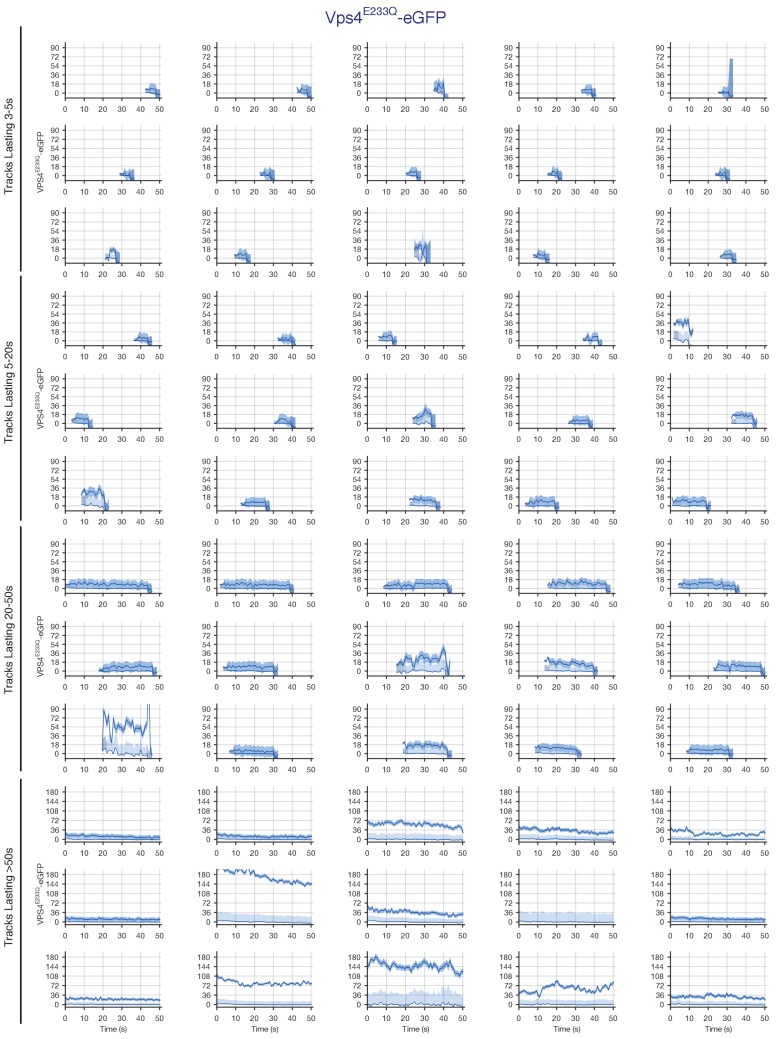
Figure 4u2014figure supplement 9.
Traces of Vps4 E233Q -eGFP obtained by LLSM.
Plots showing random examples of fluorescence traces clustered as cohorts of increasing lifetimes obtained by LLSM of cells expressing Vps4 E233Q -eGFP. Traces include the 95% confidence interval of t...
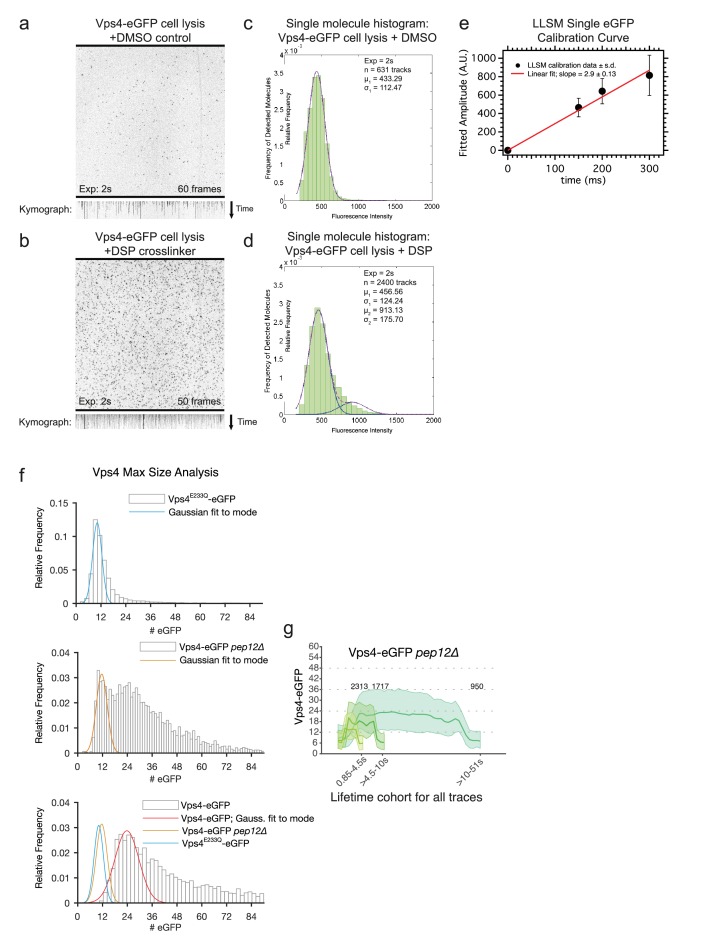
Figure 4u2014figure supplement 10.
Composition of Vps4 in the cytosol of wt cells and on the endosomes in pep12u0394 mutants.
( a u2013 d ) Cytosolic Vps4-eGFP is mostly a monomer. Cell lysates obtained from yeast cells expressing Vps4-eGFP were placed in contact with glass coverslips and illuminated continuously with a spin...
Video 8.
Mup1-eGFP endocytic transport visualized using LLSM.
Related to Figure 3 .u00a0Live cells expressing the methanione transporter Mup1-eGFP were imaged using LLSM for 20 min starting 2 min after the addition of methionine. The movie shows 3D orthogonal de...
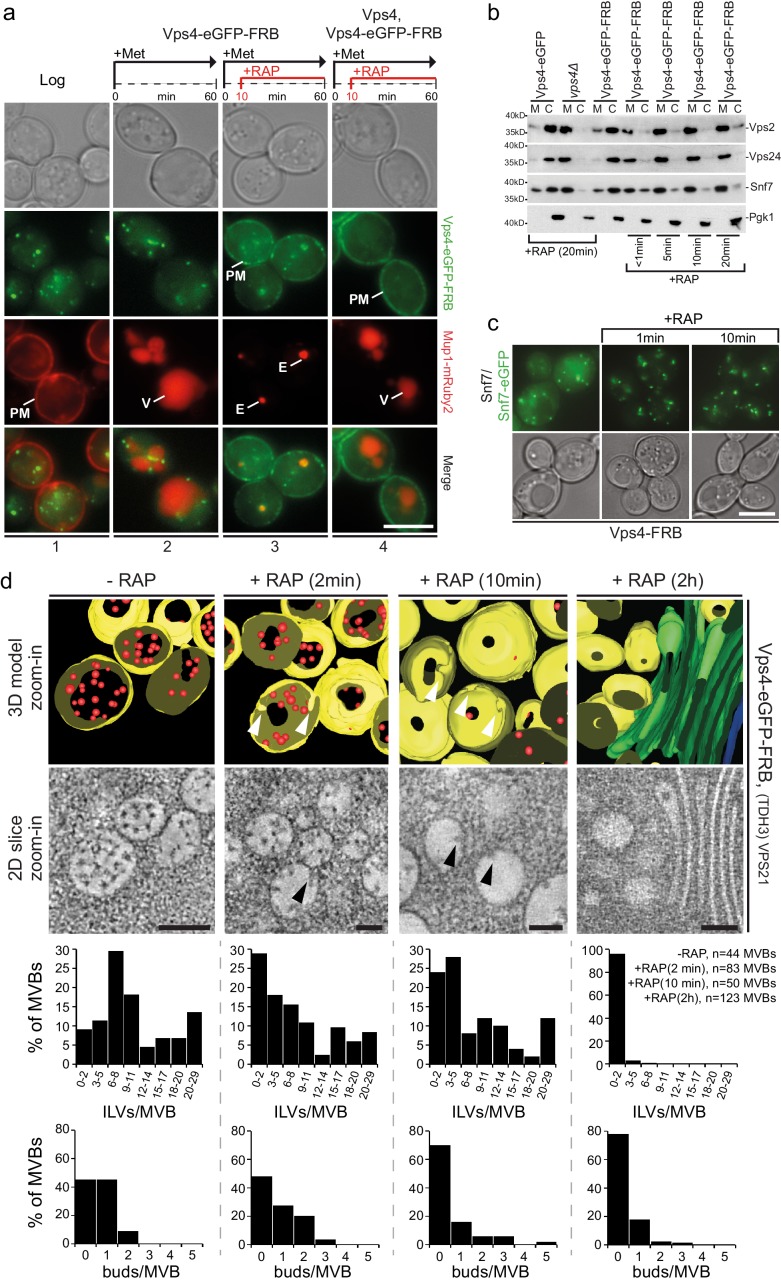
Figure 5.
Acute cytosolic depletion of Vps4 blocks endosomal traffic to the vacuole and changes the structure of perivacuolar MVBs.
Rapid depletion of cytosolic Vps4-eGFP-FRB was achieved by its capture on the cytosolic surface of the plasma membrane induced by rapamycin-mediated heterodimerization with Pma1-FKBP12. ( a ) Phase co...
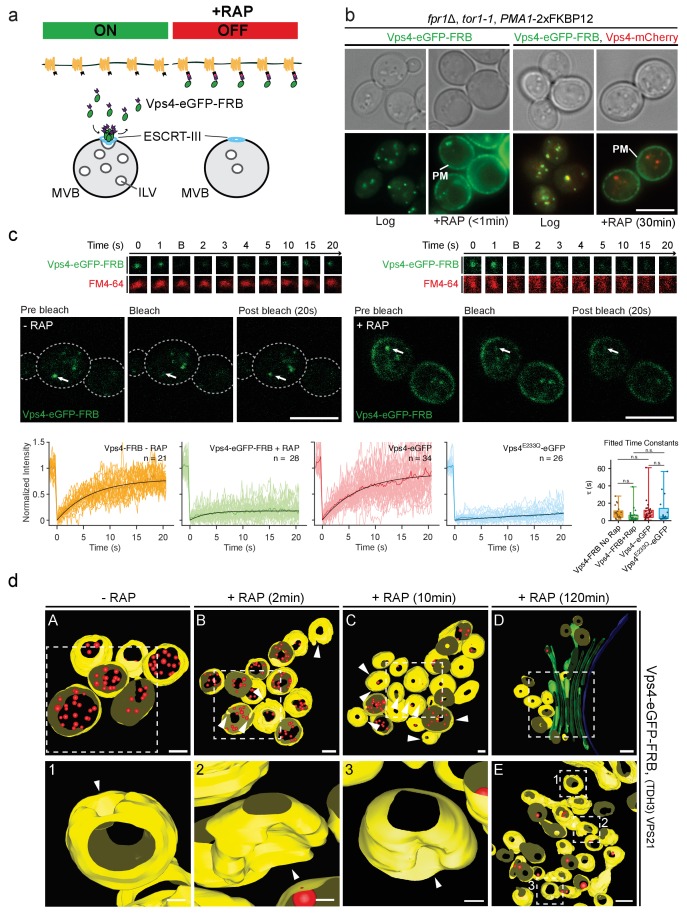
Figure 5u2014figure supplement 1.
Effects of the acute depletion of the cytosolic Vps4 pool.
( a ) Schematic representation of the anchor away approach used to acutely deplete the amount of cytosolic Vps4-FRB (OFF). Addition of rapamycin (RAP) results in the association of Vps4-FRB with the h...
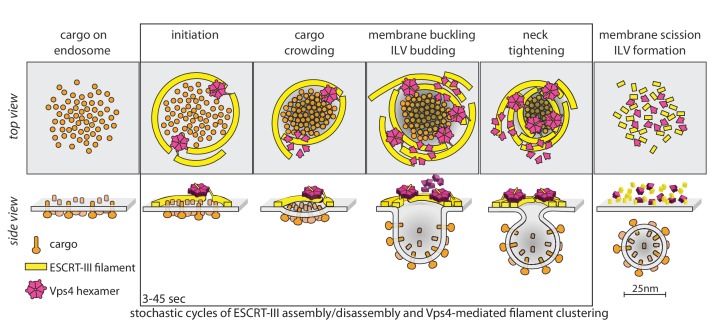
Figure 6.
Proposal of a model for the mechanism of ESCRT-mediated intraluminal vesicle formation.
The figure shows a schematic representation for possible stages during the budding and scission of ILVs in MVBs. ESCRT-0-II (not shown) bind cargo proteins and nucleate rapid assembly of several ESCRT...
Figure images are served from the NIH/NLM PubMed Central Open Access Subset or Europe PMC; copyright remains with the publishers and authors.
💬 Discussion
0 commentsNo comments yet. Be the first to start a discussion!
Leave a Comment