Abstract
Highly selective gene expression is a key requirement for antigenic variation in several pathogens, allowing evasion of host immune responses and maintenance of persistent infections1. African trypanosomes-parasites that cause lethal diseases in humans and livestock-employ an antigenic variation mechanism that involves monogenic antigen expression from a pool of >2,600 antigen-coding genes2. In other eukaryotes, the expression of individual genes can be enhanced by mechanisms involving the juxtaposition of otherwise distal chromosomal loci in the three-dimensional nuclear space3-5. However, trypanosomes lack classical enhancer sequences or regulated transcription initiation6,7. In this context, it has remained unclear how genome architecture contributes to monogenic transcription elongation and transcript processing. Here, we show that the single expressed antigen-coding gene displays a specific inter-chromosomal interaction with a major messenger RNA splicing locus. Chromosome conformation capture (Hi-C) revealed a dynamic reconfiguration of this inter-chromosomal interaction upon activation of another antigen. Super-resolution microscopy showed the interaction to be heritable and splicing dependent. We found a specific association of the two genomic loci with the antigen exclusion complex, whereby VSG exclusion 1 (VEX1) occupied the splicing locus and VEX2 occupied the antigen-coding locus. Following VEX2 depletion, loss of monogenic antigen expression was accompanied by increased interactions between previously silent antigen genes and the splicing locus. Our results reveal a mechanism to ensure monogenic expression, where antigen transcription and messenger RNA splicing occur in a specific nuclear compartment. These findings suggest a new means of post-transcriptional gene regulation.
🔬 Techniques
🔭 Microscopes
🧬 Organisms
💻 Software
✨ Fluorophores
🧪 Sample Preparation
🏭 Microscope Brands
🧪 Reagent Suppliers
📷 Detectors
💻 Software Details
💻 Code & Software
💾 Data Repositories
🏛️ Research Organizations (ROR)
Affiliated research institutions:
📋 Methods
No statistical methods were used to predetermine sample size. The experiments were not randomized and investigators were not blinded to allocation during experiments and outcome assessment. T. brucei growth and manipulation Bloodstream-form T. brucei , Lister 427 and 2T1 cells 36 , both wild-type with respect to VEX1, VEX2 and SNAP42 subunits, were grown in HMI-11 medium and genetically manipulated using electroporation 37 ; cytomix was used for all transfections. Puromycin, phleomycin, hygromycin and blasticidin were used at 2, 2, 2.5 and 10 μg ml -1 for selection of recombinant clones; and at 1, 1, 1 and 2 μg ml -1 for maintaining those clones, respectively. RNAi experiments were undertaken through tetracycline induction at 1 μg ml -1 . A double selection T. brucei cell line was used that derived from the Lister 427 bloodstream-form MITat 1.2 isolate 21 . A neomycin resistance gene in VSG expression site 17 and a puromycin resistance gene in VSG expression site 1 allowed the selection for a homogenous cell population that either expressed VSG-2 from expression site 1 or VSG-13 from expression site 17. Cells were cultivated with either 10 μg ml -1 of neomycin (also referred to as N50 cells) or 0.1 μg ml -1 of puromycin (referred to as P10 cells). Established procyclic-form T. brucei , Lister 427 cells were grown in SDM-79 at 27 °C and genetically manipulated using electroporation as above. Blasticidin or hygromycin were used at 10 or 50 and 2 or 1 μg ml -1 for selection and maintenance, respectively. Plasmids The VEX1 (Tb927.11.16920, 574 bp) 17 , VEX2 (Tb927.11.13380, 471 bp) 18 and VEX1/VEX2 18 RNAi cassettes were excised prior to electroporation by digesting with Asc I. The VEX1 12myc 17 and SNAP42 12myc 38 C -terminal tagging vectors were linearised with Sph I. The 6myc VEX2 and GFP VEX2 N -terminal tagging vectors were linearised with Xho I. The SNAP42 GFP C -terminal tagging vector was made by replacing the 12 x c-myc tag and as also linearised with Sph I, respectively. Linearised RNAi constructs, under the control of tetracycline-inducible promoters, were transfected into 2T1 cells, which allow for targeting to a single genomic locus validated for robust inducible expression 36 . ChIP-seq ChIP-Seq was carried out as described in 18 . Reads were aligned to the 11 curated megabase chromosomes from the TREU927 strain genome sequence 39 , and a non-redundant set of BES and mVSG contigs from the Lister 427 strain 40 – 42 using bowtie2 43 in very-sensitive alignment mode, and alignments were compressed and sorted using samtools 44 . Bowtie2 attempted to align 54.0 and 49.9 million read pairs with 70.84 and 82.43 % success rates, respectively, resulting in 38.3 and 41.1 million aligned read pairs. PCR duplicate reads were removed using Picard MarkDuplicates ( http://broadinstitute.github.io/picard/ ) resulting in 26.8 and 41.3 million aligned read pairs for analysis. Alignments were visually inspected with the Artemis genome browser 45 . Circular plots ( Extended Data Fig. 4c ) were generated using the R library circlize 46 and bedgraph files for log 2 fold change ( Fig. 3c ; Extended Data Fig. 9b ) were generated using deeptools2 47 . Bedgraphs were generated with 1kb, 300 bp or 10 bp bins and the option smoothLength 5000 (see figure legends for details). Spliced leader RNA sequences were annotated using the sequences: Promoter: CGTTTCTGGCACGACAGTAAAATATGGCAAGTGTCTCAAAACTGCCTGTACAGCTTATTTTTGGGACACACCCATGCTTTC…Transcript…AACTAACGCTATTATTAGAACAGTTTCTGTACTATATTGGTATGAGAAGCTCCCAGTAGCAGCTGGGCCAACACACGCATTTGTGCTGTTGGTTCCCGCCGCATACTGCGGGAATCTGGAAGGTGGGGTCGGATGACCTC and the ‘transcript’ features were plotted with transcription start site (TSS) and transcription end site (TES) denoting the 5′ and 3′ extremities. Fold enrichment traces covering the spliced leader locus were calculated directly using deeptools bamCompare. Heat maps ( Extended Data Fig. 4c ; Extended Data Fig. 8b ) were generated using deeptools2 bamCompare, computeMatrix and plotHeatmap 47 and resulting vector graphics files were then assembled into figures using Adobe Illustrator. Genomic regions for tandem genes and arbitrarily selected genes with a paralog count of 0 were assembled in bed files, using annotated mRNA sequences from TriTrypDB v5.1 of the TREU927 genome sequence. All scripts necessary to reproduce the ChIP-Seq analyses have been deposited together with the results of those analyses under https://doi.org/10.5281/zenodo.3628212 .
Show full methods section
No statistical methods were used to predetermine sample size. The experiments were not randomized and investigators were not blinded to allocation during experiments and outcome assessment. T. brucei growth and manipulation Bloodstream-form T. brucei , Lister 427 and 2T1 cells 36 , both wild-type with respect to VEX1, VEX2 and SNAP42 subunits, were grown in HMI-11 medium and genetically manipulated using electroporation 37 ; cytomix was used for all transfections. Puromycin, phleomycin, hygromycin and blasticidin were used at 2, 2, 2.5 and 10 μg ml -1 for selection of recombinant clones; and at 1, 1, 1 and 2 μg ml -1 for maintaining those clones, respectively. RNAi experiments were undertaken through tetracycline induction at 1 μg ml -1 . A double selection T. brucei cell line was used that derived from the Lister 427 bloodstream-form MITat 1.2 isolate 21 . A neomycin resistance gene in VSG expression site 17 and a puromycin resistance gene in VSG expression site 1 allowed the selection for a homogenous cell population that either expressed VSG-2 from expression site 1 or VSG-13 from expression site 17. Cells were cultivated with either 10 μg ml -1 of neomycin (also referred to as N50 cells) or 0.1 μg ml -1 of puromycin (referred to as P10 cells). Established procyclic-form T. brucei , Lister 427 cells were grown in SDM-79 at 27 °C and genetically manipulated using electroporation as above. Blasticidin or hygromycin were used at 10 or 50 and 2 or 1 μg ml -1 for selection and maintenance, respectively. Plasmids The VEX1 (Tb927.11.16920, 574 bp) 17 , VEX2 (Tb927.11.13380, 471 bp) 18 and VEX1/VEX2 18 RNAi cassettes were excised prior to electroporation by digesting with Asc I. The VEX1 12myc 17 and SNAP42 12myc 38 C -terminal tagging vectors were linearised with Sph I. The 6myc VEX2 and GFP VEX2 N -terminal tagging vectors were linearised with Xho I. The SNAP42 GFP C -terminal tagging vector was made by replacing the 12 x c-myc tag and as also linearised with Sph I, respectively. Linearised RNAi constructs, under the control of tetracycline-inducible promoters, were transfected into 2T1 cells, which allow for targeting to a single genomic locus validated for robust inducible expression 36 . ChIP-seq ChIP-Seq was carried out as described in 18 . Reads were aligned to the 11 curated megabase chromosomes from the TREU927 strain genome sequence 39 , and a non-redundant set of BES and mVSG contigs from the Lister 427 strain 40 – 42 using bowtie2 43 in very-sensitive alignment mode, and alignments were compressed and sorted using samtools 44 . Bowtie2 attempted to align 54.0 and 49.9 million read pairs with 70.84 and 82.43 % success rates, respectively, resulting in 38.3 and 41.1 million aligned read pairs. PCR duplicate reads were removed using Picard MarkDuplicates ( http://broadinstitute.github.io/picard/ ) resulting in 26.8 and 41.3 million aligned read pairs for analysis. Alignments were visually inspected with the Artemis genome browser 45 . Circular plots ( Extended Data Fig. 4c ) were generated using the R library circlize 46 and bedgraph files for log 2 fold change ( Fig. 3c ; Extended Data Fig. 9b ) were generated using deeptools2 47 . Bedgraphs were generated with 1kb, 300 bp or 10 bp bins and the option smoothLength 5000 (see figure legends for details). Spliced leader RNA sequences were annotated using the sequences: Promoter: CGTTTCTGGCACGACAGTAAAATATGGCAAGTGTCTCAAAACTGCCTGTACAGCTTATTTTTGGGACACACCCATGCTTTC…Transcript…AACTAACGCTATTATTAGAACAGTTTCTGTACTATATTGGTATGAGAAGCTCCCAGTAGCAGCTGGGCCAACACACGCATTTGTGCTGTTGGTTCCCGCCGCATACTGCGGGAATCTGGAAGGTGGGGTCGGATGACCTC and the ‘transcript’ features were plotted with transcription start site (TSS) and transcription end site (TES) denoting the 5′ and 3′ extremities. Fold enrichment traces covering the spliced leader locus were calculated directly using deeptools bamCompare. Heat maps ( Extended Data Fig. 4c ; Extended Data Fig. 8b ) were generated using deeptools2 bamCompare, computeMatrix and plotHeatmap 47 and resulting vector graphics files were then assembled into figures using Adobe Illustrator. Genomic regions for tandem genes and arbitrarily selected genes with a paralog count of 0 were assembled in bed files, using annotated mRNA sequences from TriTrypDB v5.1 of the TREU927 genome sequence. All scripts necessary to reproduce the ChIP-Seq analyses have been deposited together with the results of those analyses under https://doi.org/10.5281/zenodo.3628212 .
Protein blotting
Protein samples were run according to standard protein separation procedures, using SDS-PAGE. However, for VEX2 detection, the use of Bis-Tris gels with a neutral pH environment and a Bis-Tris/Bicine based transfer buffer (containing a reducing agent and 10% methanol) were critical for protein separation and transfer, respectively (NuPAGE, Invitrogen). Otherwise, western blotting was carried out according to standard protocols. The following primary antibodies were used: rabbit α-VEX2 (1:1,000), rabbit α-pol-I largest subunit 17 (1:500), rabbit α-VSG-2 (1:20,000), rabbit α-VSG-6 (1:20,000), mouse α-c-myc (Millipore, clone 4A6, 1:7,000), rabbit α-GFP (Abcam Ab290, 1:1,000) and mouse α-EF1α (Millipore, clone CBP-KK1, 1:20,000). We used horseradish peroxidase coupled secondary antibodies (α-mouse and α-rabbit, Biorad, 1:2,000). Blots were developed using an enhanced chemiluminescence kit (Amersham) according to the manufacturer’s instructions. Densitometry was performed using Fiji v. 2.0.0. Uncropped blots are provided as Source Data Extended Data Figs 5 and 6 .
Immunofluorescence
Immunofluorescence microscopy was carried out according to standard protocols. For wide field microscopy ( Extended Data Fig. 6a ), the cells were attached to 12-well 5 mm slides (Thermo Scientific). For super resolution microscopy, the cells were attached to poly-L-lysine treated coverslips (thickness 1.5 mm), stained and only then mounted onto glass slides. For colocalization studies with Pol I we used antigen-retrieval. Prior to permeabilization, fixed cells were rehydrated in PBS for 5 min at RT, held at 95 °C for 60 s in freshly prepared antigen retrieval buffer (100 mM Tris, 5% urea, pH 9.5) and then washed 3 x 5 min in PBS at RT. Cells were mounted in Vectashield with DAPI (wide field) or stained with 1 μg ml -1 DAPI for 10 min and then mounted in Vectashield without DAPI (super resolution). In T. brucei , DAPI-stained nuclear and mitochondrial DNA were used as cytological markers for cell-cycle stage; one nucleus and one kinetoplast (1N:1K) indicates G1, one nucleus and an elongated kinetoplast (1N:eK) indicates S phase, one nucleus and two kinetoplasts (1N:2K) indicates G2/M and two nuclei and two kinetoplasts (2N:2K) indicates post-mitosis 48 , 49 . Primary antisera were rat α-VSG-2 (1:10,000), rabbit α-VSG-6 (1:10,000), rabbit α-GFP (Invitrogen, 1:250; Abcam, 1:500), mouse α-myc (New England Biolabs, clone 9B11, 1:2,000), rabbit α-pol-I largest subunit 17 (1:100), rabbit α-NOG1 50 (1:500) and mouse α-EP procyclin (1:1,000). The secondary antibodies were Alexa Fluor conjugated goat antibodies (Thermo Scientific): α-mouse, α-rat and α-rabbit, AlexaFluor 488 or Alexa Fluor 568 (1:1,000 or 1:2,000, for super resolution or wide field microscopy, respectively). Sinefungin, actinomycin and BMH-21 were applied at 2 μg ml -1 , 10 μg ml -1 and 2 μM, respectively, for 30 minutes at 37 °C. Fluorescence in situ hybridization (FISH) For DNA FISH experiments, biotin- and digoxigenin-labeled DNA probes were generated by PCR using standard conditions with OneTaq polymerase (NEB), with the exception that a 1:2 ratio of biotin-16-dUTP (Roche) or digoxigenin-11-dUTP (Roche) and dTTP were used in the reaction. 50 bp repeats and SL repeats were amplified from T. brucei L427 genomic DNA ( Supplementary Information, sheet 3 ), a smear of products with various sizes was generated but only fragments of 400 bp or less were gel extracted and purified. DNA probes were co-precipitated with herring sperm DNA (Sigma) at 10 μg/mL and yeast tRNA (Invitrogen) at 10 μg/mL. Probes were then resuspended to a concentration of 1000 ng/mL in hybridization buffer (50% formamide, 10% dextran sulfate, 2×SSC). Before hybridization, cells were prepared similarly as for immunofluorescence: trypanosomes were fixed in 3% PFA for 15 min at 37 °C, washed three times with PBS and finally resuspended in 1% BSA. The cells were attached to poly-L-lysine treated slides, then permeabilized with 0.5% Triton X-100 in PBS for 15 min at RT, washed three times with PBS and then treated with 1 mg/mL of RNAse A (Invitrogen) in PBS for 1 h at RT. This was followed by a blocking step with 10 μg/mL of herring sperm DNA and 10 μg/mL of yeast tRNA in hybridization buffer (50% formamide, 10% dextran sulfate, 2×SSC) for 40 min at RT. After adding the probe mix to slides, the samples were sealed with gene frames and denatured on an inverted heat block at 85 °C for 5 min, followed by overnight incubation at 37 °C. After hybridization, the slides were washed with 50% formamide, 2×SSC for 30 min at 37 °C, followed by three 10-min washes in 1×SSC, 2×SSC, and 4×SSC at 50 °C. Samples were then incubated with an anti-digoxigenin antibody (Abcam, clone 21H8) diluted 1:10,000 in 1% BSA in PBS for 2 h at RT. After washing 3 times for 10 min in TBS with 0.01% Tween, the slides were incubated for 1 h with a streptavidin-Alexa Fluor 488 conjugate (Invitrogen) and a goat anti-mouse Alexa Fluor 568 antibody (Invitrogen), both diluted to 1:500 in 1% BSA. Samples were washed in TBS with 0.01% Tween as before and mounted in Vectashield with DAPI. For all experiments involving RNAi, the knockdown was always verified by western-blot and the VSG derepression phenotype confirmed by IFA prior to FISH analysis.
Imaging and image analysis
For wide field microscopy, cells were analyzed using a Zeiss Axiovert 200M microscope with an AxioCam MRm camera and the ZEN Pro software (Carl Zeiss, Germany). The images were acquired as z-stacks (0.1-0.2 μm) and further deconvolved using the fast iterative algorithm in Zen Pro. For super resolution microscopy, cells were analyzed using a Leica TCS SP8 confocal laser scanning microscope in Hyvolution Mode and the Leica Application Suite X (LASX) software (Leica, Germany) or a Zeiss 880 Airyscan and the Zeiss ZEN software (Carl Zeiss, Germany). The Hyvolution mode allows super resolution level images, general used settings: highest resolution / lowest speed; pinhole 0.5. All representative images obtained by super resolution microscopy correspond to maximal 3D projections by brightest intensity of stacks of approximately 30 slices of 0.1 μm - Images with DNA in grey. VEX1, VEX2 and tSNAP foci and Pol I nucleolar and ESB signals could be detected in over 85-90% of nuclei. Counts in total cells or specific cell cycle phases were performed typically in >200 or >100 nuclei, respectively. All quantifications are averages or representative of at least two biological replicates and independent experiments (details for specific experiments can be found in the Source Data file). Pearson’s correlation coefficient (PCC) was applied as a statistical measure of colocalization 51 . Overlapping, adjacent and separate foci presented a PCC in the following ranges: ≥ 0.5 / ≤ 1, ≥ -0.5 / < 0.5, ≥ -1 / < -0.5, respectively. Regarding the distance measurements between the ESB and tSNAP compartment ( Extended Data Fig. 2c and 4b , ‘inside edge’ distance), a control measurement ( Extended Data Fig. 2b ; Extended Data Fig. 6d , ‘outside edge’ distance) was performed to ensure that changes in the distance between the two protein condensates following cell cycle progression or VEX RNAi were not a consequence of changes in the diameter of the foci. For the ESB / tSNAP localization following VEX2 or VEX1 / VEX2 RNAi ( Fig. 4a-b ; Extended Data Fig. 6c-d ), all the imaging and analyses were performed at 12 h post-induction, a timepoint where there was sufficient VEX2 knockdown ( Extended Data Fig. 6b ) but both nucleolar Pol I and the ESB could be detected in > 85% of cells; the ESB is not detectable at later time points 18 . Moreover, the ESB / tSNAP localization analyses following VEX RNAi or sinefungin treatment were restricted to G1 cells to exclude any cell cycle bias, as these protein condensates can separate during S phase ( Fig. 1c ; Extended Data Fig. 2 a-c ). In approximately 75% of G2 cells, two ESBs could be detected; the n values provided in the figures ( Fig. 1c ; Extended Data Fig. 2b-c ) correspond to ESB / tSNAP pairs (the number of nuclei is stated in the legend). All signal quantifications were performed as follows: corrected fluorescence = integrated density − (selected area x mean fluorescence of background readings). For all quantifications, images were acquired with the same settings and equally processed. All the images were processed and scored using Fiji v. 2.0.0. 52 , using stacks of approximately 30 slices of 0.1 μm; except Fig. 4d and Extended Data Fig. 7b , where the analysis was performed using Imaris 9.5 (Oxford Instruments). Briefly, 3D composites were loaded into Imaris 9.5, the DAPI channel was used to segment the nuclei; VSG expression site foci were segmented in the 50 bp repeats channel; diameter, area, signal intensity and volume were determined for all foci in all nuclei, the foci average number and volume distribution in the parental population versus VEX2 RNAi is depicted in Extended Data Fig. 7b . Foci with a size ≥0.2 μm 3 were defined as VSG ES clusters. For all experiments involving RNAi, the knockdown was always verified by western-blot and the VSG derepression phenotype confirmed by IFA and/or FACS analysis. RNA-Seq RNA isolation : The RNA-seq experiment and data analysis was performed as described previously 53 , using three replicates each for VSG-2 and VSG-13 expressing cells. 45 million cells were harvested per replicate at 1,500 x g and 4 °C for 10 min. Cells were washed with 1× TDB (5 mM KCl, 80 mM NaCl, 1 mM MgSO 4 , 20 mM Na 2 HPO 4 , 2 mM NaH 2 PO 4 , 20 mM glucose pH 7.4). RNA isolation was performed using the NucleoSpin RNA kit (Macherey-Nagel; cat. no. 740955.10) according to the manufacturer’s instructions with minor changes. 3.8 μl of 1 M RNAse-free dithiothreitol (Sigma-Aldrich; cat. no. 10197777001) and 1 μl of 1:10 Ambion ERCC RNA Spike-In Mix (ThermoFisherScientific; cat. no. 4456739) was added to the cell lysis buffer prior to use. Removal of ribosomal RNA : rRNA was removed by hybridization as described previously 53 . All solutions were kept free from nucleases. For each hybridization reaction, 2 μg of total RNA was mixed with 10 μl of formamide (SigmaAldrich; cat. no. F9037-100ML), 2.5 μl of 20× SSC (3 M NaCl, 0.3 M sodium citrate, the pH was adjusted to 7.0 with HCl), 5 μl of 0.005 M EDTA pH 8 (stock solution 0.5 M; ThermoFisherScientific; cat. no. AM9260G), 2.48 μl of 100 μM rRNA depletion mix (total 4 μg of oligos) and RNAse-free water (ThermoFisherScientific; cat. no. AM9938) to a total volume of 50 μl. Hybridization was performed for 5 min at 80 °C, ramp down to 25 °C at intervals of 5 °C per minute. Subsequently, 2 μl of RNAse-OUT (ThermoFisherScientific; cat. no. 10777019) and 50 μl of 1x SCC containing 20% formamide were added. Dynabead MyOne Streptavidin C1 beads (ThermoFisherScientific; cat. no. 65001) were prepared as recommended by the manufacturer for RNA applications and immobilization of nucleic acids. Three rounds of oligo capture were performed, using 120 μl (1.2 mg) of magnetics beads per round. The resulting supernatant, containing rRNA-depleted RNA, was purified using RNeasy MinElute CleanUp Kit (QIAGEN; cat. no. 74204). Depletion of rRNAs was evaluated on a 1.2% TBE-agarose gel. cDNA synthesis, library preparation and sequencing : Synthesis of cDNA was performed using NEBNext Ultra Directional RNA Library Prep Kit from Illumina (New England Biolabs; cat. no. E7420) according to the manufacturer’s instruction. The concentration of cDNA was measured using Qubit dsDNA HS Assay Kit (Invitrogen, cat. no. Q32854 ) and a Qubit 2.0 Fluorometer (Invitrogen; cat. no. Q32866 ). To generate strand-specific RNA-seq libraries, uracil excision and removing of the second strand was performed prior to conversion of Y-shaped adapters. Therefore, 3 μl of USER enzyme (New England Biolabs; cat. no. M5505) were mixed with 16 μl of adapter-ligated DNA, 1 μl of TruSeq PCR primer cocktail (50 μM) and 20 μl of KAPA HiFi HotStart ReadyMix (KAPA Biosystems, cat. no. KK2601). USER digestion was performed at 37 °C for 15 min, followed by the published amplification protocol. Library concentrations were determined in duplicate using Qubit dsDNA HS Assay Kit (Invitrogen, cat. no. Q32854 ) and a Qubit 2.0 Fluorometer (Invitrogen, cat. no. Q32866 ) and quantified using the KAPA Library Quantification Kit (KAPA Biosystems, cat. no. KK4824) according to the manufacturer’s instruction. Strand-specific RNA-sequencing libraries were sequenced in paired-end mode on an Illumina NextSeq 500 sequencer (2 × 75 cycles). Processing of sequencing data : The sequencing datasets were mapped to the TbruceiLister427_2018 genome assembly (release 43, downloaded from TriTrypDB 54 ) using BWA-mem 55 . The alignments were converted from SAM to BAM format, sorted, indexed and filtered by alignment quality (q>0) using SAMtools version 1.9 44 . To visualize read coverage, the number of reads was normalized per billion mapped reads and coverage files were generated in the wiggle format using COVERnant version 0.3.1with the subcommand ratio 56 . In situ Hi-C In situ Hi-C was performed as previously described 7 . 2 × 10 8 cells were collected per replicate and resuspended in 40 ml of 1× trypanosome dilution buffer (1× TDB; 0.005 M KCl, 0.08 M NaCl, 0.001 M MgSO 4 × 7H 2 O, 0.02 M Na 2 HPO 4 , 0.002 M NaH 2 PO 4 × 2H 2 O, 0.02 M glucose) or 1× PBS (insect stage cells). Cells were fixed in the presence of 1% formaldehyde for 20 min at room temperature by addition of 4 ml of 11% formaldehyde solution (50 mM Hepes-KOH pH 7.5, 100 mM NaCl, 1 mM EDTA pH 8.0, 0.5 mM EGTA pH 8.0, 11% formaldehyde). The reaction was stopped by addition of 3 ml of 2 M glycine and incubation for 5 min at room temperature and 15 min on ice. Cells were washed twice in 1× TDB for bloodstream form cells or 1× PBS for insect stage cells, respectively, and the cell pellet was snap-frozen in liquid nitrogen. Cells were resuspended in 1 ml of permeabilization buffer (100 mM KCl, 10 mM Tris pH 8.0, 25 mM EDTA) supplemented with protease inhibitors (1.5 mM pepstatin A, 4.25 mM leupeptin, 1.06 mM PMSF, 1.06 mM TLCK) and digitonin (200 μM final concentration) and incubated for 5 min at room temperature. Cells were washed twice in 1× NEBuffer3.1 (NEB, B7003S) and resuspended in 342 μl of 1× NEBuffer3.1. After addition of 38 μl of 1% SDS, and an incubation at 65 °C for 10 min, SDS was quenched by addition of 43 μl of 10% Triton-X 100 (Sigma). Incubation was continued at room temperature for 15 min. Another 35 μl of water, 13 μl of 10× NEBuffer3.1 and 100 units of MboI (NEB, R0147M) were added and the chromatin was digested at 37 °C overnight while shaking. To inactivate MboI, the sample was incubated at 65 °C for 20 min. Restriction fragments were biotinylated by supplementing the reaction with 60 μl of fill-in mix (0.25 mM biotin-14-dATP (Life Technologies, 19524016), 0.25 mM dCTP, 0.25 mM dGTP, 0.25 mM dTTP (Fermentas), 40 U of DNA polymerase I, large (Klenow) fragment (NEB, M0210)) and incubation at 23 °C for 4 h. The end-repaired chromatin was transferred to 665 μl of ligation mix (1.8% Triton-X 100, 0.18 mg BSA, 1.8× T4 DNA Ligase Buffer (Invitrogen, 46300018) and 5 μl of T4 DNA ligase (invitrogen, 15224025) were added. The ligation was performed for 4 h at 16 °C with interval shake. Crosslinks were reversed by adding 50 μl of 10 mg/ml proteinase K (65 °C for 4 h) following addition of another 50 μl of 10mg/ml proteinase K, 80 μl of 5 M NaCl and 70 μl of 10% SDS (65 °C, overnight). DNA was precipitated with ethanol and resuspended in 257 μl of TLE (10 mM Tris-HCl, 0.1 mM EDTA, pH 8.0). SDS was added to a final concentration of 0.1% and the sample was split among two tubes for sonication (Covaris S220; microtubes, 175 W peak incident power, 10% duty factor, 200 cycles per burst, 240 s treatment). The samples were recombined and the volume was adjusted to 300 μl with TLE. Fragments between 100 and 400 bp in size were selected using Agencourt AMPure XP beads (Beckman Coulter), according to the manufacturer’s instructions. The DNA fragments were eluted off the beads in 55 μl of TLE. For end-repair and biotin removal from un-ligated ends, 70 μl of end-repair mix was added (1× Ligation buffer (NEB), 357 μM dNTPs, 25U T4 PNK (NEB, M0201), 7.5U T4 DNA polymerase I (NEB, M0203), 2.5U DNA polymerase I, large (Klenow) fragment (NEB, M0210)) and incubated for 30 min at 20 °C and 20 min at 75 °C. To inactivate the enzymes, EDTA was added to a final concentration of 10 mM. To isolate biotin-labelled ligation junctions, 50 μl of 10 mg/ml Dynabeads MyOne Streptavidin C1 (Life Technologies, 65001) were washed with 400 μl of 1× Tween washing buffer (TWB; 5 mM Tris-HCl pH 7.5, 0.5 mM EDTA, 1 M NaCl, 0.05% Tween-20), collected with a magnet, resuspended in 400 μl of 2× binding buffer (10 mM Tris-HCl pH 7.5, 1 mM EDTA, 2 M NaCl) and added to the sample suspended in 330 μl TLE. Biotinylated DNA was bound to the beads by incubating the sample for 15 min at room temperature with slow rotation. Subsequently, the DNA-bound beads were captured with a magnet, washed twice with 400 μl of 1× binding buffer, washed once in 100 μl of 1× TLE T4 ligase buffer and resuspeded in 41 μl of TLE. For polyadenylation, 5 μl of 10× NEBuffer2.1, 1 μl of 10 mM dATP and 3 μl of 5 U/μl of Klenow fragment (3′→ 5′ exo (-)) (NEB, M0212) were added and the sample was incubated for 30 min at 37 °C followed by a deactivation step at 65 °C for 20 min. Beads were collected with a magnet, washed once with 400 μl 1× Quick ligation buffer (NEB, M2200) and resuspended in 46.5 μl of 1× Quick ligation buffer (NEB, M2200). 2.5 μl of DNA Quick ligase (NEB, M2200) and 0.5 μl of 50 μM annealed TruSeq adapters were added and incubated for 1 h at room temperature. Beads were separated on a magnet, resuspended in 400 μl of 1× TWB and washed for 5 min at room temperature with rotation. Beads were washed on the magnet with 200 μl 1× binding buffer and 200 μl of 1× NEBuffer2.1 and resuspended in 20 μl of 1× NEBuffer2.1. The library was amplified in eight separate reactions of 50 μl. Per reaction, 1.5 μl of 25 μM TruSeq PCR primer cocktail (TruSeq PCR primer cocktail_F, 5′-AATGATACGGCGACCACCGAG-3′; TruSeq PCR primer cocktail_R; 5′-CAAGCAGAAGACGGCATACGAG-3′), 25 μl of 2× Kapa HiFi HotStart Ready Mix (Kapa Biosystems, KR0370) and 21.5 μl of water were added to 2 μl of library bound to the beads. Amplification was performed as follows: 3 min at 95 °C, 5 cycles of 20 s at 98 °C, 30 s at 63 °C and 30 s at 72 °C, 1 cycle of 1 min at 72 °C, hold at 4 °C. The PCR reactions were pooled and the beads were removed from the supernatant using a magnet. The library was purified by addition of 1.5 volumes of Agencourt AMPure XP beads (Beckman Coulter), according to the manufacturer’s instructions. The sample was eluted off the beads using 25 μl of 1× TLE buffer, transferred to a fresh tube and the concentration was determined using Qubit (Qubit dsDNA HS Assay Kit, Thermo Fisher) and qPCR (KAPA SYBR FAST qPCR Master Mix, Kapa Biosystems), according to the manufacturer’s instructions. Library size distributions were determined on a 5% polyacrylamide gel. Paired-end 75-bp sequencing was carried out using the Illumina NextSeq 500 system with mid or high output NextSeq 500/550 kits v.2.5 according to the manufacturer’s instructions. Mapping of Hi-C reads and generation of interaction matrices Reads were mapped to a modified version of the TbruceiLister427_2018 genome assembly (downloaded from TriTrypDB, release 43) containing the following modifications. For all Hi-C experiments, we masked a newly discovered misassembly in bloodstream expression site 2 (BES2) with Ns. For Hi-C experiments in 2T1-control 36 and VEX2 knockdown cells, we added the transfected constructs as separate contigs to the genome. The construct sequences, as well as the modified genome have been deposited together with the results of the analyses under https://doi.org/10.5281/zenodo.3628212 . Mapping, filtering, normalization and read counting were performed by the mHi-C pipeline as described in 19 . We modified the pipeline to be compatible with the T. brucei genome assembly and also incorporated a merging step for the individual replicates after the removal of duplicate reads, but before data normalization (step 4) in order to avoid the introduction of any bias by the merge. We chose ICEing as the normalization method and finally filtered the mHi-C outcome by the posterior probability of 0.6 (i.e. reads are assigned to a bin with a likelihood of at least 60%). Downstream analyses such as normalizing for the different ploidy within the T. brucei genome assembly, have been implemented with in-house scripts. The digestion of the reference genome with the restriction site has been implemented using HiC-Pro Utilities 57 . All scripts necessary to reproduce the Hi-C analyses can be found at: https://github.com/bgbrink/PRJEB35632 .
Virtual 4C analysis
To visualize interactions between one genomic region (viewpoint) and all other genomic sites, relevant bins were extracted from a 20-kb or 50-kb Hi-C matrix. An average interaction value for every genomic bin was calculated if the viewpoint regions spanned more than one bin. The coordinates that define the different viewpoints used in this study are shown in Supplementary Information sheet 2 . To determine the relative interaction frequency of a viewpoint with chromosome cores and subtelomeres, the average interaction frequency of the viewpoint with each chromosome core and subtelomere was calculated based on the relative interaction frequencies extracted by virtual 4C analysis. The ratio between the average interaction frequency (core) and the average interaction frequency (subtelomeres) was calculated for each chromosome and plotted as one dot. The virtual 4C analysis has been implemented using HiC sunt dracones ( https://doi.org/10.5281/zenodo.3570496 ). All scripts necessary to reproduce the Hi-C analyses can be found at: https://github.com/bgbrink/PRJEB35632 .
Statistical analysis
All statistical analysis was performed using GraphPad Prism Software (version 7.0). A detailed summary of n and p values for all the analyses performed in this study is provided as a Source Data file.
Resources and Reagents
All unique materials are available on request.
Supplementary Material Siegel TPR File Source Data ED Fig. 2 Source Data ED Fig. 4 Source Data ED Fig. 5 Source Data ED Fig. 5a Source Data ED Fig. 6 Source Data ED Fig. 6a Source Data ED Fig. 7 Source Data Fig. 1 Source Data Fig. 3 Source Data Fig. 4 Supplementary Data Supplementary Information
Data and materials availability
High-throughput sequencing data
(Hi-C and RNA-Seq) generated for this study have been deposited at GitHub ( https://github.com/bgbrink/PRJEB35632 ) and in the European Nucleotide Archive (ENA) under primary accession number PRJEB35632, respectively. Previously published ChIP-seq and RNA-Seq data that were used for this study are publicly available at the European Nucleotide Archive www.ebi.ac.uk/ena (accession no. PRJEB25352 and PRJEB21615, respectively). Processed data and results are available under https://doi.org/10.5281/zenodo.3628212 . All statistical analysis and unprocessed western blots are provided in the Source Data files.
📊 Figures
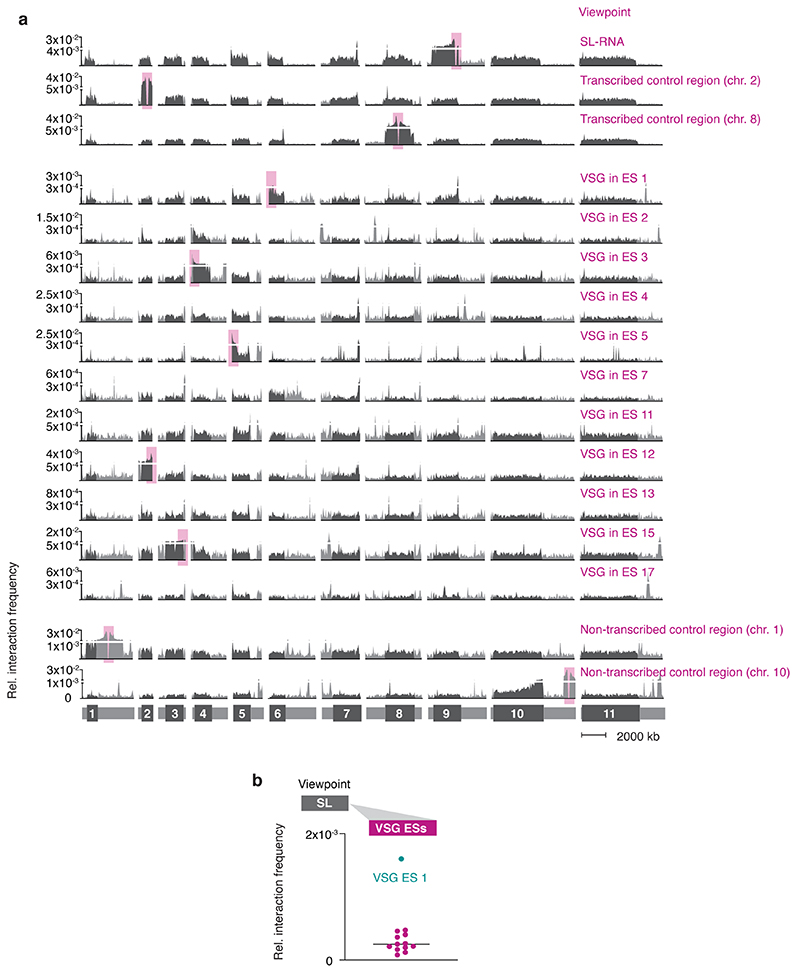
Extended Data Fig. 1
Genome-wide interaction frequencies of VSG genes in expression sites and the SL-RNA locus.
a, Hi-C (virtual 4C) analysis with locations of viewpoints marked by pink boxes. Viewpoints VSG ES 4, 7, 11 and 17 are located on intermediate chromosomes that are not depicted in this figure. Interac...
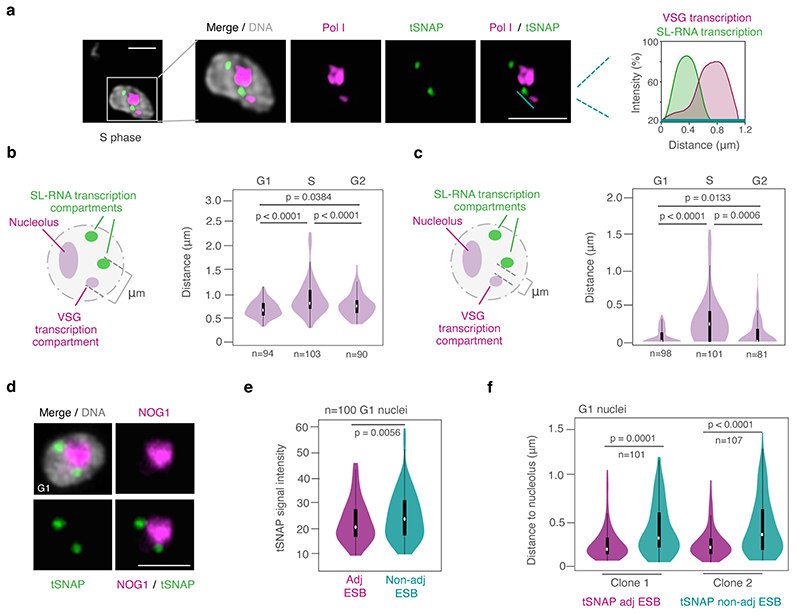
Extended Data Fig. 2
Dynamic association between the active VSG gene and the spliced leader RNA (SL) array transcription compartments.
a, Immunofluorescence-based colocalization studies of tSNAP myc (SL-RNA transcription compartment) and a nucleolar and active VSG transcription compartment marker (Pol I, largest subunit) using super ...
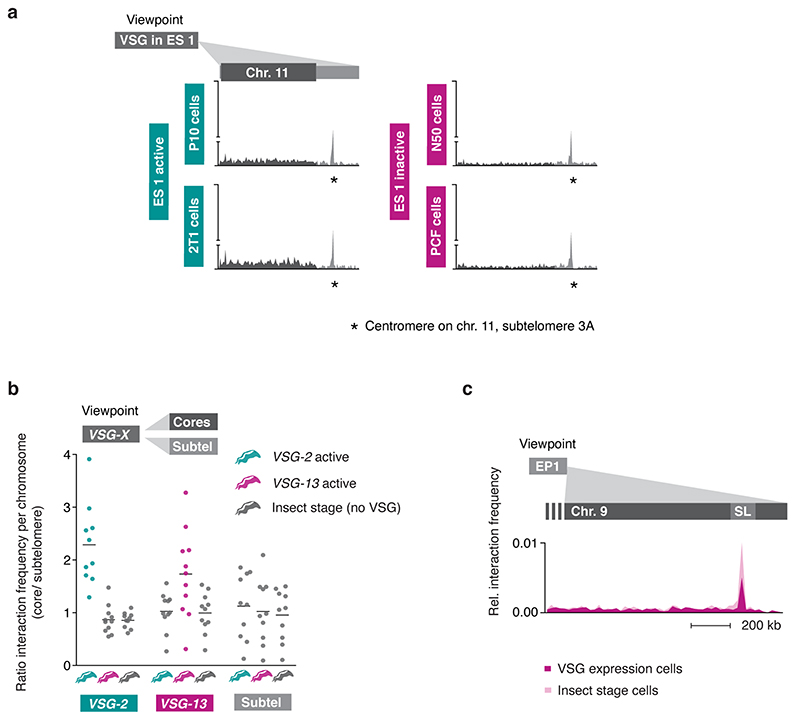
Extended Data Fig. 3
Changes in DNA-DNA interactions following a change in VSG isoform expression.
a, Virtual 4C analysis, viewpoint: VSG-2 in expression site 1. Relative interaction frequencies between the viewpoint and chr. 11 are plotted. Bin size 20 kb. * marks the centromere on chr. 11 (locate...
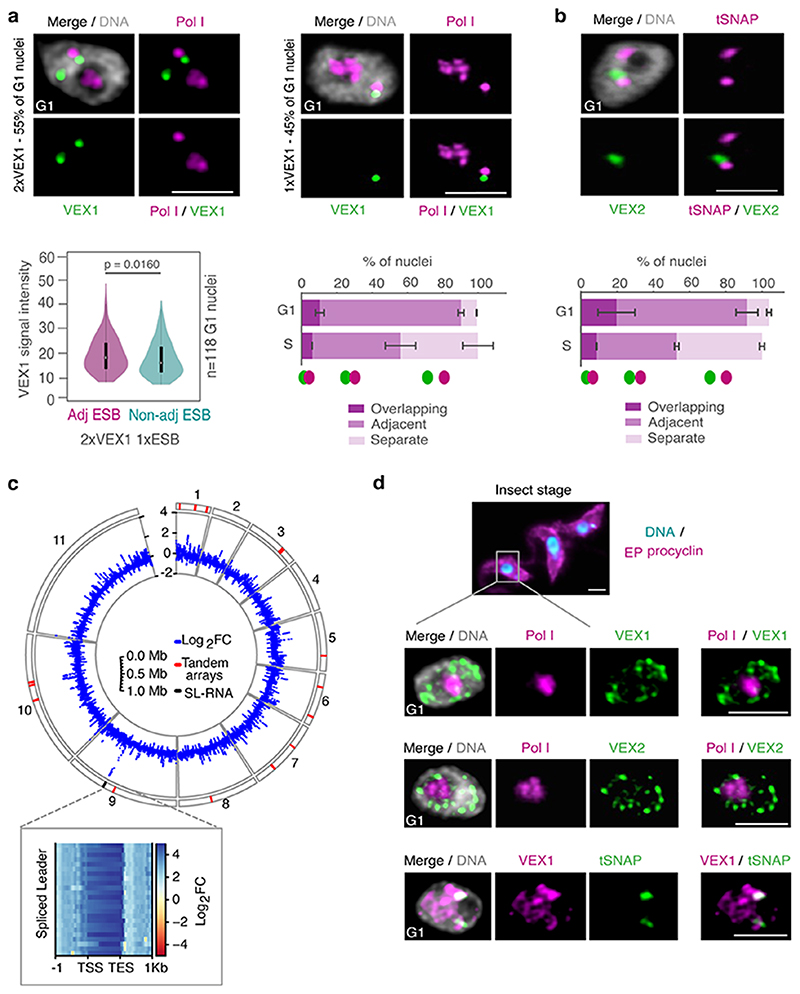
Extended Data Fig. 4
The VEX complex associates with both the active VSG gene and the Spliced Leader (SL) locus in a cell cycle and developmental stage-dependent manner.
a-b, Immunofluorescence-based colocalization studies of VEX1 myc / Pol I and GFP VEX2 / tSNAP myc in bloodstream form cells. tSNAP and Pol I were used as markers for the SL-RNA and VSG transcription c...
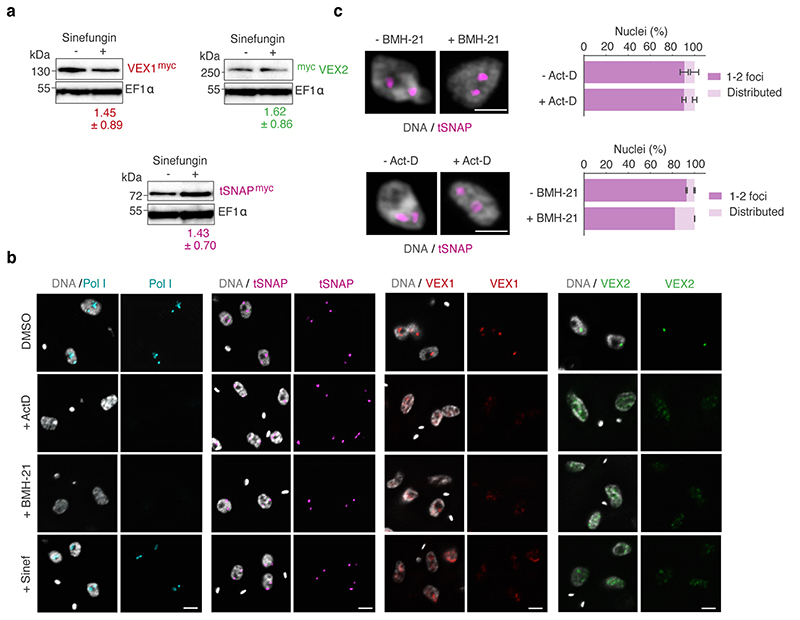
Extended Data Fig. 5
VEX1 and VEX2, but not tSNAP, delocalize following transcription or splicing inhibition.
a, Western-blot analysis of VEX1 myc , myc VEX2 and tSNAP myc before and after sinefungin treatment (5 u03bcg ml -1 for 30 min at 37 u00b0C), which blocks trans -splicing in trypanosomes. The values i...
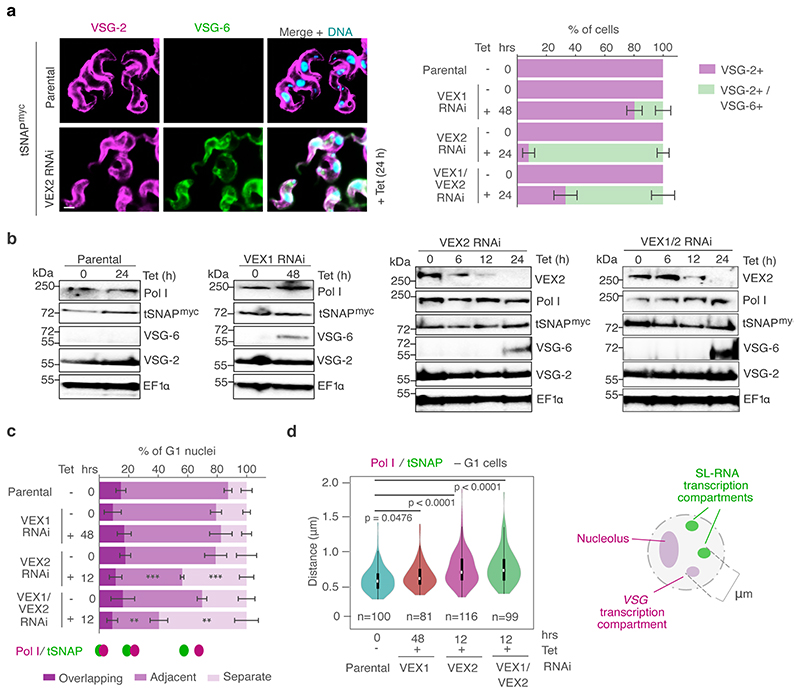
Extended Data Fig. 6
Pol I and tSNAP expression and localization following knockdown of the VEX complex.
a, Immunofluorescence-based analysis of VSG expression following tetracycline (Tet) inducible VEX1 knockdown, VEX2 knockdown or VEX1/VEX2 knockdown. In unperturbed cells (parental strain), VSG-2 (mage...
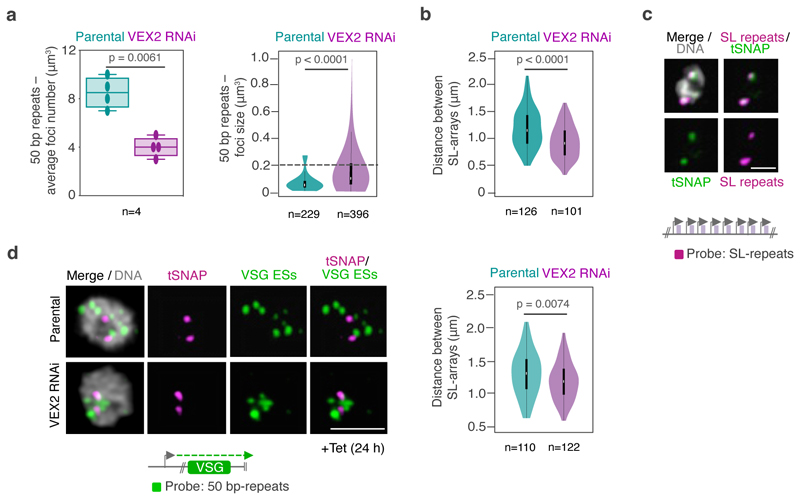
Extended Data Fig. 7
The exclusive association between the active VSG and the SL-locus is VEX2-dependent.
a-b, DNA fluorescence in situ hybridization (FISH) and super resolution microscopy based colocalization studies of the SL-RNA transcription compartments (probe: digoxigenin labeled SL repeats) and VSG...
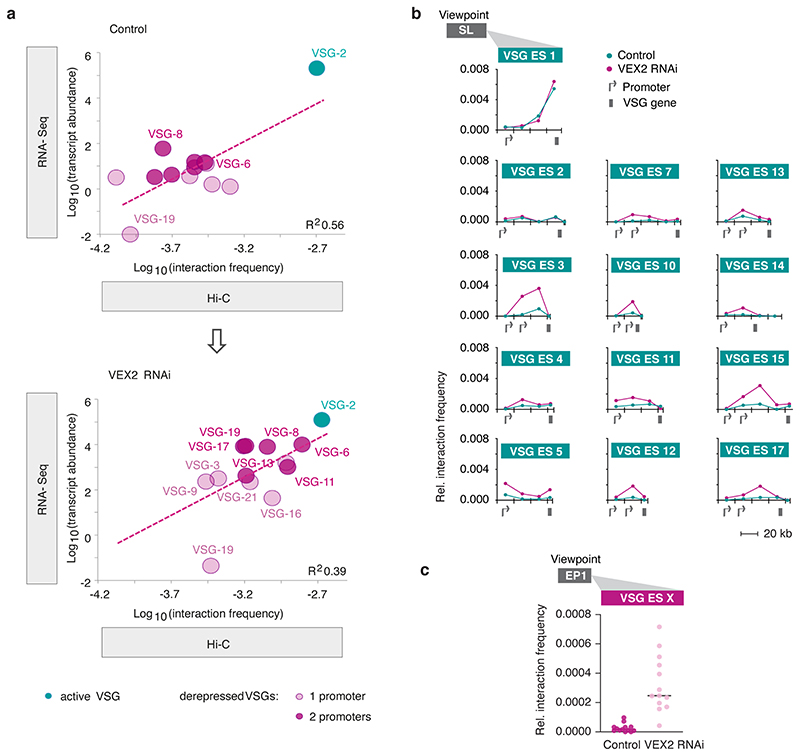
Extended Data Fig. 8
Genome-wide changes in VEX2 depleted cells.
a, Correlation between the average interaction frequency of VSG expression-sites as viewpoint with the SL-RNA locus and VSG expression in reads per kilobase per million (RNA-seq data from 18 ) in cont...
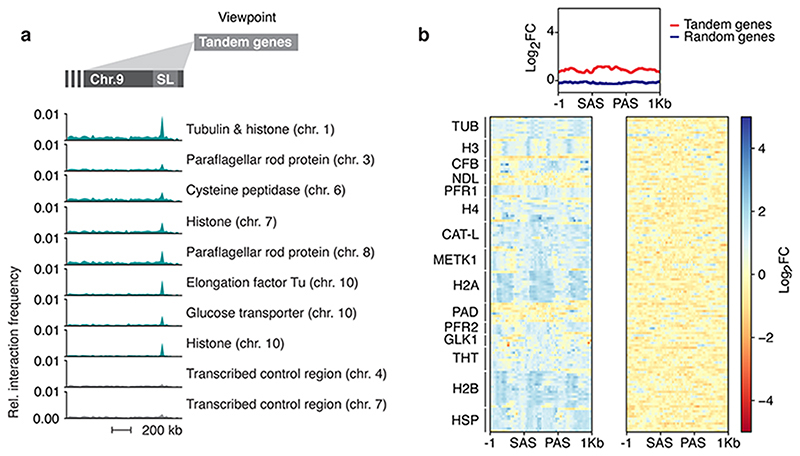
Extended Data Fig. 9
Tandem arrays interact with the Spliced Leader (SL) locus.
a, Hi-C (virtual 4C) analysis, viewpoint: different tandem gene arrays and control sites. Relative interaction frequencies between the different viewpoints and the SL-RNA locus are plotted. Bin size 2...
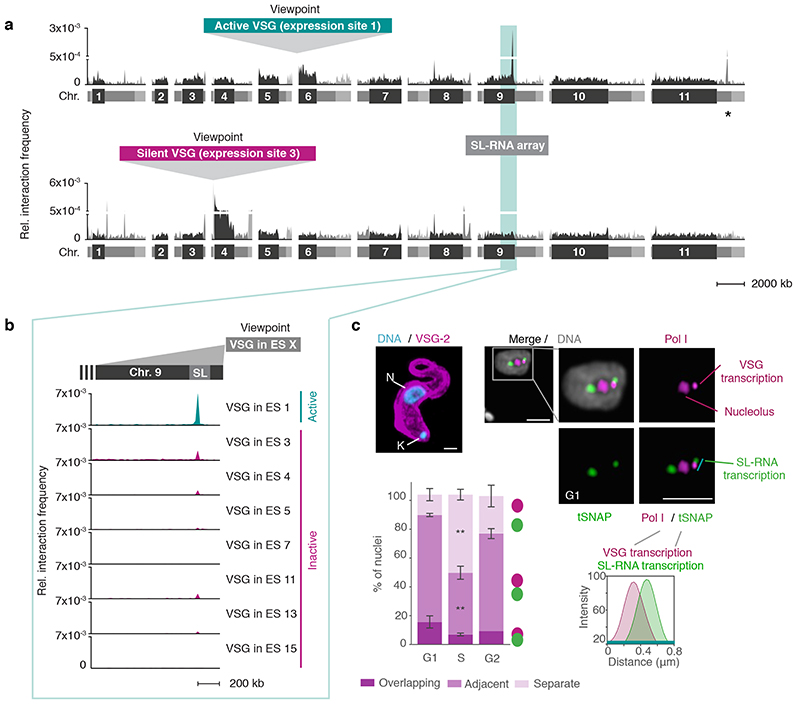
Fig. 1
The active VSG expression site (ES) stably interacts with the spliced leader RNA (SL) array.
a, Hi-C (virtual 4C) analysis, viewpoints: active VSG gene in ES 1 ( VSG-2 , top panel) and silent VSG gene in ES 3 ( VSG-6 , bottom panel). Relative interaction frequencies between the viewpoint and ...
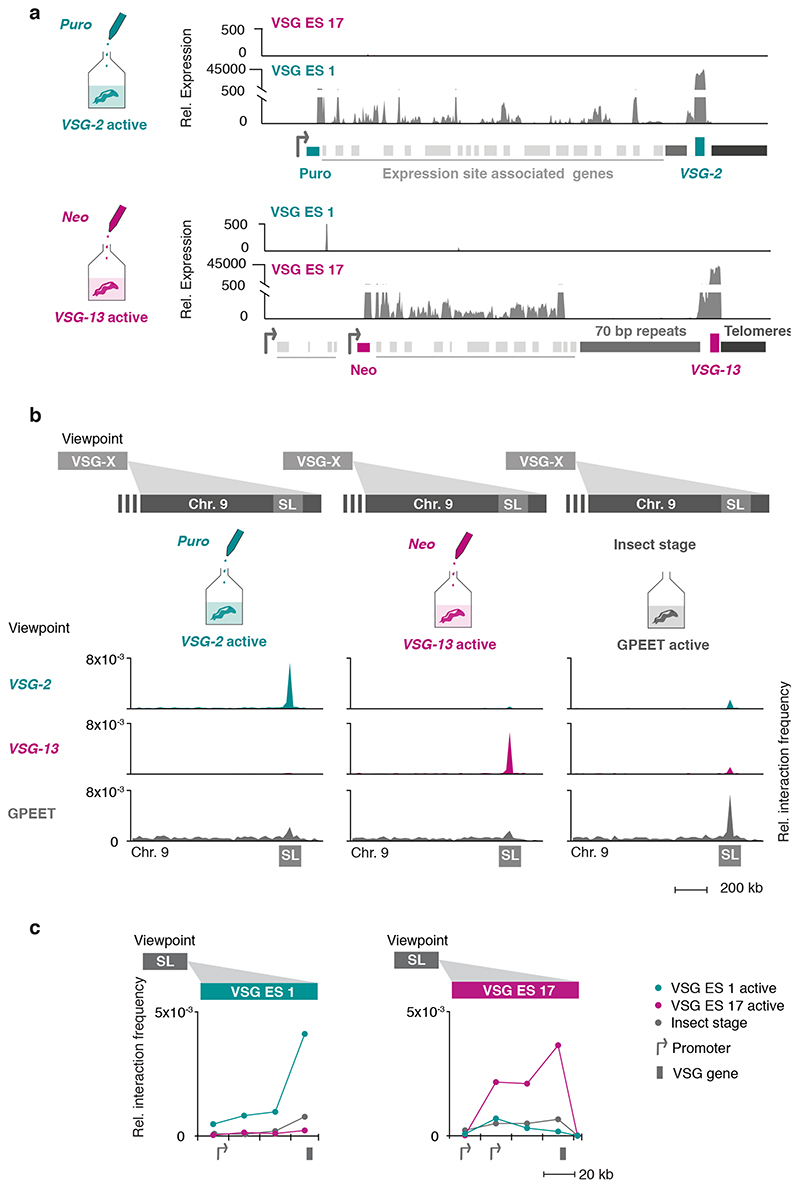
Fig. 2
The interaction between the active VSG gene and the SL-RNA locus is dynamic and changes during a switch in VSG expression.
a, Transcriptome analyses of isogenic cell lines after selection with puromycin (active: VSG-2 ), top panel, or neomycin (active: VSG-13 ), bottom panel. For each condition, the average of three biolo...
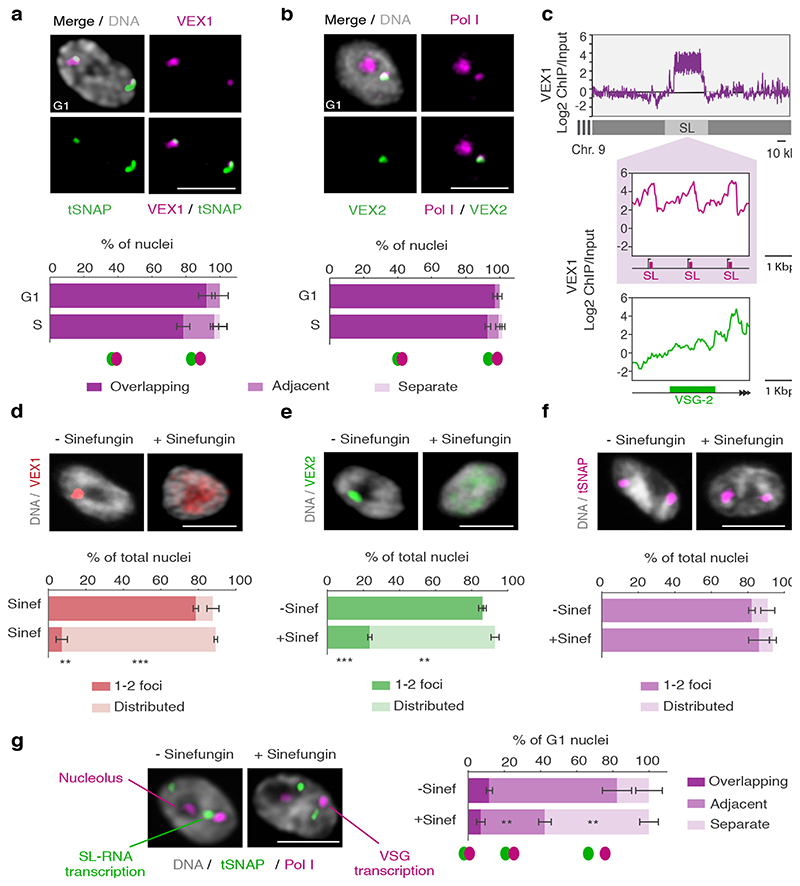
Fig. 3
The VEX complex associates with both the active VSG gene and the Spliced Leader (SL) locus in a splicing-dependent manner.
a-b, Immunofluorescence-based colocalization studies of VEX1 myc / tSNAP GFP and GFP VEX2 / Pol I. tSNAP and Pol I are used as markers for the SL-RNA and VSG transcription compartments, respectively. ...
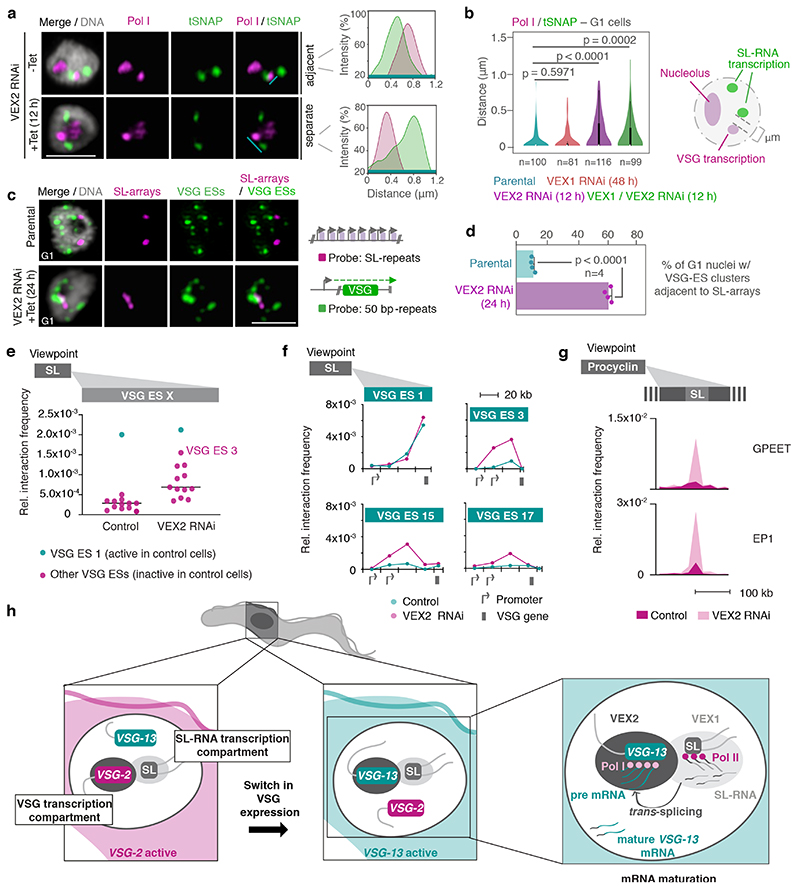
Fig. 4
The exclusive association between the active VSG gene and the SL-locus is VEX2-dependent.
a-b, Immunofluorescence and super resolution microscopy based colocalization studies of tSNAP myc (SL-RNA transcription compartment) and Pol I (nucleolus and extranucleolar reservoir) following VEX1, ...
Figure images are served from the NIH/NLM PubMed Central Open Access Subset or Europe PMC; copyright remains with the publishers and authors.
💬 Discussion
0 commentsNo comments yet. Be the first to start a discussion!
Leave a Comment