Abstract
The cytoskeleton of eukaryotic cells is primarily composed of networks of filamentous proteins, F-actin, microtubules, and intermediate filaments. Interactions among the cytoskeletal components are important in determining cell structure and in regulating cell functions. For example, F-actin and microtubules work together to control cell shape and polarity, while the subcellular organization and transport of vimentin intermediate filament (VIF) networks depend on their interactions with microtubules. However, it is generally thought that F-actin and VIFs form two coexisting but separate networks that are independent due to observed differences in their spatial distribution and functions. In this paper, we present a closer investigation of both the structural and functional interplay between the F-actin and VIF cytoskeletal networks. We characterize the structure of VIFs and F-actin networks within the cell cortex using structured illumination microscopy and cryo-electron tomography. We find that VIFs and F-actin form an interpenetrating network (IPN) with interactions at multiple length scales, and VIFs are integral components of F-actin stress fibers. From measurements of recovery of cell contractility after transient stretching, we find that the IPN structure results in enhanced contractile forces and contributes to cell resilience. Studies of reconstituted networks and dynamic measurements in cells suggest direct and specific associations between VIFs and F-actin. From these results, we conclude that VIFs and F-actin work synergistically, both in their structure and in their function. These results profoundly alter our understanding of the contributions of the components of the cytoskeleton, particularly the interactions between intermediate filaments and F-actin.
🔬 Techniques
🔭 Microscopes
💻 Software
✨ Fluorophores
🧪 Sample Preparation
🔬 Cell Lines
🏭 Microscope Brands
🧪 Reagent Suppliers
🔎 Objectives
💻 Software Details
💾 Data Repositories
🏷️ Research Resource Identifiers (RRIDs)
Verified research resources used in this paper:
🏛️ Research Organizations (ROR)
Affiliated research institutions:
📋 Methods
Cell Culture. WT MEFs and Vim −/− MEFs are kindly provided by J. Eriksson, University of Turku and Abo Akademi University, Turku, Finland, and are maintained in DMEM with 25 mM Hepes and sodium pyruvate (Life Technologies) supplemented by 10% fetal bovine serum, 1% penicillin streptomycin, and nonessential amino acids. All cell cultures are maintained at 37 °C and 5% CO 2 . The vimentin-null MEFs expressing vimentin are created by PCR amplification of the vimentin coding sequence using CloneAmp polymerase (Clontech) from pcDNA4-vimentin (provided by J. Eriksson), and the coding sequence for Vimentin Y117L is amplified from pmCherry-C1-Vim Y117L (provided by H. Herrmann, German Cancer Research Center, Heidelberg, Germany) using the primers ggcgccggccggatccATGTCCACCAGGTCCGTGTCC and actgtgctggcgaaTTATTCAAGGTCATCGTGATGCTGAG. The PCR product is purified from an agarose gel and inserted into pBABE-hygro (pBABE-hygro is a gift from Hartmut Land and Jay P. Morgenstern, Imperial Cancer Research Fund, Lincoln's Inn Fields, London ( 46 ) [Addgene plasmid no. 1765; http://n2t.net/addgene:1765 ; RRID Addgene_1765]) cut with BamHI and EcoRI using In-Fusion (Clontech). Virus is produced by transfection of 293FT cells with pBABE-vimentin and pCL-Eco using Xfect transfection reagent (Clontech) and collection of supernatants 48 and 72 h posttransfection. The pooled virus supernatants are diluted in fresh complete medium and brought to 8 μg/mL polybrene prior to addition to vimentin-null MEFs. The virus supernatant is removed after 6 h and replaced with fresh culture medium. Twenty-four hours after the first application of virus supernatant, the process is repeated; 48 h following the second application of virus, the medium is replaced with fresh complete medium containing 200 μg/mL hygromycin. The selection medium is changed every 2 d for 7 d with the culture passaged as needed. Sample Preparation for Cryo-ET. MEFs expressing emerald-vimentin are cultured on glow-discharged holey carbon-coated EM grids (Au R2/1, 200 mesh, Quantifoil) for 16 h at 37 °C in a humidified CO 2 incubator. Cells are rinsed in PBS, fixed with 4% paraformaldehyde (PFA) for 5 min, and washed again in PBS. The cells are imaged by fluorescence microscopy (Leica DMI 4000B, Leica) using a 63x objective. Next, the grids are vitrified in liquid ethane after the addition of 10 nm gold fiducial markers (Aurion). Cryo-ET: Data Acquisition and Image Processing. Tilt series are acquired using a Titan Krios electron microscope (ThermoFisher) operated at 300 KeV and equipped with a K2 Summit direct electron detector (Gatan) mounted on a postcolumn energy filter (Gatan). Ten tilt series are acquired in a zero-loss energy mode with a 20-eV slit. The data are acquired at a magnification of 42,000× resulting in a pixel size of 0.17 nm in superresolution mode and a defocus of −3 µm. A bidirectional tilt scheme with a tilt range of ±60° and an increment of 3° is chosen, corresponding to 41 projections per tilt series and a total cumulative electron dose of ∼55 e/Å 2 . SerialEM 3.5.8 ( 47 ) is used for data acquisition. A correlative light and electron microscopy approach is used; namely, tilt series are acquired at positions where vimentin IFs are identified in the fluorescence microscopy images. The projection images are binned and subjected to motion correction using MotionCorr ( 48 ), resulting in a final pixel size of 3.4 Å. Next, tomograms are reconstructed in a size of 1,024 × 1,024 × 512 voxels (final voxel size 13.6 Å) using the TOM Toolbox ( 49 ). Both VIF and F-actin present in the tomograms are manually segmented using the Amira 5.6.0 software package (Thermo Fisher Scientific). This software is also used to analyze the distances between VIFs and F-actin and for visualization purposes. In addition, OriginPro 2018 software (OriginLab Corporation) is used for distance measurement evaluation and visualization. The distance is measured from the center of VIFs to the center of F-actin, and then the average radii of F-actin and VIFs are subtracted. The distance therefore represents only the space between the filaments. SIM. Mouse embryonic fibroblasts are seeded on #1.5 glass coverslips and fixed with 4% PFA for 10 min at room temperature (RT). The fixed cells are permeabilized with 0.1% Triton-X 100 for 10 min at RT and stained with chicken anti-vimentin (1:200, Biolegend) for 30 min in PBS containing 5% normal goat serum (RT). This is followed by incubation with goat anti-chicken Alexa Fluor 488 (1:400, Invitrogen) and Alexa Fluor 568 phalloidin (1:400, Invitrogen) in PBS for 30 min (RT). The coverslips containing the stained cells are mounted with ProLong Glass antifade mountant (Life Technologies) on microscope slides. Three-dimensional SIM is carried out with a Nikon N-SIM Structured Illumination microscope system (Nikon N-SIM, Nikon) using an oil immersion objective lens (CFI SR Apochromat 100×, 1.49 NA, Nikon). For 3D SIM, 10 optical sections are imaged at 100-nm intervals in the periphery of the cell. Each of the SIM images is a z stack maximum projection. The step size of z stack images is ∼100 nm, and two to four images are used to obtain the maximum projection. The combined images shown in Fig. 2 B – D , Right , have the clear appearance of the IPNs. Moreover, careful investigation of a z stack of the SIM images of the two networks also confirms the presence of the IPNs ( Movie S1 ). Raw SIM images are reconstructed with the N-SIM module of Nikon Elements Advanced Research with the following parameters: illumination contrast, 1.00; high-resolution noise suppression, 0.75; and out-of-focus blur suppression, 0.25. Brightness and contrast are adjusted for image presentation. Reconstitution of Purified F-Actin and VIFs. We extract vimentin from MEFs, which are grown in dishes and washed three times with PBS. Lysis buffer (0.6 M KCl; 10 mM MgCl 2 ; 1% TritonX-100; 1 mM PMSF) is added to the cells, and the lysate is placed in a homogenizer for 5 to 10 min. DNaseI is added at a concentration of 1 mg/mL to the lysate and then centrifuged at 1,600 × g for 15 min at 4 °C. The pellet is washed three times (5 mM EDTA; 0.2 mM PMSF in PBS) and suspended in disassembly buffer (8 M urea; 5 mM NaPO 4 pH 7.2; 1 mM PMSF; 0.2% mecaptoethanol) after which it is stirred for 45 min at RT. The suspension is centrifuged at 75,000 rpm for 30 min at 20 °C to clarify it. The supernatant is dialyzed overnight at RT against a large volume of buffer (0.1 mM 2-mercaptoethanol; 0.1 mM PMSF in PBS). The dialysate is used for further experiments. This procedure for isolating and reassembling VIFs is modified from a previously published protocol ( 50 ). We mix dialyzed vimentin, rhodamine-labeled G-actin (AR05, Cytoskeleton Inc.), and unlabeled G-actin (AKL99, Cytoskeleton Inc.) successively into the assembly buffer and let them equilibrate at 37 °C for 1 h. The assembly buffer is as follows: 10 mM Tris⋅HCl (pH 7.5), 2 mM MgCl 2 , 50 mM KCl, 1 mM ATP, 5 mM guanidine carbonate, 170 mM NaCl, and 1 mM DTT. We use glutaraldehyde (16220, Electron Microscopy Sciences) to fix filaments on a coverslip for 5 min and gently wash them using PBS buffer. To visualize VIFs, we stain them using a chicken polyclonal vimentin primary antibody (1:200, CPCA-Vim, Encor Biotechnology Inc.) and a goat anti-chicken secondary antibody (1:400, A-11039, Thermo Fisher Scientific) successively with each staining for 45 min at RT followed by washing with PBS buffer. The visualization of F-actin does not require antibody staining, as prelabeled G-actin is assembled together with unlabeled G-actin in the ratio of 1:4. We image the networks using a confocal microscope (LSM 510, Carl Zeiss). Cell Stretching and TFM. Collagen-coated polyacrylamide gels with a Young’s modulus of 2.4 kPa are prepared in 35-mm glass bottom dishes (In Vitro Scientific/CellVis) ( 16 ). Gels intended for TFM are prepared with 0.5 μm red fluorescent tracer particles embedded near their surface. Cells are sparsely seeded on the gels in the presence of culture medium and allowed to grow for 24 h before experiments are carried out. The cells are stretched using an indenter ring with a circular cross-section attached to an arm controlled by custom-written LabView code. When initiated, the indenter applies and holds a 10% strain around the selected cells for 3 s before being lifted back up. The measured strain field is precise, and there is no loss ( 20 ). Throughout the field of visualization, the imposed strain field is homogeneous and isotropic, with small deviations attributable to the traction forces exerted by the cell. In the absence of cells, the strains are isotropic, homogeneous, and with no discernable evidence of hysteresis. To perform TFM, a Leica epifluorescence microscope is used to image the tracer particles and the cells throughout the stretch and recovery period. Several images are taken before stretching to establish a baseline, and images are taken at designated intervals following the stretch to monitor recovery. At the end of the time, the cells are removed by trypsinization, and a reference set of images without attached cells is taken. Substrate displacements are analyzed by comparing the bead images with and without cells using particle image velocimetry in a custom MATLAB code. Traction forces are calculated by applying a Fourier transform to the displacement field ( 16 ). The contractile moment is determined as an average measure of contractile force for each individual cell. The contractile moment is a weighted sum of traction stresses exerted by an adherent cell upon its substrate ( 16 ). In the contractile moment, these traction stresses are weighted more heavily by the magnitude of the local contractile stress applied, the amount of area over which those stresses are applied, and the distance of those applied stresses from the cell centroid. As such, bigger stresses applied over bigger areas at bigger distances get the biggest weight. The traction map and the bead pattern map are a one-to-one mathematical mapping of one another through the Boussinesq solution ( 16 ). The pattern of bead displacements extends well beyond the cell boundaries due to elastic deformation of the substrate. However, the Boussinesq solution transforms those displacements into the distribution of traction forces exerted by the cell that give rise to those displacements. For the time-resolved TFM measurements, all the calculations are referenced to the null frame. FRAP. WT and Vim −/− MEFs are transfected with an EGFP-actin plasmid using Lipofectamine 2000 transfection agent (Invitrogen) and imaged on the third day. FRAP is performed ( 24 ). Briefly, transfected cells are bleached for 1 s using the FRAP module within the Leica SP5 confocal software and monitored for 30 s, acquiring an image every 0.5 s using a 63×/1.2NA water-immersion objective. The measured intensities are normalized to the prebleach intensities of the region of interest (ROI), and the recovery curve is normalized by a control ROI to account for sample bleaching during image acquisition. Since the brightness varies from cell to cell, we also normalize the intensities to prebleach levels. The intensity recovery is fit by I(t) = C − A * exp(−t/τ), where τ is the time constant and C is the immobile fraction.
Show full methods section
Cell Culture. WT MEFs and Vim −/− MEFs are kindly provided by J. Eriksson, University of Turku and Abo Akademi University, Turku, Finland, and are maintained in DMEM with 25 mM Hepes and sodium pyruvate (Life Technologies) supplemented by 10% fetal bovine serum, 1% penicillin streptomycin, and nonessential amino acids. All cell cultures are maintained at 37 °C and 5% CO 2 . The vimentin-null MEFs expressing vimentin are created by PCR amplification of the vimentin coding sequence using CloneAmp polymerase (Clontech) from pcDNA4-vimentin (provided by J. Eriksson), and the coding sequence for Vimentin Y117L is amplified from pmCherry-C1-Vim Y117L (provided by H. Herrmann, German Cancer Research Center, Heidelberg, Germany) using the primers ggcgccggccggatccATGTCCACCAGGTCCGTGTCC and actgtgctggcgaaTTATTCAAGGTCATCGTGATGCTGAG. The PCR product is purified from an agarose gel and inserted into pBABE-hygro (pBABE-hygro is a gift from Hartmut Land and Jay P. Morgenstern, Imperial Cancer Research Fund, Lincoln's Inn Fields, London ( 46 ) [Addgene plasmid no. 1765; http://n2t.net/addgene:1765 ; RRID Addgene_1765]) cut with BamHI and EcoRI using In-Fusion (Clontech). Virus is produced by transfection of 293FT cells with pBABE-vimentin and pCL-Eco using Xfect transfection reagent (Clontech) and collection of supernatants 48 and 72 h posttransfection. The pooled virus supernatants are diluted in fresh complete medium and brought to 8 μg/mL polybrene prior to addition to vimentin-null MEFs. The virus supernatant is removed after 6 h and replaced with fresh culture medium. Twenty-four hours after the first application of virus supernatant, the process is repeated; 48 h following the second application of virus, the medium is replaced with fresh complete medium containing 200 μg/mL hygromycin. The selection medium is changed every 2 d for 7 d with the culture passaged as needed. Sample Preparation for Cryo-ET. MEFs expressing emerald-vimentin are cultured on glow-discharged holey carbon-coated EM grids (Au R2/1, 200 mesh, Quantifoil) for 16 h at 37 °C in a humidified CO 2 incubator. Cells are rinsed in PBS, fixed with 4% paraformaldehyde (PFA) for 5 min, and washed again in PBS. The cells are imaged by fluorescence microscopy (Leica DMI 4000B, Leica) using a 63x objective. Next, the grids are vitrified in liquid ethane after the addition of 10 nm gold fiducial markers (Aurion). Cryo-ET: Data Acquisition and Image Processing. Tilt series are acquired using a Titan Krios electron microscope (ThermoFisher) operated at 300 KeV and equipped with a K2 Summit direct electron detector (Gatan) mounted on a postcolumn energy filter (Gatan). Ten tilt series are acquired in a zero-loss energy mode with a 20-eV slit. The data are acquired at a magnification of 42,000× resulting in a pixel size of 0.17 nm in superresolution mode and a defocus of −3 µm. A bidirectional tilt scheme with a tilt range of ±60° and an increment of 3° is chosen, corresponding to 41 projections per tilt series and a total cumulative electron dose of ∼55 e/Å 2 . SerialEM 3.5.8 ( 47 ) is used for data acquisition. A correlative light and electron microscopy approach is used; namely, tilt series are acquired at positions where vimentin IFs are identified in the fluorescence microscopy images. The projection images are binned and subjected to motion correction using MotionCorr ( 48 ), resulting in a final pixel size of 3.4 Å. Next, tomograms are reconstructed in a size of 1,024 × 1,024 × 512 voxels (final voxel size 13.6 Å) using the TOM Toolbox ( 49 ). Both VIF and F-actin present in the tomograms are manually segmented using the Amira 5.6.0 software package (Thermo Fisher Scientific). This software is also used to analyze the distances between VIFs and F-actin and for visualization purposes. In addition, OriginPro 2018 software (OriginLab Corporation) is used for distance measurement evaluation and visualization. The distance is measured from the center of VIFs to the center of F-actin, and then the average radii of F-actin and VIFs are subtracted. The distance therefore represents only the space between the filaments. SIM. Mouse embryonic fibroblasts are seeded on #1.5 glass coverslips and fixed with 4% PFA for 10 min at room temperature (RT). The fixed cells are permeabilized with 0.1% Triton-X 100 for 10 min at RT and stained with chicken anti-vimentin (1:200, Biolegend) for 30 min in PBS containing 5% normal goat serum (RT). This is followed by incubation with goat anti-chicken Alexa Fluor 488 (1:400, Invitrogen) and Alexa Fluor 568 phalloidin (1:400, Invitrogen) in PBS for 30 min (RT). The coverslips containing the stained cells are mounted with ProLong Glass antifade mountant (Life Technologies) on microscope slides. Three-dimensional SIM is carried out with a Nikon N-SIM Structured Illumination microscope system (Nikon N-SIM, Nikon) using an oil immersion objective lens (CFI SR Apochromat 100×, 1.49 NA, Nikon). For 3D SIM, 10 optical sections are imaged at 100-nm intervals in the periphery of the cell. Each of the SIM images is a z stack maximum projection. The step size of z stack images is ∼100 nm, and two to four images are used to obtain the maximum projection. The combined images shown in Fig. 2 B – D , Right , have the clear appearance of the IPNs. Moreover, careful investigation of a z stack of the SIM images of the two networks also confirms the presence of the IPNs ( Movie S1 ). Raw SIM images are reconstructed with the N-SIM module of Nikon Elements Advanced Research with the following parameters: illumination contrast, 1.00; high-resolution noise suppression, 0.75; and out-of-focus blur suppression, 0.25. Brightness and contrast are adjusted for image presentation. Reconstitution of Purified F-Actin and VIFs. We extract vimentin from MEFs, which are grown in dishes and washed three times with PBS. Lysis buffer (0.6 M KCl; 10 mM MgCl 2 ; 1% TritonX-100; 1 mM PMSF) is added to the cells, and the lysate is placed in a homogenizer for 5 to 10 min. DNaseI is added at a concentration of 1 mg/mL to the lysate and then centrifuged at 1,600 × g for 15 min at 4 °C. The pellet is washed three times (5 mM EDTA; 0.2 mM PMSF in PBS) and suspended in disassembly buffer (8 M urea; 5 mM NaPO 4 pH 7.2; 1 mM PMSF; 0.2% mecaptoethanol) after which it is stirred for 45 min at RT. The suspension is centrifuged at 75,000 rpm for 30 min at 20 °C to clarify it. The supernatant is dialyzed overnight at RT against a large volume of buffer (0.1 mM 2-mercaptoethanol; 0.1 mM PMSF in PBS). The dialysate is used for further experiments. This procedure for isolating and reassembling VIFs is modified from a previously published protocol ( 50 ). We mix dialyzed vimentin, rhodamine-labeled G-actin (AR05, Cytoskeleton Inc.), and unlabeled G-actin (AKL99, Cytoskeleton Inc.) successively into the assembly buffer and let them equilibrate at 37 °C for 1 h. The assembly buffer is as follows: 10 mM Tris⋅HCl (pH 7.5), 2 mM MgCl 2 , 50 mM KCl, 1 mM ATP, 5 mM guanidine carbonate, 170 mM NaCl, and 1 mM DTT. We use glutaraldehyde (16220, Electron Microscopy Sciences) to fix filaments on a coverslip for 5 min and gently wash them using PBS buffer. To visualize VIFs, we stain them using a chicken polyclonal vimentin primary antibody (1:200, CPCA-Vim, Encor Biotechnology Inc.) and a goat anti-chicken secondary antibody (1:400, A-11039, Thermo Fisher Scientific) successively with each staining for 45 min at RT followed by washing with PBS buffer. The visualization of F-actin does not require antibody staining, as prelabeled G-actin is assembled together with unlabeled G-actin in the ratio of 1:4. We image the networks using a confocal microscope (LSM 510, Carl Zeiss). Cell Stretching and TFM. Collagen-coated polyacrylamide gels with a Young’s modulus of 2.4 kPa are prepared in 35-mm glass bottom dishes (In Vitro Scientific/CellVis) ( 16 ). Gels intended for TFM are prepared with 0.5 μm red fluorescent tracer particles embedded near their surface. Cells are sparsely seeded on the gels in the presence of culture medium and allowed to grow for 24 h before experiments are carried out. The cells are stretched using an indenter ring with a circular cross-section attached to an arm controlled by custom-written LabView code. When initiated, the indenter applies and holds a 10% strain around the selected cells for 3 s before being lifted back up. The measured strain field is precise, and there is no loss ( 20 ). Throughout the field of visualization, the imposed strain field is homogeneous and isotropic, with small deviations attributable to the traction forces exerted by the cell. In the absence of cells, the strains are isotropic, homogeneous, and with no discernable evidence of hysteresis. To perform TFM, a Leica epifluorescence microscope is used to image the tracer particles and the cells throughout the stretch and recovery period. Several images are taken before stretching to establish a baseline, and images are taken at designated intervals following the stretch to monitor recovery. At the end of the time, the cells are removed by trypsinization, and a reference set of images without attached cells is taken. Substrate displacements are analyzed by comparing the bead images with and without cells using particle image velocimetry in a custom MATLAB code. Traction forces are calculated by applying a Fourier transform to the displacement field ( 16 ). The contractile moment is determined as an average measure of contractile force for each individual cell. The contractile moment is a weighted sum of traction stresses exerted by an adherent cell upon its substrate ( 16 ). In the contractile moment, these traction stresses are weighted more heavily by the magnitude of the local contractile stress applied, the amount of area over which those stresses are applied, and the distance of those applied stresses from the cell centroid. As such, bigger stresses applied over bigger areas at bigger distances get the biggest weight. The traction map and the bead pattern map are a one-to-one mathematical mapping of one another through the Boussinesq solution ( 16 ). The pattern of bead displacements extends well beyond the cell boundaries due to elastic deformation of the substrate. However, the Boussinesq solution transforms those displacements into the distribution of traction forces exerted by the cell that give rise to those displacements. For the time-resolved TFM measurements, all the calculations are referenced to the null frame. FRAP. WT and Vim −/− MEFs are transfected with an EGFP-actin plasmid using Lipofectamine 2000 transfection agent (Invitrogen) and imaged on the third day. FRAP is performed ( 24 ). Briefly, transfected cells are bleached for 1 s using the FRAP module within the Leica SP5 confocal software and monitored for 30 s, acquiring an image every 0.5 s using a 63×/1.2NA water-immersion objective. The measured intensities are normalized to the prebleach intensities of the region of interest (ROI), and the recovery curve is normalized by a control ROI to account for sample bleaching during image acquisition. Since the brightness varies from cell to cell, we also normalize the intensities to prebleach levels. The intensity recovery is fit by I(t) = C − A * exp(−t/τ), where τ is the time constant and C is the immobile fraction.
📊 Figures
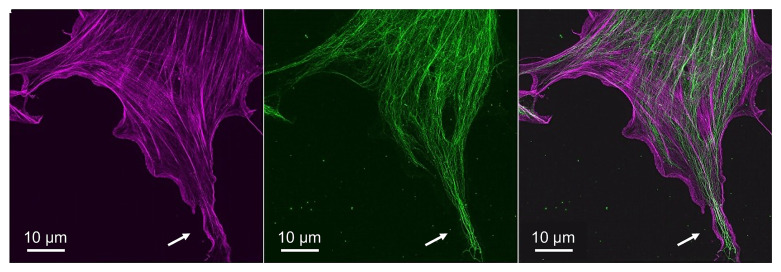
Fig. 1.
MEFs typically have an actin-rich periphery and cortex and a cytoplasmic core that contains more concentrated VIFs. ( A ) F-actin is indicated in magenta. ( B ) VIFs are indicated in green. ( C ) The ...
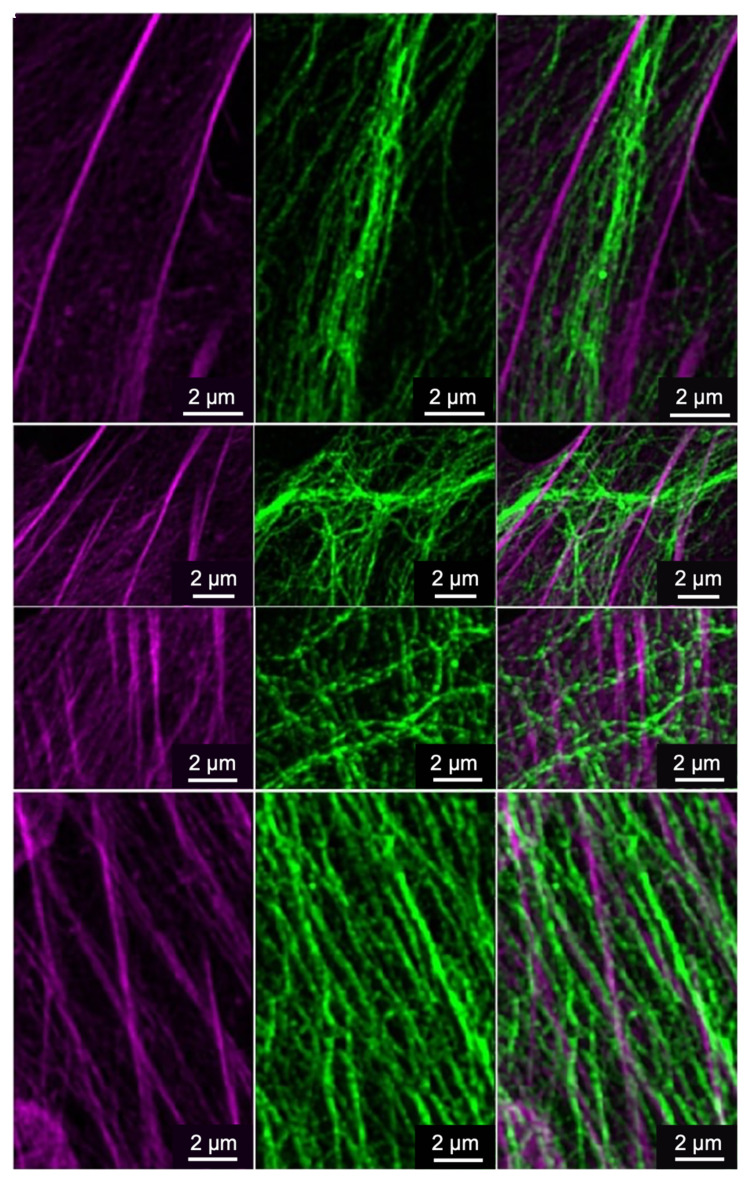
Fig. 2.
F-actin containing stress fibers and VIFs are in close proximity to the cell surface in the region of cellu2013substrate adhesion, as imaged by SIM: ( A ) parallel arrays, ( B ) bridging, ( C ) interl...
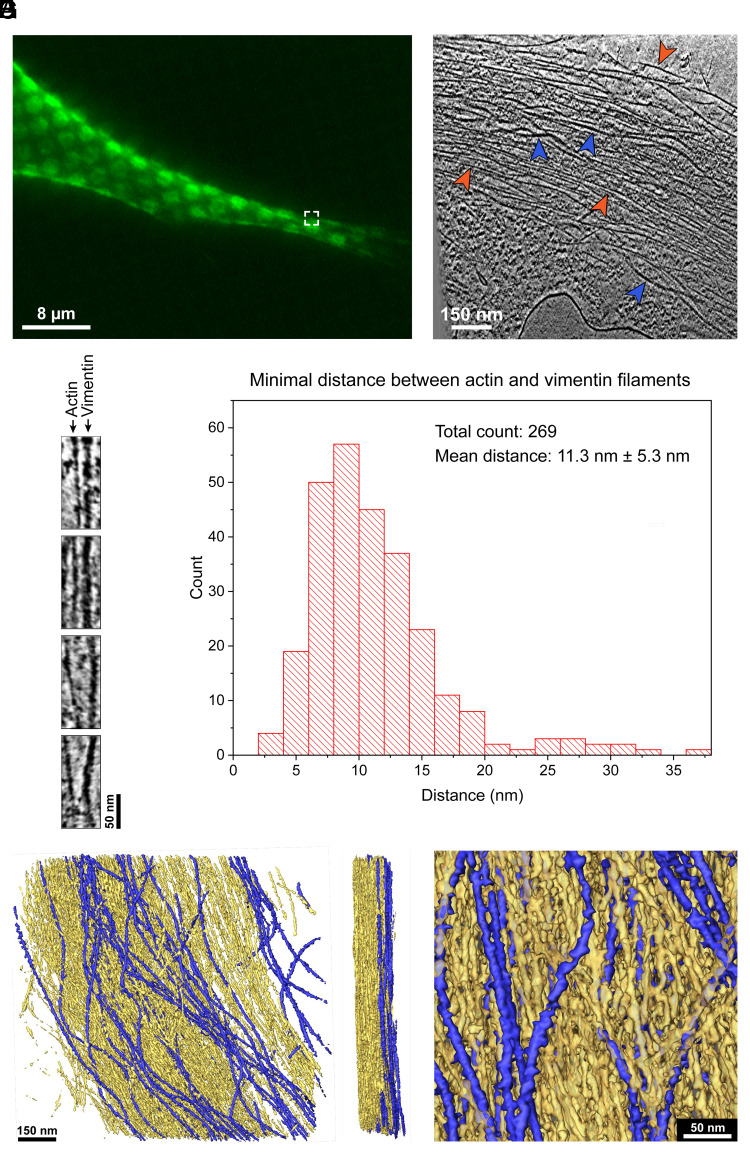
Fig. 3.
F-actinu2013VIF colocalization in stress fibers is revealed by cryo-ET. MEFs expressing emerald-vimentin are grown on electron microscopy grids and imaged by fluorescence as well as electron microscop...
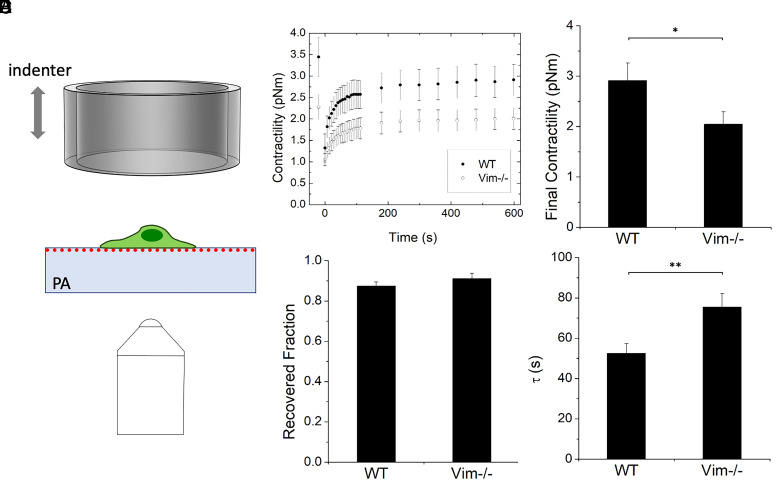
Fig. 4.
Transiently stretching cells fluidizes the F-actin cytoskeleton, but cell contractility recovers within several minutes coincident with its reassembly. ( A ) Schematic of the stretching setup. Cells a...
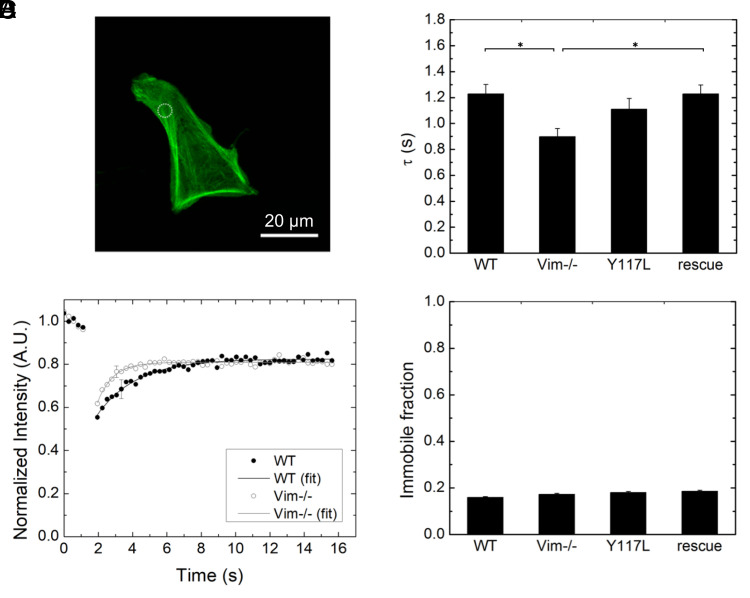
Fig. 5.
FRAP using EGFP-tagged actin shows that in the presence of VIF, G-actin diffusion-like motion decreases. ( A ) EGFP-actin (green) and bleach spot (white dashed circle) of a sample MEF. (Scale bar, 20 ...
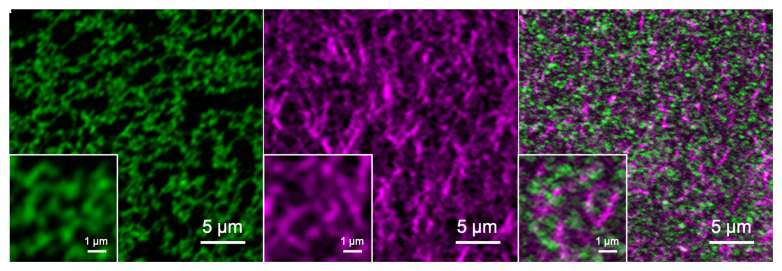
Fig. 6.
Confocal fluorescence images of reconstituted networks of ( A ) VIFs (green), ( B ) F-actin (magenta), and ( C ) a mixture of VIFs and F-actin. (Scale bars, 5 u00b5m.) ( Insets ) Enlarged views of the...
Figure images are served from the NIH/NLM PubMed Central Open Access Subset or Europe PMC; copyright remains with the publishers and authors.
💬 Discussion
0 commentsNo comments yet. Be the first to start a discussion!
Leave a Comment